UNITED STATES
SECURITIES AND EXCHANGE COMMISSION
Washington, D.C. 20549
Form 10-K
(Mark One)
| x | ANNUAL REPORT PURSUANT TO SECTION 13 OR 15(d) OF THE SECURITIES EXCHANGE ACT OF 1934 |
For fiscal year ended December 31, 2012
or
| ¨ | TRANSITION REPORT PURSUANT TO SECTION 13 OR 15(d) OF THE SECURITIES EXCHANGE ACT OF 1934 |
For the transition period from to .
Commission File Number 001-10932
WisdomTree Investments, Inc.
(Exact name of registrant as specified in its charter)
| Delaware | 13-3487784 | |
| (State or other jurisdiction of incorporation or organization) |
(IRS Employer Identification No.) | |
| 380 Madison Avenue, 21st Floor New York, New York |
10017 | |
| (Address of principal executive officers) | (Zip Code) |
212-801-2080
(Registrant’s Telephone Number, Including Area Code)
Securities registered pursuant to Section 12(b) of the Act:
| Title of each class: |
Name of each exchange on which registered: | |
| Common Stock, $0.01 par value | The NASDAQ Stock Market LLC |
Securities registered pursuant to Section 12(g) of the Act:
None
Indicate by check mark if the registrant is a well-known seasoned issuer, as defined in Rule 405 of the Securities Act. ¨ Yes x No
Indicate by check mark if the registrant is not required to file reports pursuant to Section 13 or Section 15(d) of the Act. ¨ Yes x No
Indicate by check mark whether the registrant (1) has filed all reports required to be filed by Section 13 or 15(d) of the Securities Exchange Act of 1934 during the preceding 12 months (or for such shorter period that the registrant was required to file such reports), and (2) has been subject to such filing requirements for the past 90 days. x Yes ¨ No
Indicate by check mark whether the registrant has submitted electronically and posted on its corporate Web site, if any, every Interactive Data File required to be submitted and posted pursuant to Rule 405 of Regulation S-T (§232.405 of this chapter) during the preceding 12 months (or for such shorter period that the registrant was required to submit and post such files). x Yes ¨ No
Indicate by check mark if disclosure of delinquent filers pursuant to Item 405 of Regulation S-K (§229.405 of this chapter) is not contained herein, and will not be contained, to the best of the registrant’s knowledge, in definitive proxy or information statements incorporated by reference in Part III of this Form 10-K or any amendment to this Form 10-K. x
Indicate by check mark whether the registrant is a large accelerated filer, an accelerated filer, a non-accelerated filer or a smaller reporting company. See definitions of “large accelerated filer,” “accelerated filer” and “smaller reporting company” in 12b-2 of the Exchange Act.
| ¨ Large accelerated filer | x Accelerated filer | |||
| ¨ Non-accelerated filer | (Do not check if a smaller reporting company) | ¨ Smaller reporting company | ||
Indicate by check mark whether the registrant is a shell company (as defined in Rule 12b-2 of the Exchange Act). Yes ¨ No x
At June 30, 2012, the aggregate market value of the registrant’s Common Stock held by non-affiliates (computed by reference to the price at which the Common Stock was last sold on the NASDAQ Global Market on June 30, 2012) was $446,355,000.
At March 6, 2013, there were 127,564,225 shares of the registrant’s Common Stock outstanding (voting shares).
WISDOMTREE INVESTMENTS, INC.
Form 10-K
For the Fiscal Year Ended December 31, 2012
TABLE OF CONTENTS
i
CAUTIONARY NOTE REGARDING FORWARD-LOOKING STATEMENTS
This Annual Report on Form 10-K contains forward-looking statements that are based on our management’s belief and assumptions and on information currently available to our management. Although we believe that the expectations reflected in these forward-looking statements are reasonable, these statements relate to future events or our future financial performance, and involve known and unknown risks, uncertainties and other factors that may cause our actual results, levels of activity, performance or achievements to be materially different from any future results, levels of activity, performance or achievements expressed or implied by these forward-looking statements.
In some cases, you can identify forward-looking statements by terminology such as “may,” “will,” “should,” “expects,” “intends,” “plans,” “anticipates,” “believes,” “estimates,” “predicts,” “potential,” “continue” or the negative of these terms or other comparable terminology. These statements are only predictions. You should not place undue reliance on forward-looking statements because they involve known and unknown risks, uncertainties and other factors, which are, in some cases, beyond our control and which could materially affect results. Factors that may cause actual results to differ materially from current expectations include, among other things, those listed in the section entitled “Risk Factors” and elsewhere in this Report. If one or more of these risks or uncertainties occur, or if our underlying assumptions prove to be incorrect, actual events or results may vary significantly from those implied or projected by the forward-looking statements. No forward-looking statement is a guarantee of future performance. You should read this Report and the documents that we reference in this Report and have filed with the Securities and Exchange Commission as exhibits to this Report, completely and with the understanding that our actual future results may be materially different from any future results expressed or implied by these forward-looking statements.
In particular, forward-looking statements in this Report include statements about:
| • | anticipated trends, conditions and investor sentiment in the global markets; |
| • | anticipated levels of inflows into and outflows out of our exchange traded funds (“ETFs”); |
| • | our ability to deliver favorable rates of return to investors; |
| • | our ability to develop new products and services; |
| • | our ability to maintain current vendors or find new vendors to provide services to us at favorable costs; |
| • | competition in our business; and |
| • | the effect of laws and regulations that apply to our business. |
The forward-looking statements in this Report represent our views as of the date of this Report. We anticipate that subsequent events and developments may cause our views to change. However, while we may elect to update these forward-looking statements at some point in the future, we have no current intention of doing so except to the extent required by applicable law. Therefore, these forward-looking statements do not represent our views as of any date other than the date of this Report.
1
| ITEM 1. | BUSINESS |
Our Company
We are the only publicly-traded asset management company that focuses exclusively on ETFs. We are the seventh largest ETF sponsor in the United States with assets under management, (“AUM”) of approximately $18.3 billion as of December 31, 2012. Our family of ETFs includes both fundamentally weighted funds that track our own indexes, and actively managed funds. We distribute our ETFs through all major channels within the asset management industry, including brokerage firms, registered investment advisors, institutional investors, private wealth managers and discount brokers.
We focus on creating ETFs for investors that offer thoughtful innovation, smart engineering and refined investing. We believe that our differentiated approach, employing a distinctive index-based methodology, delivers better risk adjusted returns over the long term. Our index-based funds employ a fundamental weighted investment methodology, which weights securities on the basis of factors such as dividends or earnings, whereas most other ETF indexes use a capitalization weighted methodology. Using our approach, 72% of the $15.4 billion invested in our 34 equity ETFs were in funds that, since their respective inceptions through December 31, 2012, outperformed their market capitalization weighted or competitive benchmarks. Similarly, 23 of our 34 equity ETFs have outperformed their market capitalization weighted or competitive benchmarks over the same period. In addition, we also offer actively managed ETFs, which are ETFs that are not based on a particular index but rather are actively managed with complete transparency into the ETF’s portfolio on a daily basis. Our exemptive relief enables us to use our own indexes for certain of our ETFs and actively manage other ETFs.
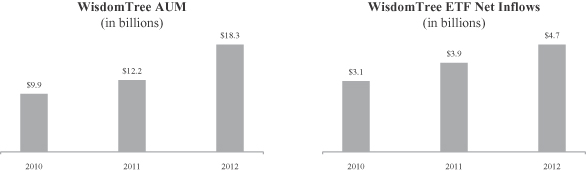
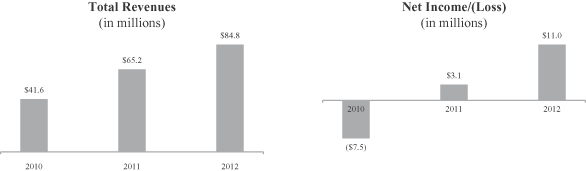
Despite a challenging economic environment, our AUM has been growing and reaching record levels each year from $9.9 billion at the end of 2010 to $18.3 billion at the end of 2012. Our net inflows have also been increasing during that same time period from $3.1 billion to $4.7 billion. As a result of strong net inflows and growth in our AUM, our revenues have increased from $41.6 million in 2010 to $84.8 million in 2012 which has helped improve our profitability from a net loss of $7.5 million in 2010 to net income of $11.0 million in 2012.
The following charts show our AUM, net inflows, revenues and net income/(loss) for the periods indicated:
2
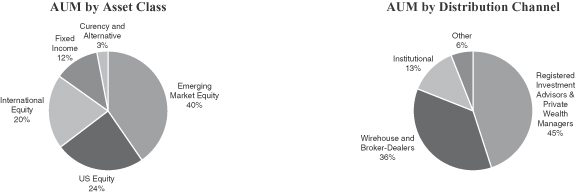
The following charts reflect the asset mix and distribution of our ETFs as of December 31, 2012:
Our Industry
An ETF is an investment fund that holds securities such as equities or bonds and/or other assets such as derivatives or commodities, and that generally trades at approximately the same price as the net asset value of its underlying components over the course of the trading day. ETFs offer exposure to a wide variety of asset classes and investment themes, including domestic, international and global equities, fixed income securities, as well as securities in specific industries and countries. There are also ETFs that track certain specific investments, such as commodities, real estate or currencies.
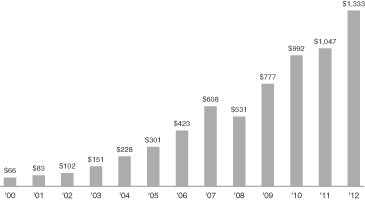
We believe ETFs have been one of the most innovative, revolutionary and disruptive investment products to emerge in the last two decades in the asset management industry. As of December 31, 2012, there were approximately 1,200 ETFs in the United States with aggregate AUM of $1.3 trillion. McKinsey & Company and Strategic Insights project the global aggregate AUM of ETFs could grow by $1.5 trillion by 2015, and Strategic
3
Insights predicts the U.S. ETF market will hit $2 trillion before the end of 2015. The chart below reflects the AUM of the ETF industry in the United States since 2000:
U.S ETF Industry AUM
(in billions)
Source: Investment Company Institute, Bloomberg, WisdomTree.
As of December 31, 2012, we were the seventh largest ETF sponsor in the United States by AUM and had the second highest percentage growth rate in AUM of the top ten ETF sponsors at the end of 2012:
| AUM as of December 31, 2012 |
2012 % Organic Growth in AUM |
|||||||
| (in billions) | ||||||||
| 1 iShares |
$ | 558.0 | 14 | % | ||||
| 2 StateStreet |
329.2 | 14 | % | |||||
| 3 Vanguard |
244.4 | 31 | % | |||||
| 4 PowerShares |
58.6 | 16 | % | |||||
| 5 Van Eck |
27.6 | 19 | % | |||||
| 6 ProShares |
21.1 | 5 | % | |||||
|
7 WisdomTree |
18.3 | 39 | % | |||||
| 8 Guggenheim |
12.4 | (3 | %) | |||||
| 9 Deutsche Bank |
11.7 | 7 | % | |||||
| 10 PIMCO |
9.1 | 122 | % | |||||
|
|
|
|||||||
| Top Ten Total |
1,290 | |||||||
|
|
|
|||||||
| Other ETF Sponsors |
42 | |||||||
|
|
|
|||||||
| Total U.S. ETF Industry AUM |
$ | 1,333 | ||||||
|
|
|
|||||||
Source: Bloomberg, WisdomTree
According to Morningstar, Inc., ETFs were initially marketed primarily to institutional investors. However, today, institutional investors account for only about half of the assets held in ETFs. ETFs have become more popular among a broad range of investors as they have come to realize their benefits and use them for a variety of purposes and strategies, including low cost index investing and asset allocation, access to specific asset classes, protective hedging, income generation, exploitation of arbitrage opportunities, and diversification strategies.
4
While ETFs are similar to mutual funds in many respects, they have some important differences as well:
| • | Transparency. ETFs disclose the composition of their underlying portfolios on a daily basis, unlike mutual funds which typically disclose their holdings only every 90 days. |
| • | Intraday trading, hedging strategies and complex orders. Like stocks, ETFs can be bought and sold on exchanges throughout the trading day at market prices. ETFs update the indicative values of their underlying portfolios every 15 seconds. As publicly-traded securities, ETF shares can be purchased on margin and sold short, enabling the use of hedging strategies, and traded using stop orders and limit orders, which allow investors to specify the price points at which they are willing to trade. |
| • | Tax efficiency. In the United States, whenever a mutual fund or ETF realizes a capital gain that is not balanced by a realized loss, it must distribute the capital gain to its shareholders. These gains are taxable to all shareholders, even those who reinvest the gain distributions in additional shares of the fund. However, most ETFs typically redeem their shares through “in-kind” redemptions in which low-cost securities are transferred out of the ETF in exchange for fund shares in a non-taxable transaction. As a practical matter, mutual funds cannot use this process. By using this process, ETFs avoid the transaction fees and tax impact incurred by mutual funds that sell securities to generate cash to pay out redemptions. |
| • | Uniform pricing. From a cost perspective, ETFs are one of the most equitable investment products on the market. Investors, regardless of their size, structure or sophistication, pay identical advisory fees. Unlike mutual funds, there are not different share classes or different expense structures for retail and institutional clients and ETFs are not sold with sales loads or 12b-1 fees. In many cases, ETFs offer lower expense ratios than comparable mutual funds. |
ETFs are used in various ways by a range of investors, from conservative to speculative uses including:
| • | Low cost index investing. Because of their low cost, ETFs are used by investors seeking to track a variety of indexes encompassing equities, commodities or fixed income over the short and long term. |
| • | Improved access to specific asset classes. Investors often use ETFs to gain access to specific market sectors or regions around the world by using an ETF that holds a portfolio of securities in that region or segment rather than buying individual securities. |
| • | Protective hedging. Investors seeking to protect their portfolios may use ETFs as a hedge against unexpected declines in prices. |
| • | Income generation. Investors seeking to obtain income from their portfolios may buy dividend-paying ETFs, which encompass a basket of dividend-paying stocks rather than buying individual stocks or a fixed income ETF that typically distributes monthly income. |
| • | Speculative investing. Investors with a specific directional opinion about a market sector may choose to buy or sell (long or short) an ETF covering or leveraging that market sector. |
| • | Arbitrage. Sophisticated investors may use ETFs in order to exploit perceived value differences between the ETF and the value of the ETF’s underlying portfolio of securities. |
| • | Asset allocation. Investors seeking to invest in various asset classes to develop an asset allocation model in a cost-effective manner can do so easily with ETFs, which offer broad exposure to various asset classes in a single security. |
| • | Diversification. By definition, ETFs represent a basket of securities and each fund may contain hundreds or even thousands of different individual securities. The “instant diversification” of ETFs provides investors with broad exposure to an asset class, market sector or geography. |
ETFs are one of the fastest growing sectors of the asset management industry, having expanded at a compound annual growth rate of 29% from $66 billion in AUM in 2000 to $1.3 trillion in AUM at the end of
5
2012. According to the Investment Company Institute, since 2007, ETF’s have generated approximately 50% of the total inflows into ETFs and long-term mutual funds. However, ETFs have generated positive inflows into equity funds of approximately $650 billion and long-term equity mutual funds have experienced outflows of approximately $450 billion. We believe this trend is due to the inherent superior benefits of ETFs, that is: transparency, liquidity and tax efficiency.
We believe our growth, and the growth of the ETF industry in general, will continue to be driven by the following factors:
| • | Education and greater investor awareness. Over the last several years, ETFs have been taking a greater share of inflows and AUM from mutual funds. We believe as a result of the recent market downturns, investors have become more aware of some of the deficiencies of their mutual fund and other financial products. In particular, we believe investors are beginning to focus on important characteristics of their traditional investments—namely transparency, tradability, liquidity, tax efficiency and fees. Their attention and education focused on these important investment characteristics may be one of the drivers of the shift in inflows from traditional mutual funds to ETFs. We believe as investors become more aware and educated about ETFs and their benefits, ETFs will continue to take market share from traditional mutual funds and other financial products or structures such as hedge funds, separate accounts and single stocks. |
| • | Move to fee-based models. Over the last several years, many financial advisors have changed the revenue model that they charge clients from one that is “transaction-based,” that is, based on commissions for trades or receiving sales loads, to a “fee-based” approach, where an overall fee is charged based on the value of AUM. This fee-based approach lends itself to the advisor selecting no-load, lower-fee financial products, and in our opinion, better aligns advisors with the interests of their clients. Since ETFs generally charge lower fees than mutual funds, we believe this model shift will benefit the ETF industry. As major brokerage firms and asset managers encourage their advisors to move towards fee-based models, we believe overall usage of ETFs will likely increase. |
| • | Innovative product offerings. Historically, ETFs tracked traditional equity indexes, but the volume of ETF growth has led to significant innovation and product development. As demand increased, the number of ETFs has also increased and today, ETFs are available for virtually every asset class including commodities, fixed income, alternative strategies, leveraged/inverse, real estate and currencies. We believe, though, that there remain substantial areas for ETF sponsors to continue to innovate, including alternative-based strategies, hard and soft commodities, and actively-managed strategies. We believe the further expansion of ETFs will fuel further growth and investments from investors who typically access these products through hedge funds, separate accounts, stock investments or the futures and commodity markets. |
| • | New distribution channels. Discount brokers, including E*Trade, TD Ameritrade, Schwab and Fidelity, now offer free trading and promotion of select ETFs. We believe the promotion of ETF trading by discount brokers and their marketing of ETFs to a wider retail channel will contribute to the future growth of ETFs. |
| • | Changing demographics. As the “baby boomer” generation continues to mature and retire, we expect that there will be a greater demand for a broad range of investment solutions, with a particular emphasis on income generation and principal protection, and that more of these investors will seek advice from professional financial advisors. We believe these financial advisors will migrate more of their clients’ portfolios to ETFs due to their lower fees, better fit within fee-based models, and their ability to (i) provide access to more diverse market sectors, (ii) improve multi-asset class allocation, and (iii) be used for different investment strategies, including income generation. Overall, we believe ETFs are well-suited to meet the needs of this large and important group of investors. |
| • | Expansion into 401(k) retirement plans. Historically, 401(k) plans were almost exclusively comprised of mutual funds. However, we believe ETFs are particularly well-suited to 401(k) retirement plans and |
6
| that these plans present a large and growing opportunity for our industry. ETFs are easy-to-implement, fully transparent investment vehicles covering the full range of asset allocation categories, and are available at significantly lower costs than most traditional mutual funds. In addition, regulatory reform laws which recently went into effect require 401(k) retirement plan sponsors to disclose all fees associated with their plans. While it may take several years for the fee disclosures to be fully analyzed and understood by plan sponsors and their participants, we believe that as investors become aware of fees associated with using mutual funds in traditional 401(k) retirement plans, they will replace higher fee mutual funds with ETFs because of their lower fees. |
Our Competitive Strengths
| • | Well-positioned in large and growing markets. We believe that ETFs are well-positioned to grow significantly faster than the asset management industry as a whole, making our concentration in ETFs a significant advantage versus other traditional asset management firms. In 2010, 2011 and 2012, our AUM grew among the fastest rate of the top 10 ETF sponsors and at December 31, 2012 we are the seventh largest ETF sponsor in the United States by AUM. Within the ETF industry, being a first mover, or one of the first providers of ETFs in a particular asset class, can be a significant advantage. We believe that our early leadership in a number of asset classes positions us well to maintain a leadership position. |
| • | Strong performance through a differentiated approach. We create our own indexes, rebalanced annually, that weight companies in our equity ETFs by a measure of fundamental value. In contrast, traditional indexes are market capitalization weighted and tend to track the momentum of the market. Using our approach, 72% of the $15.4 billion invested in our 34 equity ETFs were in funds that, since their respective inceptions through December 31, 2012, outperformed their market capitalization weighted or competitive benchmarks. Similarly, 23 of our 34 equity ETFs have outperformed their market capitalization weighted or competitive benchmarks over the same period. In addition, we also offer actively managed ETFs, which are ETFs that are not based on a particular index but rather are actively managed with complete transparency into the ETF’s portfolio on a daily basis. We believe our approach differentiates us from our competitors and will allow us to take a greater share of the expected growth in the ETF market. |
| • | Diversified product set, powered by innovation. We have a broad and diverse product set. Our products span a variety of traditional and high growth asset classes, including emerging markets, international and U.S. equities, currencies, international fixed income, and alternatives, and include both passive and actively managed funds. Our product development, research and sales teams work closely to identify potential new ETFs for the marketplace. Because we have the regulatory exemptive relief that enables us to use our own indexes for our ETFs, we have the ability to create certain indexes and related ETFs more rapidly than many of our competitors who must license indexes from third party index providers. Our exemptive relief also enables us to offer actively managed funds. Our innovations include launching the industry’s first emerging markets small cap equity ETF, the first actively managed currency ETFs, one of the first international local currency denominated fixed income ETFs and the first managed futures strategy ETF. We believe that our expertise in product development combined with our regulatory exemptive relief provides a strategic advantage, enabling us to launch innovative ETFs that others may not be able to launch as quickly. |
| • | Extensive marketing, research and sales efforts. We have invested significant resources to establish the WisdomTree brand through targeted television, print and online advertising, social media, as well as through our public relations efforts. The majority of our employees are dedicated to marketing, research and sales. Our sales professionals are the primary points of contact for financial advisors who use our ETFs. Their efforts are enhanced through value-added services provided by our research and marketing efforts. We have strong relationships with financial advisors at leading national brokerage firms, registered investment advisors and high net worth advisors. We believe the recent growth we |
7
| have experienced by strategically aligning these advisor relationships and marketing campaigns with targeted research and sales initiatives differentiates us from our competitors and contributes to our strong inflows. |
| • | Efficient business model with lower risk profile. We have invested heavily in the internal development of our core competencies with respect to product development, marketing, research and sales of ETFs. We outsource to third parties those services that are not our core competencies or may be resource or risk intensive, such as the portfolio management responsibilities and fund accounting operations of our ETFs. In addition, since we create our own indexes, we do not incur licensing costs and can therefore be more competitive in terms of the fees we charge for our index-based ETFs. We have already made substantial investments in our core competencies, and we expect to be able to leverage these existing capabilities across our business, positioning us to maintain both growth and profitability. |
| • | Strong, seasoned and creative management team. We have built a strong and dedicated senior leadership team. Most of our leadership team has significant ETF or financial services industry experience in fund operations, regulatory and compliance oversight, product development and management or marketing and communications. We believe our team, by developing an ETF sponsor from the ground up despite significant competitive, regulatory and operational barriers, has demonstrated an ability to innovate as well as recognize and respond to market opportunities and effectively execute our strategy. |
Our Growth Strategies
Our goal is to be among the top five U.S. sponsors in the ETF industry, where scale is a competitive advantage. In 2009, we were the eleventh largest ETF sponsor. We increased our AUM to become the eighth largest ETF sponsor in 2010 and, as of December 31, 2012 we were the seventh largest. We believe our continued execution will enable us to increase trading volumes and build longer performance track records, which should allow us to attract additional investors and, in turn, further grow our AUM. We will seek to increase our market share and build additional scale by continuing to implement the following growth strategies:
| • | Increase penetration within existing distribution channels. We believe there is an opportunity to increase our market share by further penetrating existing distribution channels and by cross-selling additional WisdomTree ETFs. In order to achieve these objectives, we intend to continue our strategy of targeted advertising and direct marketing, coupled with our research-focused sales support initiatives, to enhance product awareness and increase our market share of ETF net inflows. Our share of ETF industry net inflows has fluctuated from 2.7% in 2010, to 3.3% in 2011 and 2.6% in 2012. |
| • | Launch innovative new products that diversify our product offerings and revenues. We believe our track record has shown that we can create and sell innovative ETFs that meet market demand. We believe that continued launches of new products will strengthen our business by allowing us to realize additional inflows, maintain and grow our AUM and generate revenues across different market cycles as particular investment strategies move in and out of favor. |
| • | Expand internationally. To date, our sales and marketing has been principally focused on the domestic U.S. market. However, since April 2010, 12 of our ETFs have been cross-listed in the special international section on the Mexican stock exchange, Bolsa Mexicana De Valores, where certain institutional investors trade foreign securities in Mexico. As ETFs are increasingly traded globally we believe that international expansion of our marketing, communication and sales strategies will provide significant new growth avenues. We have also established an international Trust to give us the option to capitalize on growth opportunities outside of the United States. |
| • | Selectively pursue acquisitions or partnerships. We may pursue acquisitions or enter into partnerships or other commercial arrangements that will enable us to strengthen our current business, expand and diversify our product offering, increase our AUM or enter into new markets. We believe entering into partnerships or pursuing acquisitions is a cost-effective means of growing our business and AUM. For |
8
| example, in 2007, we purchased certain assets and intellectual property from Treasury Equity, LLC which formed the basis for our currency ETFs. In addition, in 2008, we entered into a joint venture with Mellon Capital Management Corporation (“Mellon Capital”) and The Dreyfus Corporation (“Dreyfus”) with respect to our currency and fixed income ETFs, which enabled us to bring these ETFs to market faster than would otherwise have been possible. This joint venture ended at the end of 2012. |
Regulatory Framework of the ETF Industry
Not all exchange traded products, or ETPs, are ETFs. ETFs are a distinct type of security with features that are different than other ETPs. ETFs are open-end investment companies or unit investment trusts regulated by the Investment Company Act of 1940 (“Investment Company Act”). This regulatory structure is designed to provide investor protection within a pooled investment product. For example, the Investment Company Act requires that at least 40% of the Trustees for each ETF must not be affiliated persons of the fund’s investment manager (“Independent Trustees”). If the ETF seeks to rely on certain rules under the Investment Company Act, a majority of the Trustees for that ETF must be Independent Trustees. In addition, as discussed below, ETFs have received orders from the staff of the SEC which exempt them from certain provisions of the Investment Company Act; however, ETFs generally operate under regulations that prohibit affiliated transactions, are subject to standard pricing and valuation rules and have mandated compliance programs. ETPs can take a number of forms other than ETFs, including exchange traded notes, grantor trusts or limited partnerships. A key factor differentiating ETFs, grantor trusts and limited partnerships from exchange traded notes is that the former hold assets underlying the ETP. Exchange traded notes on the other hand are debt instruments issued by the exchange traded note sponsor. Also, each of these structures has implications for taxes, liquidity, tracking error and credit risk.
Because ETFs do not fit into the regulatory provisions governing mutual funds, ETF sponsors need to obtain from the SEC “exemptive relief” from certain provisions of the Investment Company Act in order to operate ETFs. This exemptive relief allows the ETF sponsor to bring products to market for the specific products or structures they have applied for. Applying for exemptive relief can be costly and take several months to several years depending on the type of exemptive relief sought. See “Business—Regulation” below.
Our Products
As of December 31, 2012, we offered a comprehensive family of 46 ETFs, which includes 34 international and domestic equity ETFs, five currency ETFs, five international fixed income ETFs and two alternative ETFs. 43 of our ETFs are listed on NYSE Arca, a listing venue of NYSE Euronext, and three of our ETFs are listed on the NASDAQ Stock Market. Since April 2010, 12 of our ETFs have also been cross-listed on the Mexican stock exchange.
The type and AUM for each of our ETFs as of December 31, 2012:
| Number of Funds |
Type | AUM | ||||||||
| (in billions) | ||||||||||
| Equity ETFs: |
||||||||||
| U.S. Equity ETFs |
11 | Index based | $ | 4.4 | ||||||
| Emerging Markets Equity ETFs |
5 | Index based | 7.3 | |||||||
| International Developed Equity ETFs |
18 | Index based | 3.8 | |||||||
| Currency ETFs |
5 | Actively Managed | 0.6 | |||||||
| International Fixed Income ETFs |
5 | Actively Managed | 2.1 | |||||||
| Alternative Strategy ETFs |
2 | Actively Managed | 0.1 | |||||||
|
|
|
|
|
|||||||
| Total |
46 | $ | 18.3 | |||||||
|
|
|
|
|
|||||||
9
Equity ETFs
We offer equity ETFs that offer access to the securities of large, mid and small-cap companies located in the United States, developed markets and emerging markets, as well as particular market sectors, including basic materials, energy, utilities and real estate. Our equity ETFs track our own fundamentally weighted indexes, as opposed to market capitalization weighted indexes, which assign more weight to stocks with the highest market capitalizations. These fundamentally weighted indexes focus on securities of companies that pay regular cash dividends or on securities of companies that have generated positive cumulative earnings over a certain period. We believe these factors, rather than market capitalization alone, can provide investors with better risk-adjusted returns over the long term. All of our equity ETFs, with the exception of one, is sub-advised by Mellon Capital, a subsidiary of The Bank of New York Mellon Corporation (“BNY Mellon”). One of our equity ETFs is sub-advised by Old Mutual Global Index Trackers (Pty) Limited, a subsidiary of Old Mutual PLC.
Currency ETFs
We launched the industry’s first currency ETFs in May 2008 using an actively managed strategy. We offer currency ETFs that provide investors with exposure to developed and emerging market currencies, including the Chinese Yuan and the Brazilian Real. Currency ETFs invest in U.S. money market securities, forward currency contracts and swaps and seek to achieve the total returns reflective of both money market rates in selected countries available to foreign investors and changes to the value of these currencies relative to the U.S. dollar. Our Currency ETFs are sub-advised by Mellon Capital.
International Fixed Income ETFs
In 2010, we began launching international fixed income ETFs that invest in emerging market countries, Asia Pacific ex-Japan countries or European countries. These ETFs are denominated in either local or U.S. currencies. We intend to launch additional fixed income bond funds and broaden our product offerings in this category. Our fixed income ETFs are sub-advised by either Mellon Capital or Western Asset Management, a subsidiary of Legg Mason.
Alternative Strategy ETFs
In 2011, we launched the industry’s first managed futures strategy ETF and a global real return ETF. We also intend to explore additional alternative strategy products in the future. Our alternative ETFs are sub-advised by Mellon Capital.
Index Based ETFs
Our equity ETFs seek to track our own fundamentally weighted indexes. Most of today’s ETFs track market capitalization weighted indexes and most of these indexes are licensed from third parties by ETF sponsors. Market capitalization weighted ETFs assign more weight to stocks with the highest market capitalizations, which is a function of stock price. We believe this means that if a stock is overvalued, market capitalization weighted funds will give the overvalued stock greater weight as its price and market capitalization increase. The opposite is true if a stock is undervalued, as market capitalization weighted funds will give it less weight. Without a way to rebalance away from these stocks, we believe market capitalization weighted funds essentially hold more of a company’s stock as its price is going up and less as the price of the company’s stock is going down. In other words, we believe these funds buy high and sell low. Market history includes many points in time when stocks were overvalued, for example, the technology and dot-com bubble of the late 1990s. We believe this structural flaw of market capitalization weighted indexes can expose investors in products based upon such indexes to potentially higher risks and lower returns.
To address the structural flaw of market capitalization-weighting, we developed fundamentally weighted indexes that weight companies by a measure of fundamental value instead of market capitalization using a rules-
10
based methodology. After researching fundamental indicators of value, we believe the most effective metrics are cash dividends or earnings. Our research indicated that weighting by cash dividends or earnings provided investors with better risk adjusted returns than market capitalization weighted indexes. The rules-based methodology that we created weights companies in our index based on either dividends or earnings in order to magnify the effect that dividends or earnings play on the total return of the index. For example, in our typical U.S. based indexes under our rules-based methodology, we weight each company based on their projected cash dividends to be paid over the coming year over the sum of the projected cash dividends to be paid by all companies in the index or we weight each company based on their previous annual earnings over the sum of the earnings by all companies in the index. Our funds are rebalanced annually and designed to reset back to an indicator of fundamental value—either cash dividends paid or earnings generated. All of our index equity ETFs are based on this approach. We believe this fundamentally weighted approach offers better returns than comparable ETFs or mutual funds tracking market capitalization weighted indexes over the long-term.
We benchmark our fundamentally weighted indexes against traditional market capitalization weighted indexes designed to track similar companies, sectors, regions or exposure. Using our approach, 72% of the $15.4 billion invested in our 34 equity ETFs were in funds that, since their respective inceptions through December 31, 2012, outperformed their market capitalization weighted or competitive benchmarks. Similarly, 23 of our 34 equity ETFs have outperformed their market capitalization weighted or competitive benchmarks over the same period. We believe this outperformance has been achieved primarily due to the weighting and selection of companies in our fundamentally weighted indexes using our rules-based methodology, rather than market capitalization weighted indexes.
Actively Managed ETFs
In 2008, we obtained regulatory approval to launch actively managed ETFs, which are ETFs that are not based on an index but rather are actively managed with complete transparency of the ETF’s portfolio on a daily basis. Currently, we are one of several ETF sponsors that have already received the necessary exemptive relief from the SEC to launch actively managed ETFs. This has enabled us to develop products not yet offered by other ETF sponsors. See “Business—Regulation”, below. Our actively managed ETFs includes currency, international fixed income and alternative strategy ETFs.
The securities purchased and sold by our ETFs include U.S. and foreign equities, forward currency contracts and U.S. and foreign debt instruments. In addition, we enter into derivative transactions, in particular U.S. listed futures contracts, non-deliverable currency forward contracts, and total return swap agreements in order to gain exposure to commodities, foreign currencies, and interest rates. The exchanges these securities trade on include all the major exchanges worldwide.
Sales, Marketing and Research
We distribute our ETFs through all major channels within the asset management industry, including brokerage firms, registered investment advisors, institutional investors, private wealth managers and discount brokers. We do not target our ETFs for sale directly to the retail segment but rather to the financial or investment advisor who acts as the intermediary between the end-client and us. We do not pay commissions nor do we offer 12b-1 fees to financial advisors to use or recommend the use of our ETFs.
We have developed an extensive network and relationships with financial advisors and we believe our ETFs and related research are well structured to meet their needs and those of their clients. Our sales professionals act in a consultative role to provide the financial advisor with value-added services. We seek to consistently grow our network of financial advisors and we opportunistically seek to introduce new products that best deliver our investment strategies to investors through these distribution channels. We have our own team of 32 sales professionals located in the United States as of December 31, 2012.
11
In addition, we have agreements with third parties to serve as the external marketing agents for the WisdomTree ETFs in Latin America as well as with E*Trade Financial to allow our ETFs to trade commission free on its brokerage platform in exchange for a percentage of our advisory fee revenue from certain AUM. We believe these arrangements expand our distribution capabilities in a cost-effective manner and we may continue to enter into such arrangements in the future.
Our marketing effort is focused on three objectives: (1) generating new clients and inflows to our ETFs; (2) retaining existing clients, with a focus on cross-selling additional WisdomTree ETFs; and (3) building brand awareness. We pursue these objectives through a multi-faceted marketing strategy targeted at financial advisors within the asset management industry. We utilize the following strategies:
| • | Targeted advertising. We create highly targeted multi-media advertising campaigns limited to established core financial media. For example, our television advertising runs exclusively on the cable networks CNBC and Bloomberg Television; online advertising runs on investing or ETF-specific web sites, such as www.seekingalpha.com and www.etfdatabase.com; and print advertising runs in core financial publications, including Barron’s and Institutional Investor. |
| • | Media relations. We have a full time public relations team who have established relationships with the major financial media outlets including: the Wall Street Journal, Barron’s, the Financial Times, Bloomberg, Reuters and USA Today. We utilize these relationships to help create awareness of the WisdomTree ETFs and the ETF industry in general. Several members of management team are frequent market commentators and conference panelists. |
| • | Direct marketing. We have a database of financial advisors to which we regularly market through targeted and segmented communications, such as on-demand research presentations, ETF-specific or educational events and presentations, quarterly newsletters and market commentary from our senior investment strategy advisor, Professor Jeremy Siegel. |
| • | Social Media. We have implemented a social media strategy that allows us to connect directly with financial advisors and investors by offering timely access to our research material and more general market commentary. Our social media strategy allows us to continue to enhance our brand reputation of expertise and thought leadership in the ETF industry. |
| • | Sales support. We create comprehensive materials to support our sales process including whitepapers, research reports, investment ideas and performance data for all WisdomTree ETFs. |
We will continue to evolve our marketing and communication efforts in response to changes in the ETF industry, market conditions and marketing trends.
Our research team has three core functions: index development and oversight, investment research and sales support. In its index development role, the research group is responsible for creating the investment methodologies and overseeing the maintenance of our indexes that WisdomTree’s equity ETFs are designed to track. The team also provides a variety of investment research around these indexes and market segments. Our research is typically academic-type research to support our products, including white papers on the strategies underlying our indexes and ETFs, investment insights on current market trends, and types of investment strategies that drive long-term performance. We distribute our research through our sales professionals, online through our website, targeted emails to financial advisors, or through financial media outlets, including interviews on CNBC and Bloomberg. On some occasions our research has been included in “op-ed” articles appearing in the Wall Street Journal. Shorter research notes are also developed to promote our ideas which are distributed online through social media channels. Finally, the research team supports our sales professionals in meetings as market experts and through custom analysis on client portfolio holdings. In addition, we consult with our senior investment strategy advisor, Professor Jeremy Siegel, on product development ideas and market commentaries.
12
Competition
The asset management industry is highly competitive and we face substantial competition in virtually all aspects of our business. Factors affecting our business include fees for our products, investment performance, brand recognition, business reputation, quality of service and the continuity of our financial advisor relationships. We compete directly with other ETF sponsors and mutual fund companies and indirectly against other investment management firms, insurance companies, banks, brokerage firms and other financial institutions that offer products that have similar features and investment objectives to those offered by us. The vast majority of the firms we compete with are subsidiaries of large diversified financial companies and many others are much larger in terms of AUM, years in operations and revenues and, accordingly, have much larger sales organizations and budgets. In addition, these larger competitors may attract business through means that are not available to us, including retail bank offices, investment banking, insurance agencies and broker-dealers.
Our competitors, Vanguard, Charles Schwab, and BlackRock (through their iShares ETF family), are engaged in significant price competition and have lowered fees or launched new ETFs offering similar investment strategies with lower fees as well as waived trading commissions. The ETFs subject to this intense price competition typically track broad based market capitalization weighted equity indexes. We do compete against these firms for similar related equity strategies, however, our indexes are fundamentally weighted, not market capitalization weighted. Two index developers have created a series of fundamentally weighted indexes, using a different approach than ours. If price competition intensifies or we begin to compete with other ETF sponsors using a fundamentally weighted approach that is similar to ours at a lower price than ours, we may be required to reduce the advisory fees we charge in order to compete.
In 2008, the SEC announced a proposal to allow ETFs to form and operate without the need to obtain exemptive relief. This proposed rule has not yet been adopted and we do not know if or when it may be adopted. In March 2010, the SEC announced it would defer approval of applications for exemptive relief for ETFs that make significant use of derivatives pending a review by the SEC of the use of derivatives by mutual funds, ETFs and other investment companies. This moratorium was lifted in December 2012 and now potential competitors with the exemptive relief can compete with certain of our products. However, to date the SEC has not indicated whether the review time period or process required to obtain the initial exemptive relief will be altered. In addition, certain large mutual fund complexes have obtained exemptive relief to launch actively managed ETFs but have not done so yet. Removing the time barrier to obtain exemptive relief may bring additional competitors into the marketplace.
We believe our ability to successfully compete will depend largely on our competitive fee structure and our ability to achieve consistently strong investment performance, develop distribution relationships, create new investment products, offer a diverse platform of investment choices, build upon our successful brand and attract and retain talented sales professionals and other employees.
Regulation
The investment management industry is subject to extensive regulation and virtually all aspects of our business are subject to various federal and state laws and regulations. These laws and regulations are primarily intended to protect investment advisory clients and shareholders of registered investment companies. These laws generally grant supervisory agencies broad administrative powers, including the power to limit or restrict the conduct of our business and to impose sanctions for failure to comply with these laws and regulations. Further, such laws and regulations may provide the basis for litigation that may also result in significant costs to us.
We are currently subject to the following laws and regulations, among others. The costs of complying with such laws and regulations have increased and will continue to contribute to the costs of doing business:
| • | The Investment Advisers Act of 1940 (“Investment Advisers Act”)—The SEC is the federal agency generally responsible for administering the U.S. federal securities laws. Our subsidiary, WisdomTree Asset Management, Inc. (“WTAM”), is registered as an investment adviser under the Investment |
13
| Advisers Act and, as such, is regulated by the SEC. The Investment Advisers Act requires registered investment advisers to comply with numerous and broad obligations, including, among others, recordkeeping requirements, operational procedures, registration and reporting and disclosure obligations. |
| • | The Investment Company Act of 1940—The WisdomTree ETFs are registered with the SEC pursuant to the Investment Company Act. The WisdomTree ETFs must comply with the requirements of the Investment Company Act and related regulations, as well as conditions imposed in the exemptive orders received by the ETFs, including, among others, requirements relating to operations, fees charged, sales, accounting, recordkeeping, disclosure and governance. |
| • | Broker-Dealer Regulations—Although we are not registered with the SEC as a broker-dealer under the Securities Exchange Act of 1934, as amended, nor are we a member firm of the Financial Industry Regulatory Authority (FINRA), many of our employees, including all of our salespersons, are licensed with FINRA and are registered as associated persons of the distributor of the WisdomTree ETFs and, as such, are subject to the regulations of FINRA that relate to licensing, continuing education requirements and sales practices. FINRA also regulates the content of our marketing and sales material. |
| • | Internal Revenue Code—WisdomTree Trust generally has obligations with respect to the qualification of the registered investment company for pass-through tax treatment under the Internal Revenue Code. |
| • | U.S. Commodity Futures Trading Commission (CFTC)—In 2012, the CFTC adopted regulations that have required us to become a member of the National Futures Association and register as a Commodity Pool Operator for a select number of our ETFs. |
| • | Dodd-Frank Wall Street Reform and Consumer Protection Act of 2010—This comprehensive overhaul of the financial services regulatory environment requires federal agencies to implement numerous new rules, which, as they are adopted may impose additional regulatory burdens and expenses on our business. |
Because ETFs do not fit into the regulatory provisions governing mutual funds, ETF sponsors need to obtain from the SEC exemptive relief from certain provisions of the Investment Company Act in order to operate ETFs. This exemptive relief allows the ETF sponsor to bring products to market for the specific products or structures they have applied for. Applying for exemptive relief can be costly and take several months to several years depending on the type of exemptive relief sought.
FINRA rules and guidance may affect how WisdomTree ETFs are sold by member firms. Although WisdomTree does not offer so-called leveraged ETFs, which may include within their holdings derivative instruments such as options futures or swaps, recent FINRA guidance on margin requirements and suitability determinations with respect to customers trading in leveraged ETFs may influence how member firms effect sales of certain WisdomTree ETFs, such as currency ETFs, which also use some forms of derivatives, including forward currency contracts and swaps.
Finally, our common stock is traded on the NASDAQ Global Market and we are therefore also subject to their rules including corporate governance listing standards. In addition, the WisdomTree ETFs are listed on NYSE Arca or the NASDAQ Market, and accordingly are subject to the listing requirements of those exchanges.
Property
Our principal executive office is located at 380 Madison Ave, New York, New York 10017. We occupy approximately 20,000 square feet of office space under a lease that expires in January 2014. We have begun the search for new office space given the impending end of our lease term.
14
Intellectual Property
We regard our name, WisdomTree, as material to our business and have registered WisdomTree® as a service mark with the U.S. Patent and Trademark Office and in various foreign jurisdictions.
Our index-based equity ETFs are based on our own indexes and we do not license them from, nor do we pay licensing fees to, third parties for these indexes.
On March 6, 2012, the U.S. Patent and Trademark Office issued to us our patent on Financial Instrument Selection and Weighting System and Method, which is embodied in our dividend weighted equity indexes. We also have two patent applications pending with the U.S. Patent and Trademark office that relate to the operation of our ETFs and our index methodology. There is no assurance that patents will be issued from these applications and we currently do not rely upon our recently issued or future patents for a competitive advantage.
Employees
As of December 31, 2012, we had 70 full-time employees. Of these employees, 32 are engaged in our sales function with the remainder providing managerial, finance, marketing, legal, regulatory compliance, operations and research functions. None of our employees are covered by a collective bargaining agreement and we consider our relations with employees to be good.
Segment and Geographic Areas
We operate as one business segment, as an ETF sponsor and asset manager providing investment advisory services. Revenues are derived in the U.S. and all of our assets are located in the U.S.
Available Information
Company Website and Public Filings
Our website is located at www.wisdomtree.com, and our investor relations website is located at http://ir.wisdomtree.com/. We make available, free of charge through our investor relations website, our Annual Reports on Form 10-K, Quarterly Reports on Form 10-Q and Current Reports on Form 8-K, and amendments to those reports, filed or furnished pursuant to Sections 13(a) or Section 15(d) of the Securities Exchange Act of 1934, as amended, as soon as reasonably practicable after they have been electronically filed with, or furnished to, the SEC. The public may read and copy any materials filed by us with the SEC at the SEC’s Public Reference Room at 100 F Street, NE, Washington, D.C., 20549. The public may obtain information on the operation of the Public Reference Room by calling the SEC at 1-800-SEC-0330. The SEC maintains a website that contains reports, proxy and information statements, and other information regarding the Company at www.sec.gov.
We webcast our earnings calls and certain events we participate in or host with members of the investment community on our investor relations website. Additionally, we provide notifications of news or announcements regarding our financial performance, including SEC filings, investor events, press and earnings releases as part of our investor relations website. Further corporate governance information, including board committee charters and code of conduct, is also available on our investor relations website under the heading “Corporate Governance.” The contents of our websites are not incorporated by reference into this Annual Report on Form 10-K or in any other report or document we file with the SEC, and any references to our websites are intended to be inactive textual references only.
15
| ITEM 1A. | RISK FACTORS |
Any investment in our common stock involves a high degree of risk. You should consider carefully the specific risk factors described below in addition to the other information contained in this Report before making a decision to invest in our common stock. If any of these risks actually occur, our business, operating results, financial condition and prospects could be harmed. This could cause the trading price of our common stock to decline and a loss of all or part of your investment. Certain statements below are forward-looking statements. See the section entitled “Cautionary Note Regarding Forward-Looking Statements.”
Risks Related to Our Business and Our Industry
We have only a limited operating history and, as a result, recent historical growth may not provide an accurate representation of the growth we may experience in the future, which may make it difficult to evaluate our future prospects.
We launched our first 20 ETFs in June 2006 and have only a limited operating history in the asset management business upon which an evaluation of our performance can be made. We have incurred significant losses since we launched our first ETFs. We first reported net income in the first quarter of 2011 and we only began to generate positive cash flow on a full quarterly basis in the second fiscal quarter of the year ended December 31, 2010 and, as a result, recent historical growth may not provide an accurate representation of the growth we may experience in the future, which may make it difficult to evaluate our future prospects. Although we have reported net income for the 2011 and 2012 fiscal years, we may not be able to maintain or increase our level of profitability. Prior to generating net income for 2011, we incurred net losses of $27.0 million, $21.2 million and $7.5 million in 2008, 2009 and 2010, respectively. Even though we have achieved profitability, because of the various risks outlined in this Report, we cannot assure you that we will continue to be profitable.
Challenging global market conditions associated with declining prices of securities can adversely affect our business by reducing the market value of the assets we manage or causing WisdomTree ETF shareholders to sell their fund shares and trigger redemptions.
We are subject to risks arising from adverse changes in global market conditions and the declining prices of securities, which may result in a decrease in demand for investment products, a higher redemption rate and/or a decline in AUM. The securities markets are highly volatile and securities prices may increase or decrease for many reasons, including general economic conditions, political events, acts of terrorism and other matters beyond our control. Substantially all of our revenue is determined by the amount of our AUM and a substantial part of our AUM is represented by equity securities, in both the international and U.S. markets. As a result, our business can be expected to generate lower revenue in declining equity market environments or general economic downturns. A decline in the prices of securities held by the WisdomTree ETFs may cause our revenue to decline by either causing the value of our AUM to decrease, which would result in lower advisory fees, or causing investors in the WisdomTree ETFs to sell their shares in favor of investments they perceive to offer greater opportunity or lower risk, thus triggering redemptions that would also result in decreased AUM and lower fees.
Fluctuations in the amount and mix of our AUM may negatively impact revenue and operating margin.
The level of our revenue depends on the level and mix of our AUM. Our revenue is derived primarily from advisory fees based on a percentage of the value of our AUM and varies with the nature of the ETFs, which have different fee levels. Fluctuations in the amount and mix of our AUM may be attributable in part to market conditions outside of our control that have had, and in the future could have, a negative impact on our revenue and operating margin.
We are subject to an increased risk of asset volatility from changes in the foreign markets as discussed below. Individual markets may be adversely affected by economic, political, financial, or other instabilities that are particular to the country or regions in which a market is located, including without limitation local acts of
16
terrorism, economic crises or other business, social or political crises. Declines in these markets and currency fluctuations have caused in the past, and may cause in the future, a decline in our revenue. Changing market conditions and currency fluctuations may cause a shift in our asset mix between foreign and U.S. assets, potentially resulting in a decline in our revenue since we generally derive higher fee revenue from our ETFs investing in foreign markets, particularly in emerging markets.
We have had in the past, and in the future may have, investors who maintain significant positions in one or more of our ETFs. If such an investor were to broadly change or withdraw its investments in our ETFs because of a change to its investment strategy, market conditions or any other reason, it may significantly change the level and mix of our AUM, which may negatively affect our revenue and operating margin.
Most of our assets under management are held in ETFs that invest in foreign securities and we therefore have substantial exposure to foreign market conditions and are subject to currency exchange rate risks.
Many of our ETFs invest in securities of companies, governments and other organizations located outside the United States and at December 31, 2012, approximately 75% of our AUM was held by these ETFs. Therefore, the success of our business is closely tied to market conditions in foreign markets. Investments in non-U.S. issuers are affected by political, social and economic uncertainty effecting a country or region in which we are invested. In addition, fluctuations in foreign currency exchange rates could reduce the revenue we earn from these foreign invested ETFs. This occurs because an increase in the value of the U.S. dollar relative to non-U.S. currencies may result in a decrease in the dollar value of the AUM in these ETFs, which, in turn, would result in lower revenue. Furthermore, investors are likely to believe these ETFs, as well as our suite of currency and fixed income ETFs, are a less attractive investment opportunity when the value of the U.S. dollar rises relative to non-U.S. currencies, which could have the effect of reducing investments in these ETFs, thus reducing revenue.
We derive a substantial portion of our revenue from products invested in emerging markets and are exposed to the market-specific political and economic risks as well as general investor sentiment regarding future growth of those markets.
At December 31, 2012, approximately 51% of our ETF AUM was concentrated in eight of our WisdomTree ETFs that primarily invest in equity or fixed income securities issued by companies or governments in emerging markets. In 2012, approximately 57% of our revenue was derived from those eight ETFs. As a result, our operating results are particularly exposed to the performance of those funds, economic and market conditions in those emerging markets, general investor sentiment regarding future growth in those emerging markets and our ability to maintain the assets under management of those funds. In addition, because these funds have a higher expense ratio than our other funds in general, they generate a disproportionate percentage of our total revenue. If the AUM in these funds were to decline, either because of declining market values or because of net outflows from these funds, our revenue would be adversely affected.
We derive a substantial portion of our revenue from a limited number of products and, as a result, our operating results are particularly exposed to the performance of those funds, investor sentiment toward the strategies pursued by those funds and our ability to maintain the assets under management of those funds.
At December 31, 2012, approximately 76% of our ETF AUM was concentrated in ten of our WisdomTree ETFs and approximately 55% of our ETF AUM was concentrated in five of our WisdomTree ETFs. As a result, our operating results are particularly exposed to the performance of those funds, investor sentiment toward investing in the strategies pursued by those funds and our ability to maintain the assets under management of those funds.
17
The WisdomTree ETFs have a limited track record and poor investment performance could cause our revenue to decline.
The WisdomTree ETFs have a limited track record upon which an evaluation of their investment performance can be made. At December 31, 2012, of our total 46 ETFs, only 30 ETFs had a five year track record and 39 had a three year track record. Furthermore, as part of our strategy, we continuously evaluate our product offerings to ensure that all of our funds are useful, compelling and differentiated investment offerings, to more competitively align our overall product line in the current ETF landscape and to reallocate our attention and resources to areas of greater client interest. As a result, we may further adjust our product offering which may result in the closing of some of our ETFs, changing their investment objective or offering of new funds. The investment performance of our funds is important to our success. While strong investment performance could stimulate sales of our ETFs, poor investment performance, on an absolute basis or as compared to third-party benchmarks or competitive products, could lead to a decrease in sales or stimulate redemptions, thereby lowering the assets under management and reducing our revenue. Our fundamentally-weighted equity ETFs are designed to provide the potential for better risk-adjusted investment returns over full market cycles and are best suited for investors with a longer-term investment horizon. However, the investment approach of our equity ETFs may not perform well during certain shorter periods of time during different points in the economic cycle.
We currently depend on BNY Mellon to provide us with critical services to operate our business and the WisdomTree ETFs. The failure of BNY Mellon to adequately provide such services could materially affect our operating business and harm WisdomTree ETF shareholders.
We currently depend upon BNY Mellon to provide the WisdomTree Trust with portfolio management services for all of our ETFs except for three that are managed by other sub-advisors. BNY Mellon also provides us with custody services, fund accounting, administration, transfer agency and securities lending services. The failure of BNY Mellon to provide us and the WisdomTree ETFs with these services could result in financial loss to us and WisdomTree ETF shareholders. In addition, because BNY Mellon provides a multitude of important services to us, and portfolio management for the WisdomTree ETFs covers several different asset classes, changing this vendor relationship would be challenging. It might require us to devote a significant portion of management’s time to negotiate a similar relationship with another vendor or have these services provided by multiple vendors, which would require us to coordinate the transfer of these functions to another vendor or vendors.
We depend on other third parties to provide many critical services to operate our business and the WisdomTree ETFs. The failure of key vendors to adequately provide such services could materially affect our operating business and harm WisdomTree ETF shareholders.
In addition to BNY Mellon, we depend on other third-party vendors to provide us with many services that are critical to operating our business, including two additional subadvisers that provide us with portfolio management services, a third-party provider of index calculation services for our indexes, a distributor of the WisdomTree ETFs and a third-party provider of indicative values of the portfolios of the WisdomTree ETFs. The failure of these key vendors to provide us and the WisdomTree ETFs with these services could lead to operational issues and result in financial loss to us and WisdomTree ETF shareholders.
The asset management business is intensely competitive. Many of our competitors have greater market share, offer a broader range of products and have greater financial resources than we do. As a result, we may experience pressures on our pricing and market share.
Our business operates in intensely competitive industry segments. We compete directly with other ETF sponsors and mutual fund companies and indirectly against other investment management firms, insurance companies, banks, brokerage firms and other financial institutions that offer products that have similar features and investment objectives to those offered by us. We compete based on a number of factors, including name
18
recognition, service, investment performance, product features and breadth of product choices, and fees. Many of our competitors have greater market share, offer a broader range of products and have greater financial resources than we do. Some financial institutions operate in a more favorable regulatory environment and/or have proprietary products and distribution channels which may provide certain competitive advantages to them and their investment products. Our competitors may also adopt products, services or strategies similar to ours, including the use of fundamentally-weighted indexes. In addition, over time certain sectors of the financial services industry have become considerably more concentrated, as financial institutions involved in a broad range of financial services have been acquired by or merged into other firms. This convergence could result in our competitors gaining greater resources and we may experience pressures on our pricing and market share as a result of these factors and as some of our competitors seek to increase market share by reducing prices. We believe that competition within the ETF industry will continue to increase as more traditional asset management companies become ETF sponsors.
Competitive pressures could reduce revenue and profit margins.
The investment management business is highly competitive and has relatively low barriers to entry. Although the ETF industry currently has a higher barrier to entry as a result of the need for ETF sponsors to obtain exemptive relief from the SEC in order to operate ETFs, we expect that additional companies, both new companies and traditional asset managers, many of whom are much larger than us, will enter the ETF space. In addition, in 2008, the SEC proposed a rule that, if adopted, would eliminate the need to obtain this exemptive relief. In March 2010, the SEC announced it would defer approval of applications for exemptive relief for ETFs that make significant use of derivatives pending a review by the SEC of the use of derivatives by mutual funds, ETFs and other investment companies. This moratorium was lifted in December, 2012 and may have served in the past to prevent potential competitors from directly competing with certain of our products. Now that the moratorium has been lifted we may face increased competition and we may be forced to compete increasingly on the basis of price, we may not be able to maintain our current fee structure. Fee reductions on existing or future new products could cause our revenue and profit margins to decline.
Our revenue could be adversely affected if the WisdomTree Trust determines that the advisory fees we receive from the WisdomTree ETFs should be reduced.
Our advisory agreements with the WisdomTree Trust and the fees we collect from the WisdomTree ETFs are subject to review and approval by the independent trustees of the WisdomTree Trust. The advisory agreements are subject to initial review and approval. After the initial two-year term of the agreement for each ETF, the continuation of such agreement must be reviewed and approved at least annually by a majority of the independent trustees. In determining whether to approve the agreements, the independent trustees consider factors such as (i) the nature and quality of the services provided by us, (ii) the fees charged by us and the costs and profits realized by us in connection with such services, as well as any ancillary or “fall-out” benefits from such services, (iii) the extent to which economies of scale are shared with the WisdomTree ETFs, and (iv) the level of fees paid by other similar funds. If the independent trustees determine that the advisory fees we charge to any particular fund are too high, we will need to reduce our fees, which could adversely affect our revenue.
We have contracted with a third-party financial intermediary that markets our investment portfolios in Latin America and this relationship may not be available or profitable to us in the future.
This third-party intermediary generally offers its clients various investment products in addition to, and in competition with, our investment offerings. It would be difficult for us to acquire or retain the management of those assets without the assistance of the intermediary and we cannot be assured that we will be able to maintain this marketing relationship.
19
Our risk management policies and procedures, and those of our third-party vendors upon which we rely, may not be fully effective in identifying or mitigating risk exposure, including employee misconduct. If our policies and procedures do not adequately protect us from exposure to these risks, we may incur losses that would adversely affect our financial condition, reputation and market share.
We have developed risk management policies and procedures and we continue to refine them as we conduct our business. Many of our procedures involve oversight of third-party vendors that provide us with critical services such as portfolio management, custody and fund accounting and administration, and index calculation services. Our policies and procedures to identify, monitor and manage risks may not be fully effective in mitigating our risk exposure. Moreover, we are subject to the risks of errors and misconduct by our employees, including fraud and non-compliance with policies. These risks are difficult to detect in advance and deter, and could harm our business, results of operations or financial condition. Although we maintain insurance and use other traditional risk-shifting tools, such as third-party indemnification, in order to manage certain exposures, they are subject to terms such as deductibles, coinsurance, limits and policy exclusions, as well as risk of counterparty denial of coverage, default or insolvency. If our policies and procedures do not adequately protect us from exposure and our exposure is not adequately covered by insurance or other risk-shifting tools, we may incur losses that would adversely affect our financial condition and could cause a reduction in our revenue as WisdomTree ETF shareholders shift their investments to the products of our competitors.
Compliance with extensive, complex and changing regulation imposes significant financial and strategic costs on our business, and non-compliance could result in fines and penalties.
Our business is subject to extensive regulation of our business and operations. Our subsidiary, WisdomTree Asset Management, Inc., or WTAM, is a registered investment adviser and is subject to oversight by the SEC pursuant to its regulatory authority under the Investment Advisers Act. We also must comply with certain requirements under the Investment Company Act, with respect to the WisdomTree ETFs for which WTAM acts as investment adviser. WTAM is also a member of the National Futures Association, or NFA, and registered as a Commodity Pool Operator for certain of our ETFs. As a Commodity Pool Operator we are subject to oversight by the NFA and the Commodities Futures Trading Commission pursuant to regulatory authority under the Commodities Exchange Act. In addition, the content and use of our marketing and sales materials and of our sales force is subject to the regulatory authority of FINRA. To a lesser extent, we are also subject to foreign laws and regulatory authorities with respect to operational aspects of our funds that invest in securities of issuers in foreign countries and in the sales of our funds in foreign jurisdictions. Each of the regulatory bodies with jurisdiction over us has regulatory powers dealing with many aspects of our business, including the authority to grant, and, in specific circumstances to cancel, permissions to carry on particular businesses. Our failure to comply with applicable laws or regulations could result in fines, censure, suspensions of personnel or other sanctions, including revocation of our registration as an investment adviser. Even if a sanction imposed against us or our personnel is small in monetary amount, the adverse publicity arising from the imposition of sanctions against us by regulators could harm our reputation and thus result in redemptions from our ETFs and impede our ability to retain WisdomTree ETF shareholders and develop new WisdomTree ETF shareholders, all of which may reduce our revenue.
We face the risk of significant intervention by regulatory authorities, including extended investigation activity, adoption of costly or restrictive new regulations and judicial or administrative proceedings that may result in substantial penalties. Among other things, we could be fined or be prohibited from engaging in some of our business activities. The requirements imposed by our regulators are designed to ensure the integrity of the financial markets and to protect WisdomTree ETF shareholders and our advisory clients, and are not designed to protect our stockholders. Consequently, these regulations often serve to limit our activities, including through WisdomTree ETF shareholder protection and market conduct requirements.
In addition, the regulatory environment in which we operate is subject to modifications and further regulation. Recently, concerns have been raised about ETF’s alleged contribution to market volatility as well as
20
the disclosure requirements applicable to certain types of more complex ETFs. New laws or regulations, or changes in the enforcement of existing laws or regulations, applicable to us and our clients also may adversely affect our business, and our ability to function in this environment will depend on our ability to constantly monitor and react to these changes. Regulatory uncertainty continues to surround the Dodd-Frank Wall Street Reform and Consumer Protection Act of 2010, which represented a comprehensive overhaul of the financial services regulatory environment and requires federal agencies to implement numerous new rules, which, if adopted, may impose additional regulatory burdens and expenses on our business. Compliance with new laws and regulations may result in increased compliance costs and expenses.
Specific regulatory changes also may have a direct impact on our revenue. In addition to regulatory scrutiny and potential fines and sanctions, regulators continue to examine different aspects of the asset management industry. New regulation or judicial interpretations regarding the annual approval process for investment advisory agreements may result in the reduction of fees under these agreements, which would mean a reduction in our revenue.
Damage to our reputation could adversely affect our business.
We believe we have developed a strong brand and a reputation for innovative, thoughtful products, favorable long-term investment performance and excellent client services. The WisdomTree name and brand is a valuable asset and any damage to it could hamper our ability to maintain and grow our AUM and attract and retain employees, thereby having a material adverse effect on our revenue. Risks to our reputation may range from regulatory issues to unsubstantiated accusations. Managing such matters may be expensive, time-consuming and difficult. As described in the section entitled “Management—Involvement in Certain Legal Proceedings,” Michael Steinhardt, who currently serves as the chairman of our Board of Directors and beneficially owns approximately 15.4% of our common stock, was sanctioned in civil litigation by the Court of Chancery of the State of Delaware and is required to, among other things, self-report certain trading activity not involving the Company’s securities to the SEC. Mr. Steinhardt’s actions did not involve the Company and, based on the facts currently known, which we are continuing to review, we do not believe Mr. Steinhardt’s actions will have a material impact on our business, although there can be no assurance that this will be the case or that these matters, and any investigations or actions that result from these matters, will not have an adverse effect on our reputation or the price of our common stock. For more details, see the section entitled “Management—Involvement in Certain Legal Proceedings.”
Abnormally wide bid/ask spreads and market disruptions that halt or disrupt trading or create extreme volatility could undermine investor confidence in the ETF investment structure and limit investor acceptance of ETFs.
The shares of the WisdomTree ETFs, like the shares of all ETFs, trade on exchanges in market transactions that generally approximate the value of the underlying portfolio of securities held by the particular ETF. Trading involves risks including the potential lack of an active market for fund shares, abnormally wide bid/ask spreads (the difference between the prices at which shares of an ETF can be bought and sold) that can exist for a variety of reasons and losses from trading. These risks can be exacerbated during periods when there is low demand for an ETF, when the markets in the underlying basket of securities are closed, when markets conditions are extremely volatile or when trading is disrupted. This could result in limited growth or a reduction in the overall ETF market and result in our revenue not growing as rapidly as it has in the recent past or even in a reduction of revenue.
We have experienced significant growth in recent years, and if we were unable to manage this growth it could have a material adverse effect on our business.
We have experienced significant growth in recent years, which has placed increased demands on our management and other resources and will continue to do so in the future. We may not be able to maintain or
21
accelerate our current growth rate, manage our expanding operations effectively or achieve planned growth on a timely or profitable basis. Managing our growth effectively will involve, among other things:
| • | continuing to retain, motivate and manage our existing employees and attract and integrate new employees; |
| • | developing, implementing and improving our operational, financial, accounting, reporting and other internal systems and controls on a timely basis; and |
| • | maintaining and developing our various support functions including human resources, information technology, legal and corporate communications. |
If we are unable to manage our growth effectively, there could be a material adverse effect on our ability to maintain or increase revenue and profitability.
Continued growth will require continued investment in personnel, information technology infrastructure and marketing activities, as well as further development and implementation of financial, operational and compliance systems and controls. We may not be successful in implementing all of the processes that are necessary to support our growth. Unless our growth results in an increase in our revenue that is at least proportionate to the increase in our costs associated with this growth, our gross margins and our future profitability will be adversely affected.
Our growth strategy also involves, among other things, diversifying our product line to include more ETFs in non-equity asset classes, including fixed income and alternative investment strategies. This will require us to develop products in areas in which we do not have significant prior experience. We may not be successful in developing new products and if developed and launched, we may not be successful in marketing these new products.
Our ability to operate effectively could be impaired if we fail to retain or recruit key personnel.
The success of our business and the implementation of our growth strategy are highly dependent on our ability to attract, retain and motivate highly skilled, and sometimes highly specialized, employees, including in particular, operations, product development, research and sales personnel. Our employees may voluntarily terminate their employment at any time. The market for these individuals is extremely competitive and is likely to become more so as additional investment management firms enter the ETF industry. Our compensation methods may not enable us to recruit and retain required personnel. In particular, our use of equity grants as a component of total employee compensation may be ineffective if the market price of our common stock declines. Also, we may need to increase compensation levels, which would decrease our net income or increase our losses. If we are unable to retain and attract key personnel, it could have an adverse effect on our business, results of operations and financial condition.
Changes in U.S. federal income tax law could make some of our products less attractive to investors.
Many of the WisdomTree ETFs seek to obtain the investment return achieved by our proprietary indexes that weigh index components based upon dividends. Even with the recent increase in tax rates applicable to dividends, corporate dividends continue to enjoy favorable tax treatment under current U.S. federal income tax law. If the tax rates imposed on dividends were increased, it may make these WisdomTree ETFs less attractive to investors.
Our expenses are subject to fluctuations that could materially affect our operating results.
Our results of operations are dependent in part on the level of our expenses, which can vary from quarter to quarter. Our expenses may fluctuate primarily as a result of discretionary spending, including marketing, advertising and sales expenses we incur to support our growth initiatives. Accordingly, our results of operation may vary from quarter to quarter.
22
Any significant limitation or failure of our technology systems, or the technology systems of our third party vendors, that are critical to our operations could interrupt or damage our operations and result in material financial loss, regulatory violations, reputational harm or legal liability.
We are dependent upon the effectiveness of our own, and our vendors’, information security policies, procedures and capabilities to protect the technology systems used to operate our business and to protect the data that reside on or are transmitted through them. Although we and our third party vendors take protective measures to secure information, our technology systems may still be vulnerable to unauthorized access, computer viruses or other events that could result in inaccuracies in our information or system disruptions or failures, which could materially interrupt or damage our operations. Any inaccuracies, delays or system failures could subject us to client dissatisfaction and losses or result in material financial loss, regulatory violations, reputational harm or legal liability, which, in turn, could cause a decline in our earnings or stock price.
We may from time to time in the future be involved in legal proceedings that could require significant management time and attention, possibly resulting in significant expense or in an unfavorable outcome, which could have a material adverse effect on our business, financial condition, results of operations and cash flows.
From time to time, we may be subject to litigation. In connection with any litigation in which we are involved, we may be forced to incur costs and expenses in connection with defending ourselves or in connection with the payment of any settlement or judgment or compliance with any injunctions in connection therewith if there is an unfavorable outcome. The expense of defending litigation may be significant. The amount of time to resolve lawsuits is unpredictable and defending ourselves may divert management’s attention from the day-to-day operations of our business, which could adversely affect our business, results of operations, financial condition and cash flows. In addition, an unfavorable outcome in any such litigation could have a material adverse effect on our business, results of operations, financial condition and cash flows.
The Chairman of our Board may be subject to future sanctions that could adversely affect us.
Michael Steinhardt, who currently serves as the chairman of our Board of Directors, was sanctioned in civil litigation by the Court of Chancery of the State of Delaware and was required to, among other things, self-report certain trading activity not involving the Company’s securities to the SEC. If the SEC or NASDAQ were to conclude that Mr. Steinhardt’s actions violated federal securities law or other rules, the SEC or NASDAQ could seek remedies including, among other things, barring Mr. Steinhardt from serving on our Board of Directors. NASDAQ could also seek to delist shares of our common stock from the NASDAQ Global Market. Mr. Steinhardt’s actions did not involve the Company and, based on the facts currently known, which we are continuing to monitor, we do not believe Mr. Steinhardt’s actions will have a material impact on our business. However, there can be no assurance that this will be the case or that this will not have an adverse effect on our reputation or the price of our common stock.
Catastrophic and unpredictable events could have a material adverse effect on our business.
A terrorist attack, war, power failure, cyber-attack, natural disaster or other catastrophic or unpredictable event could adversely affect our revenue, expenses and operating results by: interrupting our normal business operations; inflicting employee casualties, including loss of our key employees; requiring substantial expenditures and expenses to repair, replace and restore normal business operations; and reducing investor confidence. We have a disaster recovery plan to address certain contingencies, but this plan may not be sufficient in responding or ameliorating the effects of all disaster scenarios. Similarly, these types of events could also affect the ability of the third-party vendors that we rely upon to conduct our business–e.g., BNY Mellon which provides us with sub-advisory portfolio management services for most of our funds as well as custodial, fund accounting and administration services, or Standard & Poor’s, which provide us with index calculation services–to continue to provide these necessary services to us, even though they may also have disaster recovery plans to
23
address these contingencies. If we or our third-party vendors are unable to respond adequately or in a timely manner, this failure may result in a loss of revenue and/or increased expenses, either of which would have a material adverse effect on our operating results.
A change of control of our Company would automatically terminate our investment management agreements relating to the WisdomTree ETFs unless the Board of Trustees of the WisdomTree Trust and shareholders of the WisdomTree ETFs voted to continue the agreements. A change in control could occur if a third party were to acquire controlling interest in our Company.
Under the Investment Company Act, an investment management agreement with a fund must provide for its automatic termination in the event of its assignment. The fund’s board must vote to continue such an agreement following any such assignment and the shareholders of the WisdomTree ETFs must approve the assignment. The cost of obtaining such shareholder approval can be significant and which ordinarily would be borne by us. Similarly, under the Investment Advisers Act, a client’s investment management agreement may not be “assigned” by the investment advisor without the client’s consent.
An investment management agreement is considered under both acts to be assigned to another party when a controlling block of the advisor’s securities is transferred. Under both acts, there is a presumption that a stockholder beneficially owning 25% or more of an advisor’s voting stock controls the advisor and conversely a stockholder beneficially owning less than 25% is presumed not to control the advisor. In our case, an assignment of our investment management agreements may occur if a third party were to acquire a controlling interest in our Company. We cannot be certain that the Trustees of the WisdomTree ETFs would consent to assignments of our investment management agreements or approve new agreements with us if a change of control occurs. And even if such approval were obtained, approval from the shareholders of the WisdomTree ETFs would be required to be obtained; such approval could not be guaranteed and even if obtained, likely would result in significant expense. This restriction may discourage potential purchasers from acquiring a controlling interest in our Company.
We may from time to time be subject to claims of infringement of third-party intellectual property rights, which could harm our business.
Third parties may assert against us alleged patent, copyright, trademark or other intellectual property rights to intellectual property that is important to our business. Any claims that our products or processes infringe the intellectual property rights of others, regardless of the merit or resolution of such claims, could cause us to incur significant costs in responding to, defending and resolving such claims, and may divert the efforts and attention of our management from our business. As a result of such intellectual property infringement claims, we could be required or otherwise decide that it is appropriate to:
| • | pay third-party infringement claims; |
| • | discontinue selling the particular funds subject to infringement claims; |
| • | discontinue using the processes subject to infringement claims; |
| • | develop other intellectual property or products not subject to infringement claims, which could be time-consuming and costly or may not be possible; or |
| • | license the intellectual property from the third party claiming infringement, which license may not be available on commercially reasonable terms. |
The occurrence of any of the foregoing could result in unexpected expenses, reduce our revenue and adversely affect our business and financial results. In addition, we are currently covered by a relatively small number of equity research analysts, whose views on the merits or impact of any claim of infringement of third-party intellectual property rights may differ from ours and result in the issuance of unfavorable commentaries by such analysts, which could have an adverse effect on the price and trading volume of our common stock.
24
For example, on December 1, 2011, Research Affiliates, LLC filed suit against us in the United States District Court for the Central District of California, alleging that the fundamentally weighted investment methodology we employ infringes three of plaintiff’s patents, and seeking both unspecified monetary damages to be determined and an injunction to prevent further infringement. For more details, see “Business—Legal Proceedings.” Although this matter was settled in a manner satisfactory to us, we could face similar suits in the future.
We have been issued a patent and have applied for other patents, but additional patents may not be issued and we may not be able to enforce or protect our patents and other intellectual property rights, which may harm our ability to compete and harm our business.
Although we have a patent and have applied for other patents relating to our index methodology and the operation of our equity ETFs, these other patents may not be issued to us. In addition, even if issued, our ability to enforce our patents and other intellectual property rights is subject to general litigation risks. While we have been competing without the benefit of these patents being issued, if they are not issued or we cannot successfully enforce them, we may lose the benefit of a future competitive advantage that they would otherwise provide to us. If we seek to enforce our rights, we could be subject to claims that the intellectual property right is invalid or is otherwise not enforceable. Furthermore, our assertion of intellectual property rights could result in the other party seeking to assert alleged intellectual property rights of its own or assert other claims against us, which could harm our business. If we are not ultimately successful in defending ourselves against these claims in litigation, we may be subject to the risks described in the immediately preceding risk factor entitled “We may from time to time be subject to claims of infringement of third-party intellectual property rights, which could harm our business.”
Future strategic transactions, including business combinations, mergers and acquisitions, may occur at any time, be significant in size relative to our assets and operations, result in significant changes in our business and materially and adversely affect our stock price. Additionally, we may expend significant financial, management time and other resources without the consummation of such transactions or the realization of the anticipated benefits.
We believe attractive opportunities for strategic transactions exist, some of which may be material to our operations and financial condition if consummated. We have engaged in the past and expect to continue to engage in the future in strategic discussions that we believe may enable us to strengthen our business, expand and diversify our product offering, increase our AUM or enter into new markets. Such transactions may result in our issuing a significant amount of our common stock or other security that could be dilutive to our stockholders, result in substantial borrowings, result in changes in our board composition and/or management team, constitute a change of control of our Company, lead to significant changes in our product offering, business operations and earning and risk profiles, and/or result in a decline in the price of our common stock.
Even if consummated, such transactions may involve numerous risks, including, among others:
| • | failure to achieve financial, operating or business objectives; |
| • | failure to integrate successfully and in a timely manner any operations, products, services or technology; |
| • | diversion of the attention of management and other personnel; |
| • | failure to obtain necessary regulatory, shareholder or other approvals; |
| • | failure to retain personnel; |
| • | failure to obtain any necessary financing on acceptable terms or at all; |
| • | unforeseen liabilities or expenses; |
| • | failure of counterparties to indemnify us against liabilities arising from such transactions; |
25
| • | potential loss of, or harm to, our relationship with our and the counterparties’ employees, customers and suppliers as a result of integration of new businesses; |
| • | accounting charges; |
| • | unfavorable market conditions that could negatively impact the acquired or combined businesses; and |
| • | legal proceedings, including lawsuits brought by stockholders of us or the counterparties which may result in expenses and/or have a material adverse effect on our business. |
We could be prevented from, or significantly delayed in, achieving our strategic goals if we are unable to successfully integrate acquired businesses. Our ability to complete future strategic transactions depends upon a number of factors that are not entirely within our control, including our ability to identify suitable merger or acquisition candidates, negotiate acceptable terms, conclude satisfactory agreements and secure financing. Our failure to complete strategic transactions or to integrate and manage acquired or combined businesses successfully could materially and adversely affect our business, results of operations and financial conditions.
Risks Relating to our Common Stock
The market price of our shares may fluctuate significantly, and you could lose all or part of your investment.
The market price of our common stock may fluctuate widely, depending upon many factors, some of which may be beyond our control, including:
| • | decreases in our assets under management; |
| • | variations in our quarterly operating results; |
| • | differences between our actual financial operating results and those expected by investors and analysts; |
| • | publication of research reports about us or the investment management industry; |
| • | changes in expectations concerning our future financial performance and the future performance of the ETF industry and the asset management industry in general, including financial estimates and recommendations by securities analysts; |
| • | our strategic moves and those of our competitors, such as acquisitions or consolidations; |
| • | changes in the regulatory framework of the ETF industry and the asset management industry in general and regulatory action, including action by the SEC to lessen the regulatory requirements or shortening the process to obtain regulatory relief under the Investment Company Act that is necessary to become an ETF sponsor; |
| • | changes in general economic or market conditions; and |
| • | realization of any other of the risks described elsewhere in this section. |
In addition, stock markets in general have experienced volatility that has often been unrelated to the operating performance of a particular company. These broad market fluctuations may adversely affect the trading price of our common stock. Furthermore, in the past, market fluctuations and price declines in a company’s stock have led to securities class action litigations or other derivative shareholder lawsuits. If such a suit were to arise, it could cause substantial costs to us and divert our resources regardless of the outcome.
Future sales of our common stock in the public market by management or our large stockholders could lower our stock price.
As of February 15, 2013, our largest stockholder (who serves on our Board of Directors), together with the other members of our Board of Directors and our executive officers, beneficially owned approximately 25.7% of
26
our outstanding common stock. If our existing stockholders sell, or indicate an intent to sell, substantial amounts of our common stock in the public market, the trading price of our common stock may decline significantly. We cannot predict the effect, if any, that future public sales of these shares or the availability of these shares for sale will have on the market price of our common stock.
If equity research analysts issue unfavorable commentary or downgrade our common stock, the price of our common stock could decline.
The trading market for our common stock relies in part on the research and reports that equity research analysts publish about us and our business. We do not control the opinions of these analysts. The price and trading volume of our common stock could decline if one or more equity analysts downgrade our common stock or if analysts issue other unfavorable commentary or cease publishing reports about us or our business.
Future issuance of our common stock could lower our stock price and dilute the interests of existing stockholders.
We may issue additional shares of our common stock in the future, either in connection with an acquisition or for other business reasons. The issuance of a substantial amount of common stock could have the effect of substantially diluting the interests of our current stockholders. In addition, the sale of a substantial amount of common stock in the public market, either in the initial issuance or in a subsequent resale by the target company in an acquisition which received such common stock as consideration or by investors who acquired such common stock in a private placement could have a material adverse effect on the market price of our common stock.
The members of our Board of Directors, their affiliates and our executive officers, as stockholders, can exert significant influence over our Company.
As of February 15, 2013, the members of our Board of Directors and our executive officers, as stockholders, collectively beneficially owned 25.7% of our outstanding common stock. As a result of this ownership, they have the ability to significantly influence all matters requiring approval by stockholders of our Company, including the election of directors. This concentration of ownership also may have the effect of delaying or preventing a change in control of our Company that may be favored by other stockholders. This could prevent transactions in which stockholders might otherwise receive a premium for their shares over current market prices.
Although our directors and officers have a duty of loyalty to us under Delaware law and our amended and restated certificate of incorporation, transactions that we enter into in which a director or officer has a conflict of interest are generally permissible so long as (1) the material facts relating to the director’s or officer’s relationship or interest as to the transaction are disclosed to our Board of Directors and a majority of our disinterested directors, or a committee consisting solely of disinterested directors, approves the transaction, (2) the material facts relating to the director’s or officer’s relationship or interest as to the transaction are disclosed to our stockholders and a majority of our disinterested stockholders approves the transaction, or (3) the transaction is otherwise fair to us. Under our certificate of incorporation, representatives of our stockholders are not required to offer to us any transaction opportunity of which they become aware and could take any such opportunity for themselves or offer it to other companies in which they have an investment, unless such opportunity is expressly offered to them solely in their capacity as a director of ours. The listing requirements of the NASDAQ Global Market, upon which our common stock is listed, also require that certain transactions in which a director or officer has a conflict of interest must be considered and approved by our Audit Committee, which consists solely of independent directors.
27
A provision in our certificate of incorporation and by-laws may prevent or delay an acquisition of our Company, which could decrease the market value of our common stock.
Provisions of Delaware law, our amended and restated certificate of incorporation and our amended and restated by-laws may discourage, delay or prevent a merger, acquisition or other change in control that stockholders may consider favorable. These provisions may also prevent or delay attempts by stockholders to replace or remove our current management or members of our Board of Directors. These provisions include:
| • | a classified Board of Directors; |
| • | limitations on the removal of directors; |
| • | advance notice requirements for stockholder proposals and nominations; |
| • | the inability of stockholders to act by written consent or to call special meetings; |
| • | the ability of our Board of Directors to make, alter or repeal our amended and restated by-laws; and |
| • | the authority of our Board of Directors to issue preferred stock with such terms as our Board of Directors may determine. |
In addition, we are subject to the provisions of Section 203 of the Delaware General Corporation Law, which limits business combination transactions with stockholders of 15% or more of our outstanding voting stock that our Board of Directors has not approved. These provisions and other similar provisions make it more difficult for stockholders or potential acquirers to acquire us without negotiation. These provisions may apply even if some stockholders may consider the transaction beneficial to them.
As a result, these provisions could limit the price that investors are willing to pay in the future for shares of our common stock. These provisions might also discourage a potential acquisition proposal or tender offer, even if the acquisition proposal or tender offer is at a premium over the then current market price for our common stock.
We do not intend to pay dividends in the near term.
We have never paid dividends on our common stock and we currently intend to invest our available cash flow in the near term in strategic growth initiatives, re-acquire shares of our common stock issued to our employees as incentive compensation or expand our business through strategic acquisitions. Thus, the shares of common stock may not realize a return in the form of dividends in the near term. Investors who anticipate the need for immediate dividends from shares of common stock should refrain from purchasing our common stock. In addition, our Board of Directors is authorized, without stockholder approval, to issue preferred stock with such terms as our Board of Directors may, in its discretion, determine. Our Board of Directors could, therefore, issue preferred stock with dividend rights superior to that of the common stock, which could also limit the payment of dividends on the common stock.
| ITEM 1B. | UNRESOLVED STAFF COMMENTS |
None.
| ITEM 2. | PROPERTIES |
Our principal executive office is located at 380 Madison Ave, New York, New York 10017. We occupy approximately 20,000 square feet of office space under a lease that expires in January 2014. We believe that the space we lease is sufficient to meet our term needs until the expiration of the lease and we have begun to search for new office space and as such expect these costs to increase in the future.
28
| ITEM 3. | LEGAL PROCEEDINGS |
As an investment advisor, we may be subject to routine reviews and inspections by the SEC, as well as legal proceedings arising in the ordinary course of business. We are not currently party to any litigation or other legal proceedings that are expected to have a material impact on our business, financial position, results of operations or cash flows.
On December 1, 2011, Research Affiliates, LLC filed a complaint in the United States District Court for the Central District of California, (Research Affiliates, LLC v. WisdomTree Investments, Inc., et. al., Case No. SACV11-01846 DOC (ANx)), naming us and our subsidiaries, as well as WisdomTree Trust, Mellon Capital Management Corporation and ALPS Distributors, Inc., as defendants. In the complaint, plaintiff alleged that the fundamentally weighted investment methodology we employ for the ETFs using our indexes infringed three of plaintiff’s patents and sought both unspecified monetary damages to be determined and an injunction to prevent further infringement.
On November 7, 2012, Research Affiliates, LLC agreed to withdraw its patent infringement suit against us and we agreed to withdraw our counterclaims and entered into a settlement agreement. Under the settlement, all parties exchanged releases for all existing claims. The other material terms of the settlement are as follows:
| • | Research Affiliates agreed not to sue us for any future claims arising under any current patents held by Research Affiliates, as well as any future patents relating to fundamentally-weighted indexes and strategies that may issue under existing or future patent applications that may be filed by Research Affiliates within the next eight years, subject to reduction by up to three years if Research Affiliates is acquired. The covenant not to sue extends to our service providers and customers in connection with our products and services. |
| • | We agreed not to sue Research Affiliates for any future claims arising under any current patents held by us, as well as any future patents relating to fundamentally-weighted indexes and strategies that may issue under existing or future patent applications that may be filed by us within the next eight years, subject to reduction by up to three years if we are acquired. The covenant not to sue extends to service providers and customers of Research Affiliates in connection with Research Affiliates’ products and services. |
| • | Research Affiliates and we agreed that the covenants not to sue do not include a right under each party’s patents to copy the other party’s methodologies. Research Affiliates and we further agreed that it is not copying if Research Affiliates introduces an index or strategy that uses at least three fundamental factors to weight its indexes and they are not predominantly dividend- or earnings-weighted, or we introduce an index or strategy that is weighted by less than three fundamental factors. |
| • | The parties also agreed not to challenge the other party’s patents or patent applications. |
| • | Research Affiliates agreed to a one-time payment of $0.7 million to us. We and the other defendants were not required to make any current or future payments to Research Affiliates. |
All other terms of the settlement are confidential and the settlement will not affect the current methodologies and fees for WisdomTree ETFs.
Our insurance carrier funded a significant majority of the cost of defending this patent infringement lawsuit. The net amount of expense, taking into account legal defense and other associated costs we paid to defend ourselves less any amounts our insurance carrier agreed to reimburse us and the receipt of a settlement payment from Research Affiliates, we incurred was $0.2 million in both 2011 and 2012.
| ITEM 4. | MINE SAFETY DISCLOSURES |
Not applicable.
29
| ITEM 5. | MARKET FOR REGISTRANT’S COMMON EQUITY, RELATED STOCKHOLDER MATTERS AND ISSUER PURCHASES OF EQUITY SECURITIES |
Market Information
Our common stock is traded on the NASDAQ Global Market under the symbol “WETF.” Prior to July 26, 2011, our common stock was quoted on the over-the-counter Pink OTC Markets under the symbol “WSDT.” The following table sets forth the intra-day high and low sale prices per share as reported by the NASDAQ Global Market and the Pink OTC Markets, for the respective periods that our common stock was traded thereon.
| Period |
High | Low | ||||||
| Fiscal 2012 |
||||||||
| Quarter ended December 31, 2012 |
$ | 7.34 | $ | 5.71 | ||||
| Quarter ended September 30, 2012 |
$ | 7.26 | $ | 6.17 | ||||
| Quarter ended June 30, 2012 |
$ | 8.74 | $ | 6.26 | ||||
| Quarter ended March 31, 2012 |
$ | 8.95 | $ | 5.37 | ||||
| Fiscal 2011 |
||||||||
| Quarter ended December 31, 2011 |
$ | 8.22 | $ | 5.68 | ||||
| Quarter ended September 30, 2011 |
$ | 9.60 | $ | 6.35 | ||||
| Quarter ended June 30, 2011 |
$ | 7.25 | $ | 5.68 | ||||
| Quarter ended March 31, 2011 |
$ | 5.87 | $ | 4.08 | ||||
As of December 31, 2012, there were approximately 136 holders of record of shares of our common stock and we believe there were approximately 11,151 beneficial owners of our common stock.
Dividends
We have never declared or paid dividends on our common stock. We do not anticipate paying any dividends on our common stock in the foreseeable future. We currently intend to retain all available funds and any future earnings to fund the development and growth of our business. Any future determination to declare dividends will be subject to the discretion of our Board of Directors and will depend on various factors, including applicable laws, our results of operations, financial condition, future prospects and any other factors deemed relevant by our Board of Directors.
Securities Authorized for Issuance under Equity Compensation Plans
The table below sets forth information with respect to shares of Common Stock that may be issued under the Company’s equity compensation plans as of December 31, 2012. Information is included for equity compensation plans approved by our stockholders and equity compensation plans not approved by our stockholders
| Plan category |
Number of securities to be issued upon exercise of outstanding options, warrants and rights (a) |
Weighted-average exercise price of outstanding options, warrants and rights (b) |
Number of securities remaining available for future issuance under equity compensation plans (excluding securities reflected in column (a)) (c) |
|||||||||
| Equity compensation plans approved by security holders(1) |
5,145,191 | $ | 1.89 | 4,305,761 | ||||||||
| Equity compensation plans not approved by security holders(2) |
7,615,000 | $ | 0.31 | 631,865 | ||||||||
| Total |
12,760,191 | $ | 0.95 | 4,937,626 | ||||||||
| (1) | Includes securities issuable upon exercise of outstanding options, warrants and rights that were issued pursuant to the Company’s 1993 Stock Option Plan, 1996 Performance Equity Plan, 2000 Performance Equity Plan and 2005 Performance Equity Plan. |
30
| (2) | Our non-plan options are similar to options granted under our equity compensation plans and generally were granted outside of these plans when insufficient shares were available for grant under our plans. These options provide the holder with the right to purchase a certain number of shares of our common stock at a predetermined fixed price for a period of not more than ten years. All of the non-plan options were granted to directors, employees or advisors to our Board of Directors and the exercise price was determined to be not less than the fair market value of our common stock on the date of grant. |
Issuer Purchases of Equity Securities
The following table provides information with respect to purchases made by or on behalf of the Company or any “affiliated purchaser” of shares of the Company’s common stock.
| (in thousands, except share and per share amounts) | ||||||||||||||||
| Total Number of Shares Purchased(1) |
Average Price Paid Per Share |
Total Number of Shares Purchased as Part of Publicly Announced Plans or Programs |
Approximate Dollar Value of Shares that May Yet be Purchased Under the Plans or Programs |
|||||||||||||
| October 1, 2012 to October 31, 2012 |
— | — | — | — | ||||||||||||
| November 1, 2012 to November 30, 2012 |
— | — | — | — | ||||||||||||
| December 1, 2012 to December 31, 2012 |
174,951 | $ | 6.24 | — | — | |||||||||||
| (1) | Total number of shares purchased reflects shares withheld pursuant to the terms of awards granted to employees towards the employee’s tax withholding obligations that occur upon vesting and release of the restricted shares. The value of the shares withheld is based upon the volume weighted average price of the common stock on the date of vesting. During the three months ended December 31, 2012, the Company repurchased 174,951 shares of Company stock withheld pursuant to the terms of awards granted to employees towards tax withholding obligations for an aggregate price of $1,091,694 with an average price per share of $6.24. |
31
| ITEM 6. | SELECTED FINANCIAL DATA |
You should read the selected consolidated financial data presented below in conjunction with the section entitled “Management’s Discussion and Analysis of Financial Condition and Results of Operations” in this Report and our consolidated financial statements and the related notes included elsewhere in this Report. The selected consolidated statements of operations data presented below under the heading “Consolidated Statements of Operations Data” for the years ended December 31, 2010, 2011 and 2012 and the selected consolidated balance sheet data presented below under the heading “Consolidated Balance Sheet Data” as of December 31, 2011 and 2012 have been derived from our audited consolidated financial statements included elsewhere in this Report. The selected consolidated financial data presented below under the headings “Consolidated Statements of Operations Data” for the years ended December 31, 2008 and 2009 and under “Consolidated Balance Sheet Data” as of December 31, 2008, 2009 and 2010 have been derived from our consolidated financial statements not included in this Report. The historical results presented below are not necessarily indicative of the financial results to be expected for future periods.
| Year Ended December 31, | ||||||||||||||||||||
| 2008 | 2009 | 2010 | 2011 | 2012 | ||||||||||||||||
| (in thousands, except share and per share data) | ||||||||||||||||||||
| Consolidated Statements of Operations Data: |
||||||||||||||||||||
| Revenues: |
||||||||||||||||||||
| ETF advisory fees |
$ | 21,643 | $ | 20,812 | $ | 40,567 | $ | 64,366 | $ | 84,024 | ||||||||||
| Other income |
1,968 | 1,283 | 1,045 | 794 | 774 | |||||||||||||||
|
|
|
|
|
|
|
|
|
|
|
|||||||||||
| Total revenues |
23,611 | 22,095 | 41,612 | 65,160 | 84,798 | |||||||||||||||
| Expenses: |
||||||||||||||||||||
| Compensation and benefits |
20,338 | 18,943 | 19,193 | 19,634 | 23,233 | |||||||||||||||
| Fund management and administration |
14,772 | 13,387 | 14,286 | 19,882 | 23,020 | |||||||||||||||
| Marketing and advertising |
5,875 | 2,762 | 3,721 | 4,475 | 5,363 | |||||||||||||||
| Sales and business development |
3,642 | 2,495 | 2,730 | 3,603 | 3,586 | |||||||||||||||
| Professional and consulting fees |
1,871 | 1,780 | 3,779 | 4,307 | 4,603 | |||||||||||||||
| Occupancy, communications and equipment |
1,564 | 1,087 | 1,118 | 1,127 | 1,419 | |||||||||||||||
| Depreciation and amortization |
337 | 360 | 314 | 267 | 307 | |||||||||||||||
| Third party sharing arrangements |
(320 | ) | 89 | 2,296 | 5,651 | 5,468 | ||||||||||||||
| Other |
2,577 | 2,420 | 1,724 | 2,243 | 2,976 | |||||||||||||||
| ETF shareholder proxy |
— | — | — | — | 3,264 | |||||||||||||||
| Litigation, net |
— | — | — | 150 | 176 | |||||||||||||||
| Exchange listing and offering |
— | — | — | 729 | 353 | |||||||||||||||
|
|
|
|
|
|
|
|
|
|
|
|||||||||||
| Total expenses |
50,656 | 43,323 | 49,161 | 62,068 | 73,768 | |||||||||||||||
| Income/(loss) before provision for income taxes |
(27,045 | ) | (21,228 | ) | (7,549 | ) | 3,092 | 11,030 | ||||||||||||
| Provision for income taxes |
— | — | — | — | — | |||||||||||||||
| Tax benefit |
— | — | — | — | — | |||||||||||||||
|
|
|
|
|
|
|
|
|
|
|
|||||||||||
| Net income/(loss) |
$ | (27,045 | ) | $ | (21,228 | ) | $ | (7,549 | ) | $ | 3,092 | $ | 11,030 | |||||||
|
|
|
|
|
|
|
|
|
|
|
|||||||||||
| Net income/(loss) per share—basic |
$ | (0.27 | ) | $ | (0.21 | ) | $ | (0.07 | ) | $ | 0.03 | $ | 0.09 | |||||||
| Net income/(loss) per share—diluted |
$ | (0.27 | ) | $ | (0.21 | ) | $ | (0.07 | ) | $ | 0.02 | $ | 0.08 | |||||||
| Weighted average common shares—basic: |
100,236 | 103,397 | 111,981 | 114,132 | 122,138 | |||||||||||||||
| Weighted average common shares—diluted: |
100,236 | 103,397 | 111,981 | 135,539 | 137,968 | |||||||||||||||
| As of December 31, | ||||||||||||||||||||
| 2008 | 2009 | 2010 | 2011 | 2012 | ||||||||||||||||
| (in thousands) | ||||||||||||||||||||
| Consolidated Balance Sheet Data: |
||||||||||||||||||||
| Cash and cash equivalents |
$ | 13,275 | $ | 11,476 | $ | 14,233 | $ | 25,630 | $ | 41,246 | ||||||||||
| Total assets |
$ | 34,856 | $ | 25,703 | $ | 29,142 | $ | 42,567 | $ | 63,425 | ||||||||||
| Total liabilities |
$ | 12,800 | $ | 9,675 | $ | 11,907 | $ | 16,714 | $ | 12,365 | ||||||||||
| Stockholders’ equity |
$ | 22,056 | $ | 16,028 | $ | 17,235 | $ | 25,853 | $ | 51,060 | ||||||||||
32
| ITEM 7. | MANAGEMENT’S DISCUSSION AND ANALYSIS OF FINANCIAL CONDITION AND RESULTS OF OPERATIONS |
The following discussion and analysis of our financial condition and results of operations should be read together with our consolidated financial statements and the related notes and the other financial information included elsewhere in this Report. In addition to historical consolidated financial information, the following discussion contains forward-looking statements that reflect our plans, estimates and beliefs. Our actual results could differ materially from those discussed in the forward-looking statements. Factors that could cause or contribute to these differences include those discussed below. For a more complete description of the risks noted above and other risks that could cause our actual results to materially differ from our current expectations, please see the Item 1A. “Risk Factors” of this Report. We assume no obligation to update or revise publicly any forward-looking statements, whether as a result of new information, future events or otherwise, unless required by law.
Executive Summary
We were the seventh largest sponsor of ETFs in the United States based on AUM, with AUM of approximately $18.3 billion as of December 31, 2012. An ETF is an investment fund that holds securities such as equities or bonds and/or other assets such as derivatives or commodities and that generally trades at approximately the same price as the net asset value of its underlying components over the course of the trading day. ETFs offer exposure to a wide variety of investment themes, including domestic, international and global equities, fixed income securities, currencies or commodities, as well as securities in specific industries and countries. At December 31, 2012 we offered a comprehensive family of 46 ETFs, which includes 34 international and domestic equity ETFs, five currency ETFs, five international fixed income ETFs and two alternative strategy ETFs.
Through our operating subsidiary, we provide investment advisory and other management services to the WisdomTree ETFs. In exchange for providing these services, we receive advisory fee revenues based on a percentage of the ETFs average daily net assets under management. Our expenses are predominantly related to selling, operating and marketing our ETFs. We have contracted with third parties to provide certain operational services for the ETFs.
We distribute our ETFs through all major channels within the asset management industry, including brokerage firms, registered investment advisors, institutional investors, private wealth managers and discount brokers. We do not target our ETFs for sale directly to the retail segment but rather to financial or investment advisor which act as intermediaries between the end-client and us.
Our revenues have increased substantially since we launched our ETFs in June 2006. Our revenues have grown from $41.6 million in 2010 to a record $84.8 million in 2012 and our financial results have improved from a net loss of $7.5 million in 2010 to net income of $11.0 million in 2012.
Market Environment
We have been and continue to operate in an extremely challenging and highly competitive business environment. Since the financial crises in 2008 and 2009, equity markets have generally improved; however, the markets continue to experience significant volatility due to a host of factors including underlying concerns regarding unemployment and the rate of economic recovery in the United States, the stability of European economies and their banks, and rising inflation and sustainability of growth in the emerging market countries.
33
Since the end of 2009 to the end of 2012, the S&P 500, MSCI EAFE and MSCI Emerging Markets indexes increased 36%, 11% and 15%, respectively; however equity markets have fluctuated significantly during that time period. The following chart reflects the returns for the three broad based equity market indexes and our AUM:
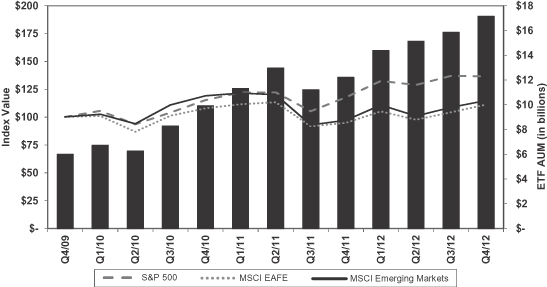
Investment into the markets have been tepid since the financial crisis as reflected by the flows into long-term mutual funds and ETFs as indicated on the chart below:
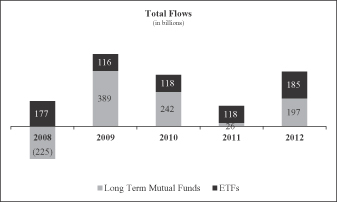
Despite the tepid flows, ETFs flows experienced a record $185 billion in net inflows. In fact, over the last five years, ETFs have gathered more than 50% of the cumulative aggregate inflows of long-term mutual funds and ETFs.
34
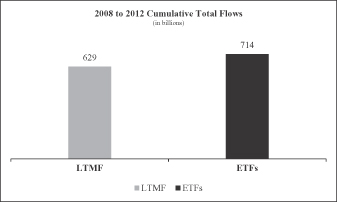
While both mutual funds and ETFs have experienced inflows into fixed income products over the last 5 years, long-term mutual funds have experienced significant outflows of $517 billion in equity products. ETFs, on the other hand, have experienced inflows of $534 billion in equity products.
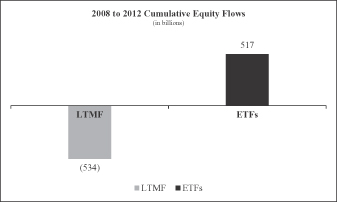
We believe this trend in equity flows is indicative that investors are favoring ETFs, rather than mutual funds, to obtain their equity exposure.
Our Results and Other Business Highlights
Despite a challenging economic environment, our AUM has been growing and reaching record levels each year from $9.9 billion at the end of 2010 to $18.3 billion at the end of 2012. Our net inflows have also been increasing during that same time period from $3.1 billion to $4.7 billion. We believe this trend is a result of our strong product offerings in emerging markets, new product launches to further diversify our product offering, as well as a longer track record for the funds we launched in 2006 and 2007. Our growth strategy seeks to increase our market share of ETF industry inflows through continued product diversification and execution of our marketing and sales strategies.
35
The following charts reflect certain key operating statistics of our business for the periods indicated:
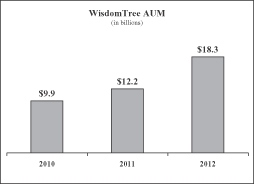
|
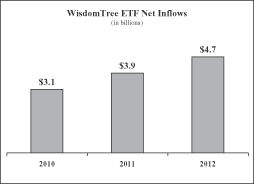
|
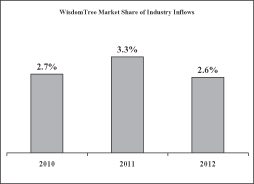
|
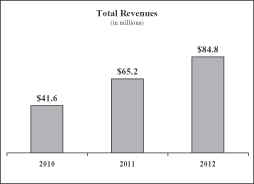
|
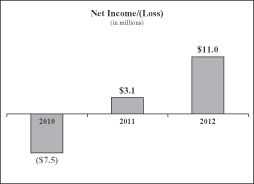
|
Public Offerings
In February 2012, we completed a public offering of our common stock at $5.61 per share. We sold 1 million shares and certain of our stockholders sold 15.5 million shares. Proceeds to us, less commissions and other direct selling expenses, were approximately $4.3 million and were used for working capital and other general corporate purposes. In November 2012, we completed a second public offering of our common stock where certain of our existing stock holders sold 27.8 million shares at $6.10 per share. We did not sell any stock in the second offering and we did not receive any proceeds from the sale of shares of our common stock by the selling stockholders. We incurred $0.4 million in expenses in 2012 related to the November offering.
36
Price Competition in Market Capitalization Weighted Index ETFs
There has been significant price competition in certain broad based market capitalization weighted index ETFs sponsored by Charles Schwab, Vanguard and BlackRock’s iShares. We believe one of our key competitive strengths is that our equity ETFs are based on our own fundamentally weighted index methodology, not market capitalization weighted indexes provided by third parties such as MSCI, S&P Dow Jones or FTSE. This key competitive strength is apparent when comparing the after fee performance of our equity ETFs against their competitive market capitalization weighted indexes, which do not charge a fee. Using our approach, 72% of the $15.4 billion invested in our 34 equity ETFs were in funds that, since their respective inceptions through December 31, 2012, outperformed their market capitalization weighted or competitive benchmarks. Similarly, 23 of our 34 equity ETFs have outperformed their market capitalization weighted or competitive benchmarks over the same period. That is, even after fees, we believe our fundamentally weighted approach can provide investors with better risk-adjusted returns over the long term. We believe our approach differentiates us from our competitors and helps to shield us from the intense price competition occurring in broad based market capitalization weighted index ETFs.
Patent Litigation
On December 1, 2011, Research Affiliates, LLC filed suit against us in the United States District Court for the Central District of California, alleging that the fundamentally weighted investment methodology we employ infringes three of plaintiff’s patents, and seeking both unspecified monetary damages in an amount to be determined and an injunction to prevent further infringement. On November 7, 2012, Research Affiliates, LLC agreed to withdraw its patent infringement suit against us and we agreed to withdraw our counterclaims and entered into a settlement agreement. Under the settlement, all parties exchanged releases for all existing claims. The other material terms of the settlement are as follows:
| • | Research Affiliates agreed not to sue us for any future claims arising under any current patents held by Research Affiliates, as well as any future patents relating to fundamentally-weighted indexes and strategies that may issue under existing or future patent applications that may be filed by Research Affiliates within the next eight years, subject to reduction by up to three years if Research Affiliates is acquired. The covenant not to sue extends to our service providers and customers in connection with our products and services. |
| • | We have agreed not to sue Research Affiliates for any future claims arising under any current patents held by us, as well as any future patents relating to fundamentally-weighted indexes and strategies that may issue under existing or future patent applications that may be filed by us within the next eight years, subject to reduction by up to three years if we are acquired. The covenant not to sue extends to service providers and customers of Research Affiliates in connection with Research Affiliates’ products and services. |
| • | Research Affiliates and we have agreed that the covenants not to sue do not include a right under each party’s patents to copy the other party’s methodologies. Research Affiliates and we have further agreed that it is not copying if Research Affiliates introduces an index or strategy that uses at least three fundamental factors to weight its indexes and they are not predominantly dividend- or earnings-weighted, or we introduce an index or strategy that is weighted by less than three fundamental factors. |
| • | The parties also agreed not to challenge the other party’s patents or patent applications. |
| • | Research Affiliates agreed to a one-time payment of $0.7 million to us. We and the other defendants were not required to make any current or future payments to Research Affiliates. |
All other terms of the settlement are confidential and the settlement will not affect the current methodologies and fees for WisdomTree ETFs.
37
Our insurance carrier funded a significant majority of the cost of defending this patent infringement lawsuit. The net amount of expense, taking into account legal defense and other associated costs we paid to defend ourselves less any amounts our insurance carrier reimbursed us and the receipt of a settlement payment from Research Affiliates, we incurred was $0.2 million in both 2011 and 2012.
Expiration of Joint Venture with BNY Mellon
In 2008, we entered into a mutual participation agreement with Mellon Capital and Dreyfus, wholly owned by BNY Mellon, in which we agreed to collaborate in developing currency and fixed income ETFs under the WisdomTree Trust. Under the agreement, we contributed our expertise in operating the ETFs, sales, marketing and research, and BNY Mellon contributed sub-advisory, fund administration and accounting services for these collaborated ETFs. All third-party costs and profits and losses are shared equally. This agreement was to expire in March 2013.
On October 25, 2012, we agreed to terminate the agreement on December 31, 2012 and entered into a new fee arrangement with BNY Mellon effective January 1, 2013. Under the new arrangement, BNY Mellon will continue to serve as portfolio manager to these ETFs under more traditional sub-advisory economic terms, which is expected to result in improved gross margins on these ETFs at current asset levels.
ETF shareholder proxy solicitation
In the second quarter of 2012, we initiated the solicitation of proxies from the WisdomTree ETF shareholders to obtain approval for us to continue as investment advisor for the WisdomTree ETFs if our largest stockholder, Michael Steinhardt, who beneficially owned 25.5% of our common stock prior to the second public offering discussed above under “Management’s Discussion and Analysis of Financial Condition and Results of Operations – Our Results and Other Business Highlights – Public Offerings”, were to sell or otherwise transfer shares of our common stock resulting in his beneficial ownership falling below 25%. The Investment Company Act presumes a change in control of our Company if Mr. Steinhardt’s ownership fell below the 25% threshold, which would trigger an automatic termination of our investment advisory agreements with the WisdomTree Trust and require approval of the WisdomTree ETF shareholders to continue the agreements. We also sought approval from the WisdomTree ETF shareholders to allow us to change sub-advisors in the future without further shareholder approval. We completed the proxy solicitation and obtained the required approvals in August 2012. No further shareholder approval was required when, in November 2012, Mr. Steinhardt’s ownership fell below 25% in connection with a secondary offering we conducted. We incurred $3.3 million in proxy related expenses in 2012.
NASDAQ Listing
On July 26, 2011, we listed our common stock on The NASDAQ Global Market under symbol “WETF.” Prior to the listing, our common stock was traded on the Pink OTC Market under the symbol “WSDT.” We incurred $0.7 million in expenses related to this listing in 2011.
Components of Revenue
ETF advisory fees
The majority of our revenues are comprised of advisory fees we earn from our ETFs. We earn this revenue based on a percentage of the average daily value of AUM. Our average daily value of AUM is the average of the daily aggregate AUM of our ETFs as determined by the then current net asset value (as defined under Investment Company Act Rule 2a-4) of such ETFs as of the close of business each day. Our fee percentages for individual
38
ETFs range from 0.28% to 0.95%. A summary of the average advisory fee we earn and AUM as of December 31, 2012 by asset class is as follows:
| Average Advisory Fee |
AUM | |||||||
| (in billions) | ||||||||
| Emerging Markets Equity ETFs |
0.67 | % | $ | 7.3 | ||||
| U.S. Equity ETFs |
0.35 | % | $ | 4.4 | ||||
| International Developed Equity ETFs |
0.54 | % | $ | 3.8 | ||||
| International Fixed Income ETFs |
0.55 | % | $ | 2.1 | ||||
| Currency ETFs |
0.50 | % | $ | 0.6 | ||||
| Alternative Strategy ETFs |
0.95 | % | $ | 0.1 | ||||
|
|
|
|
|
|||||
| Total Average Advisory Fee and AUM |
0.54 | % | $ | 18.3 | ||||
We determine the appropriate advisory fee to charge for our ETFs based on the cost of operating each particular ETF taking into account the types of securities the ETFs will hold, fees third party service providers will charge us for operating the ETFs and our competitors’ fees for similar ETFs. Generally, our actively managed ETFs, such as our Alternative Strategy and Currency ETFs, along with our Emerging Market ETFs, are priced higher than our other index based ETFs as the former are more costly to operate.
Each of our ETFs has a fixed advisory fee. In order to increase the advisory fee, we would need to obtain the approval from a majority of the ETF shareholders which may be difficult or not possible to achieve. There may also be a significant cost in obtaining such ETF shareholder approval. We do not need ETF shareholder approval to lower our advisory fee.
Until the end of 2012, the advisory fee charged for our Currency ETFs and one Fixed Income ETF was subject to a joint venture with Mellon Capital and Dreyfus as discussed above under “Management’s Discussion and Analysis of Financial Condition and Results of Operations—Our Results and Other Business Highlights— Expiration of Joint Venture with BNY Mellon”. We have determined that we are the principal participant for transactions under this collaborative arrangement and as such, the advisory fee above reflects the gross fee under this arrangement—see “Notes to the Consolidated Financial Statements” included in this Report.
Our ETF advisory fee revenue may fluctuate based on general stock market trends which include market value appreciation or depreciation, currency fluctuations against the U.S. dollar and level of inflows or outflows from our ETFs. In addition, these revenues may fluctuate due to increased competition or a determination by the independent trustees of the WisdomTree ETFs to terminate or significantly alter the funds’ investment management agreements with us.
Other income
Other income includes fees from licensing our indexes to third parties and interest income from investing our corporate cash. These revenues are immaterial to our financial results and we do not expect them to be material in the near term.
Components of Expenses
Our operating expenses consist primarily of costs related to selling, operating and marketing our ETFs as well as the infrastructure needed to run our business.
Compensation and benefits
Employee compensation and benefits expenses are expensed when incurred and include salaries, incentive compensation, and related benefit costs. Virtually all our employees receive incentive compensation which is
39
based on our operating results as well as their individual performance. Therefore, a portion of this expense will fluctuate with our business results. In order to attract and retain qualified personnel, we must maintain competitive employee compensation and benefit plans. In normal circumstances, we expect to experience a general rise in employee compensation and benefit expenses over the long term as we grow; however, the rate of increase should be less than the rate of increase in our revenues.
Also included in compensation and benefits are costs related to equity awards granted to our employees. Our executive management and Board of Directors believe very strongly that equity awards are an important part of our employees overall compensation package and that incentivizing our employees with equity in the Company aligns the interest of our employees with that of our stockholders. We use the fair value method in recording compensation expense for restricted stock and options grants. Under the fair value method, compensation expense is measured at the grant date based on the estimated fair value of the award and is recognized as an expense over the vesting period. Fair value is determined on the date granted using the Black-Scholes option pricing model for the stock options and is determined by the market value of our common stock for restricted stock awards. At the end of 2012, we changed our employee equity granting policy. See “Factors that may affect our future financial results.”
Fund management and administration
Fund management and administration expenses are expensed when incurred and are comprised of costs we pay third-party service providers to operate our ETFs. Under our advisory agreement with the WisdomTree Trust, the Trustees have approved us and other third parties to provide essential management and administrative services to the Trust and each ETF in exchange for an advisory fee. The costs include:
| • | portfolio management of our ETFs (sub-advisory); |
| • | fund accounting and administration; |
| • | custodial services; |
| • | accounting and tax services; |
| • | printing and mailing of stockholder materials; |
| • | index calculation; |
| • | distribution fees; |
| • | legal and compliance services; |
| • | exchange listing fees; |
| • | trustee fees and expenses; |
| • | preparation of regulatory reports and filings; |
| • | insurance; |
| • | certain local income taxes; and |
| • | other administrative services. |
Of significance, we have contracted with BNY Mellon to act as sub-advisor for 44 of 46 of our ETFs and provide portfolio management, fund administration, custody and accounting related services for all the WisdomTree ETFs. The fees we pay BNY Mellon and other sub-advisors have minimums per fund which range from $25,000 to $85,000 per year depending on the nature of the ETF. In addition, we pay additional fees ranging between 0.015% and 0.18% of average daily AUM at various breakpoint levels. The fees we pay for accounting, tax, index calculation and exchange listing are based on the number of ETFs we have. The remaining fees are based on a combination of both assets under management and number of funds, or as incurred.
40
Marketing and advertising
Marketing and advertising expenses are recorded when incurred and include the following costs:
| • | advertising and product promotion campaigns that are initiated to promote our existing and new ETFs as well as brand awareness; |
| • | development and maintenance of our website; and |
| • | creation and preparation of marketing materials. |
Our discretionary advertising comprises the largest portion of this expense and we expect these costs to increase in the future as we continue to execute our growth strategy and compete against other ETF sponsors and new market entrants. We generally decrease our level of advertising in the third quarter due to a general slowdown of trading activity in the market during the summer months, but we may change that strategy going forward based on our financial results, competitive pressures and market conditions. In addition, we may incur expenditures in certain periods to attract inflows, the benefit of which may or may not be recognized from increases to our assets under management in future periods. However, due to the discretionary nature of some of these costs, they can generally be reduced if there were a decline in the markets.
Sales and business development
Sales and business development expenses are recorded when incurred and includes the following costs:
| • | travel and entertainment or conference related expenses for our sales force; |
| • | market data services for our research team; |
| • | sales related software tools; and |
| • | legal and other advisory fees associated with the development of new funds or business initiatives. |
Professional and consulting fees
Professional fees are expensed when incurred and consist of fees we pay to corporate advisors including accountants, tax advisors, legal counsel, investment bankers, human resources or other consultants. These expenses fluctuate based on our needs or requirements at the time. Certain of these costs are at our discretion and can fluctuate year to year.
Also included in professional fees is stock based compensation related to restricted stock or option awards we granted to senior advisers to our Board of Directors. Under generally accepted accounting principles, these awards are considered variable expenses and are re-measured each reporting period with a corresponding impact to stockholders’ equity. After November 2012, we will no longer incur this expense.
Occupancy, communications and equipment
Occupancy, communications and equipment expense includes costs for our corporate headquarters in New York City. Our office space lease expires in January 2014 and we have begun to search for new office space and as such expect these costs to increase in the future.
Depreciation and amortization
Depreciation and amortization expense results primarily from amortization of leasehold improvements to our office space as well as depreciation on fixed assets we purchase which is depreciated over three or seven years. We expect this expense to increase in future periods in connection with anticipated leasehold improvements we would make for new office space as discussed above.
41
Third-party sharing arrangements
Included in third-party sharing arrangements expense are (1) payments from and reimbursements to us with respect to our joint venture with Mellon Capital and Dreyfus which ended at the end of 2012 and (2) payments to third parties to market our ETFs. Our joint venture with Mellon Capital and Dreyfus is considered a collaborative arrangement and as such we have determined we were the principal participant for transactions under this collaborative arrangement and as such we recorded these transactions on a gross basis reflecting all of the revenues and third party expenses on our financial statements in accordance with the nature of the revenue or expense. Any net profit/loss payments are reflected in the “Third Party Sharing Arrangement” expense line.
Other
Other expenses consist primarily of insurance premiums, general office related expenses, securities license fees for our sales force, public company related expenses, corporate related travel and entertainment and board of director fees, including stock-based compensation related to equity awards we granted to our directors.
Factors that May Impact our Future Financial Results
AUM, Net Inflows and Revenues
Our revenues are highly correlated to the level and relative mix of our AUM, as well as the fee rate associated with our ETFs. While our AUM has increased on an annual basis, we have experienced fluctuations on a quarterly basis due to changes in net inflows and market movement. A significant portion of our AUM is invested in securities issued outside of the United States. Therefore, our AUM and our revenues are affected by movements in global capital market levels and the strengthening or weakening of the U.S. dollar against other currencies.
Another factor impacting our revenues is the fees associated with our ETFs. Our overall average fee rate is affected by the mix of flows into our ETFs. With a significant portion of our AUM invested in securities issued outside of the U.S., favorable market sentiment to emerging markets, currencies and international fixed income is likely to have a positive effect on our overall revenue and conversely unfavorable market sentiment is likely to have a negative impact.
In addition, we currently compete within the ETF market against several large ETF sponsors, many smaller sponsors, as well as new entrants to the marketplace, and will compete against large asset management companies who have recently launched or announced intentions to launch ETF products. However, it is our belief that our ability to gather inflows into our ETFs, coupled with general stock market trends, will have the greatest impact on our business.
Expenses
| • | Strategic growth initiatives—We have and will continue to strategically invest in our business in order to continue and accelerate our growth in the fast growing ETF industry. Our investment in strategic growth initiatives includes anticipated higher spending on marketing, advertising and sales efforts, and increases to our headcount, in both sales and operational support functions. We intend to launch additional ETFs and may close some ETFs in the future, which will impact our fund related costs. We also intend to invest in technology and other tools to enhance our sales efforts and provide value added content to our clients. We expect our investment in strategic growth initiatives to range from $5.0 to $8.0 million in 2013. The components of our strategic growth initiatives may increase or decrease from our planned estimates depending on the nature of the growth initiatives and market conditions. |
| • | Stock-based compensation—At the end of 2012, we changed our practice for granting equity awards to our employees. In the past, we would grant meaningful equity awards when employees were hired that |
42
| would vest over four years with generally no more awards until this initial awards vested. Going forward, employees will receive an equity award as part of their long-term incentive compensation on an annual basis, which is a more typical for maturing companies and companies in the financial services industry. This change in practice will increase our stock-based compensation expense in future periods. In addition, after November 2012, we will no longer incur variable stock-based compensation. |
Gross Margin
Our current gross margin, which we define as our total revenues less our fund management and administration expenses and less third-party sharing arrangements, was approximately 66% for the year ended December 31, 2012. Due to the end of our joint venture with BNY-Mellon and our current AUM levels and mix, we expect our gross margins to be between 70% and 75% in the near term.
Seasonality
We believe seasonal fluctuations in the asset management industry are common. However, since we began our operations, we believe these seasonal trends may have been masked by the unprecedented volatility in the global equity markets. Therefore, period to period comparisons of ours or the industry’s net inflows may not be meaningful and not indicative of results in future periods.
43
Key Operating Statistics
The following table presents key operating statistics that serve as indicators for the performance of our business:
| Year Ended December 31, | ||||||||||||
| 2012 | 2011 | 2010 | ||||||||||
| Total ETFs (in millions) |
||||||||||||
| Beginning of period assets |
$ | 12,182 | $ | 9,891 | $ | 5,979 | ||||||
| Inflows/(outflows) |
4,732 | 3,899 | 3,134 | |||||||||
| Market appreciation/(depreciation) |
1,372 | (1,608 | ) | 778 | ||||||||
|
|
|
|
|
|
|
|||||||
| End of period assets |
$ | 18,286 | $ | 12,182 | $ | 9,891 | ||||||
|
|
|
|
|
|
|
|||||||
| Average assets during the period |
$ | 15,554 | $ | 11,739 | $ | 7,311 | ||||||
| ETF Industry and Market Share (in billions) |
||||||||||||
| ETF industry net inflows |
$ | 185 | $ | 118 | $ | 118 | ||||||
| WisdomTree market share of industry inflows |
2.6 | % | 3.3 | % | 2.7 | % | ||||||
| International Developed Equity ETFs (in millions) |
||||||||||||
| Beginning of period assets |
$ | 2,407 | $ | 2,311 | $ | 2,311 | ||||||
| Inflows/(outflows) |
1,000 | 471 | (87 | ) | ||||||||
| Market appreciation/(depreciation) |
325 | (375 | ) | 87 | ||||||||
|
|
|
|
|
|
|
|||||||
| End of period assets |
$ | 3,732 | $ | 2,407 | $ | 2,311 | ||||||
|
|
|
|
|
|
|
|||||||
| Average assets during the period |
$ | 2,854 | $ | 2,634 | $ | 2,164 | ||||||
| Emerging Markets Equity ETFs (in millions) |
||||||||||||
| Beginning of period assets |
$ | 3,613 | $ | 3,780 | $ | 1,431 | ||||||
| Inflows/(outflows) |
3,111 | 924 | 1,911 | |||||||||
| Market appreciation/(depreciation) |
608 | (1,091 | ) | 438 | ||||||||
|
|
|
|
|
|
|
|||||||
| End of period assets |
$ | 7,332 | $ | 3,613 | $ | 3,780 | ||||||
|
|
|
|
|
|
|
|||||||
| Average assets during the period |
$ | 5,715 | $ | 3,664 | $ | 2,202 | ||||||
| US Equity ETFs (in millions) |
||||||||||||
| Beginning of period assets |
$ | 3,429 | $ | 2,057 | $ | 1,330 | ||||||
| Inflows/(outflows) |
610 | 1,255 | 486 | |||||||||
| Market appreciation/(depreciation) |
332 | 117 | 241 | |||||||||
|
|
|
|
|
|
|
|||||||
| End of period assets |
$ | 4,371 | $ | 3,429 | $ | 2,057 | ||||||
|
|
|
|
|
|
|
|||||||
| Average assets during the period |
$ | 4,252 | $ | 2,507 | $ | 1,592 | ||||||
| Currency ETFs (in millions) |
||||||||||||
| Beginning of period assets |
$ | 950 | $ | 1,179 | $ | 907 | ||||||
| Inflows/(outflows) |
(351 | ) | (69 | ) | 253 | |||||||
| Market appreciation/(depreciation) |
12 | (129 | ) | 19 | ||||||||
| Reclass to Int’l Fixed Income |
(31 | ) | ||||||||||
|
|
|
|
|
|
|
|||||||
| End of period assets |
$ | 611 | $ | 950 | $ | 1,179 | ||||||
|
|
|
|
|
|
|
|||||||
| Average assets during the period |
$ | 772 | $ | 1,480 | $ | 1,217 | ||||||
| International Fixed Income ETFs (in millions) |
||||||||||||
| Beginning of period assets |
$ | 1,506 | $ | 564 | — | |||||||
| Inflows/(outflows) |
491 | 1,022 | $ | 571 | ||||||||
| Market appreciation/(depreciation) |
121 | (111 | ) | (7 | ) | |||||||
| Reclass from Currency |
31 | |||||||||||
|
|
|
|
|
|
|
|||||||
| End of period assets |
$ | 2,118 | $ | 1,506 | $ | 564 | ||||||
|
|
|
|
|
|
|
|||||||
| Average assets during the period |
$ | 1,770 | $ | 1,297 | $ | 136 | ||||||
44
| Year Ended December 31, | ||||||||||||
| 2012 | 2011 | 2010 | ||||||||||
| Alternative Strategy ETFs (in millions) |
||||||||||||
| Beginning of period assets |
$ | 277 | — | — | ||||||||
| Inflows/(outflows) |
(129 | ) | 296 | |||||||||
| Market appreciation/(depreciation) |
(26 | ) | (19 | ) | ||||||||
|
|
|
|
|
|
|
|||||||
| End of period assets |
$ | 122 | $ | 277 | ||||||||
|
|
|
|
|
|
|
|||||||
| Average assets during the period |
$ | 191 | $ | 157 | ||||||||
| Average ETF asset mix during the period |
||||||||||||
| Emerging markets equity ETFs |
37 | % | 31 | % | 29 | % | ||||||
| International developed equity ETFs |
19 | % | 22 | % | 30 | % | ||||||
| US equity ETFs |
27 | % | 21 | % | 22 | % | ||||||
| Currency ETFs |
5 | % | 13 | % | 17 | % | ||||||
| International fixed income ETFs |
11 | % | 12 | % | 2 | % | ||||||
| Alternative strategy ETFs |
1 | % | 1 | % | ||||||||
|
|
|
|
|
|
|
|||||||
| Total |
100 | % | 100 | % | 100 | % | ||||||
|
|
|
|
|
|
|
|||||||
| Average ETF advisory fee during the period |
0.54 | % | 0.55 | % | 0.56 | % | ||||||
| Number of ETFs—end of the period |
||||||||||||
| International developed equity ETFs |
18 | 18 | 18 | |||||||||
| US equity ETFs |
11 | 12 | 12 | |||||||||
| Currency ETFs |
5 | 7 | 9 | |||||||||
| Emerging markets equity ETFs |
5 | 4 | 4 | |||||||||
| International fixed income ETFs |
5 | 4 | 1 | |||||||||
| Alternative strategy ETFs |
2 | 2 | ||||||||||
|
|
|
|
|
|
|
|||||||
| Total |
46 | 47 | 44 | |||||||||
|
|
|
|
|
|
|
|||||||
| Headcount |
70 | 65 | 60 | |||||||||
Year Ended December 31, 2012 Compared to December 31, 2011
Overview
| As of and for the Year Ended December 31, |
Change | Percent Change |
||||||||||||||
| 2012 | 2011 | |||||||||||||||
| Assets Under Management (in millions) |
||||||||||||||||
| Beginning of period assets |
$ | 12,182 | $ | 9,891 | ||||||||||||
| Net inflows |
4,732 | 3,899 | 833 | 21.4 | % | |||||||||||
| Market appreciation/(depreciation) |
1,372 | (1,608 | ) | |||||||||||||
|
|
|
|
|
|
|
|||||||||||
| End of period assets |
$ | 18,286 | $ | 12,182 | $ | 6,104 | 50.1 | % | ||||||||
|
|
|
|
|
|
|
|||||||||||
| Financial Results (in thousands) |
||||||||||||||||
| Total revenues |
$ | 84,798 | $ | 65,160 | $ | 19,638 | 30.1 | % | ||||||||
| Total expenses |
73,768 | 62,068 | 11,700 | 18.9 | % | |||||||||||
|
|
|
|
|
|
|
|||||||||||
| Net income |
$ | 11,030 | $3,092 | $ | 7,938 | 256.7 | % | |||||||||
|
|
|
|
|
|
|
|||||||||||
Our AUM increased 50.1% from $12.2 billion at the end of 2011 to $18.3 billion at the end of 2012 primarily due to strong net inflows into our ETFs and positive market movement. We reported net income of $11.0 million in 2012 compared to $3.1 million in 2011 primarily due to higher assets under management.
45
Revenues
| Year Ended December 31, |
Change | Percent Change |
||||||||||||||
| 2012 | 2011 | |||||||||||||||
| Average assets under management (in millions) |
$ | 15,554 | $ | 11,739 | $ | 3,815 | 32.5 | % | ||||||||
| Average ETF advisory fee |
0.54 | % | 0.55 | % | (0.01 | ) | (1.8 | %) | ||||||||
| ETF advisory fees (in thousands) |
$ | 84,024 | $ | 64,366 | $ | 19,658 | 30.5 | % | ||||||||
| Other income (in thousands) |
774 | 794 | (20 | ) | (2.5 | %) | ||||||||||
|
|
|
|
|
|
|
|||||||||||
| Total revenues (in thousands) |
$ | 84,798 | $ | 65,160 | $ | 19,638 | 30.1 | % | ||||||||
|
|
|
|
|
|
|
|||||||||||
ETF advisory fees
ETF advisory fees revenue increased 30.5% from $64.4 million in 2011 to $84.0 million in 2012. This increase was primarily due to higher average asset balances due to strong net inflows particularly into our emerging market and international equity ETFs. The average fee earned decreased to 0.54% in 2012 from 0.55% in 2011 primarily due to a change in mix of our assets under management, in particular from our emerging market equity ETFs.
Other income
Other income decreased 2.5% from 2011 to 2012. This decline was primarily due to lower separate account revenues and lower interest income on our cash balances. Following the first quarter of 2011, we no longer managed separate accounts.
Expenses
| (in thousands) |
Year Ended December 31, |
Change | Percent Change |
|||||||||||||
| 2012 | 2011 | |||||||||||||||
| Compensation and benefits |
23,233 | 19,634 | 3,599 | 18.3 | % | |||||||||||
| Fund management and administration |
23,020 | 19,882 | 3,138 | 15.8 | % | |||||||||||
| Marketing and advertising |
5,363 | 4,475 | 888 | 19.8 | % | |||||||||||
| Sales and business development |
3,586 | 3,603 | (17 | ) | -0.5 | % | ||||||||||
| Professional and consulting fees |
4,603 | 4,307 | 296 | 6.9 | % | |||||||||||
| Occupancy, communications and equipment |
1,419 | 1,127 | 292 | 25.9 | % | |||||||||||
| Depreciation and amortization |
307 | 267 | 40 | 15.0 | % | |||||||||||
| Third-party sharing arrangements |
5,468 | 5,651 | (183 | ) | -3.2 | % | ||||||||||
| Other |
2,976 | 2,243 | 733 | 32.7 | % | |||||||||||
| ETF shareholder proxy |
3,264 | — | 3,264 | n/a | ||||||||||||
| Litigation, net |
176 | 150 | 26 | 17.3 | % | |||||||||||
| Exchange listing and offering |
353 | 729 | (376 | ) | -51.6 | % | ||||||||||
|
|
|
|
|
|
|
|
|
|||||||||
| Total expenses |
$ | 73,768 | $ | 62,068 | $ | 11,700 | 18.9 | % | ||||||||
|
|
|
|
|
|
|
|
|
|||||||||
46
| As a Percent of Revenues: |
Year Ended December 31, |
|||||||
| 2012 | 2011 | |||||||
| Compensation and benefits |
27.4 | % | 30.1 | % | ||||
| Fund management and administration |
27.1 | % | 30.5 | % | ||||
| Marketing and advertising |
6.3 | % | 6.9 | % | ||||
| Sales and business development |
4.2 | % | 5.5 | % | ||||
| Professional and consulting fees |
5.4 | % | 6.6 | % | ||||
| Occupancy, communications and equipment |
1.7 | % | 1.7 | % | ||||
| Depreciation and amortization |
0.4 | % | 0.5 | % | ||||
| Third-party sharing arrangements |
6.5 | % | 8.7 | % | ||||
| Other |
3.5 | % | 3.4 | % | ||||
| ETF shareholder proxy |
3.9 | % | 0.0 | % | ||||
| Litigation, net |
0.2 | % | 0.3 | % | ||||
| Exchange listing and offering |
0.4 | % | 1.1 | % | ||||
|
|
|
|
|
|||||
| Total expenses |
87.0 | % | 95.3 | % | ||||
|
|
|
|
|
|||||
Compensation and benefits
Compensation and benefits expense increased 18.3% from $19.6 million in 2011 to $23.2 million in 2012. This increase was primarily due to higher accrued incentive compensation due to our strong results, higher stock based compensation expense due to equity awards granted to our employees as part of their 2011 year end incentive compensation, as well as costs associated with higher headcount. Our headcount at the end of 2012 was 70 compared to 65 at the end of 2011.
Fund management and administration
Fund management and administration expense increased 15.8% from $19.9 million in 2011 to $23.0 million in 2012. Higher average assets under management led to an increase of $1.9 million in portfolio management, fund administration and accounting, index licensing, and distribution fees. Included in 2011 is a one-time charge of $0.7 million related to reimbursing the WisdomTree India ETF for excess fees we collected as a result of overestimating the operating expense recapture fees for the India ETF’s fiscal year ended March 31, 2011. Printing related fees increased $0.4 million due to an increase in the number of shareholders owning our ETFs and legal related fees increased $0.3 million due to additional services. This expense also increased due to two additional ETFs we launched in 2012. We had 47 ETFs at the end of 2011, we launched 2 new ETFs during 2012 and closed 3 ETFs at the end of 2012 resulting in 46 ETFs at the end of 2012.
Marketing and advertising
Marketing and advertising expense increased 19.8% from $4.5 million in 2011 to $5.4 million in 2012 primarily due to higher levels of television, print and online advertising to support our growth.
Sales and business development
Sales and business development expense was essentially unchanged at $3.6 million in 2012 and 2011 as higher sales related activity expenses to support our growth offset lower new product related spending.
Professional and consulting fees
Professional and consulting fees increased 6.9% from $4.3 million in 2011 to $4.6 million in 2012. Variable stock based compensation for equity awards granted to strategic advisors decreased $0.5 million due to the full vesting of equity awards we granted to non-employees. We will not have variable compensation costs going
47
forward. Partly offsetting this decrease was an increase in accounting and legal related fees as a result of becoming a fully reporting public company and complying with the requirements of the Sarbanes-Oxley Act of 2002 as well as executive recruiting fees associated with the search for a new Chief Operating Officer which was completed during 2012.
Occupancy, communications and equipment
Occupancy, communications and equipment expense increased 25.9% from $1.1 million in 2011 to $1.4 million in 2012 primarily due to the end of our office space we had sub-leased in 2012.
Depreciation and amortization
Depreciation and amortization expense remained relatively unchanged at $0.3 million in 2011 and 2012.
Third-party sharing arrangements
Third-party sharing arrangements decreased 3.2% from $5.7 million in 2011 to $5.5 million in 2012 primarily due to lower levels of net profits in our currency and fixed income ETFs, which are subject to a profit sharing agreement with Mellon Capital and Dreyfus. Partly offsetting this decrease was higher fees paid to third parties for marketing our ETFs.
Other
Other expenses increased 32.7% from $2.2 million in 2011 to $3.0 million in 2012 primarily due to higher corporate insurance, public company and administrative related expenses.
Year Ended December 31, 2011 Compared to December 31, 2010
Overview
| As of and for the Year Ended December 31, |
Change | Percent Change |
||||||||||||||
| 2011 | 2010 | |||||||||||||||
| Assets Under Management (in millions) |
||||||||||||||||
| Beginning of period assets |
$ | 9,891 | $ | 5,979 | ||||||||||||
| Net inflows |
3,899 | 3,134 | $ | 765 | 24.4 | % | ||||||||||
| Market appreciation/(depreciation) |
(1,608 | ) | 778 | |||||||||||||
|
|
|
|
|
|
|
|||||||||||
| End of period assets |
$ | 12,182 | $ | 9,891 | $ | 2,291 | 23.2 | % | ||||||||
|
|
|
|
|
|
|
|||||||||||
| Financial Results (in thousands) |
||||||||||||||||
| Total revenues |
$ | 65,160 | $ | 41,612 | $ | 23,548 | 56.6 | % | ||||||||
| Total expenses |
62,068 | 49,161 | 12,907 | 26.3 | % | |||||||||||
|
|
|
|
|
|
|
|||||||||||
| Net income/(loss) |
$3,092 | ($ | 7,549 | ) | $ | 10,641 | ||||||||||
|
|
|
|
|
|
|
|||||||||||
Our AUM increased 23.2% from $9.9 billion in 2010 to $12.2 billion in 2011 primarily due to strong net inflows into our ETFs partly offset by negative market movement. We reported net income of $3.1 million in 2011 compared to a loss of $7.5 million in 2010 primarily due to higher assets under management.
48
Revenues
| Year Ended December 31, |
Change | Percent Change |
||||||||||||||
| 2011 | 2010 | |||||||||||||||
| Average assets under management (in millions) |
$ | 11,739 | $ | 7,308 | $ | 4,431 | 60.6 | % | ||||||||
| Average ETF advisory fee |
0.55 | % | 0.56 | % | (0.01 | ) | (1.8 | %) | ||||||||
| ETF advisory fees (in thousands) |
$ | 64,366 | $ | 40,567 | $ | 23,799 | 58.7 | % | ||||||||
| Other income (in thousands) |
794 | 1,045 | (251 | ) | (24.0 | %) | ||||||||||
|
|
|
|
|
|
|
|||||||||||
| Total revenues (in thousands) |
$ | 65,160 | $ | 41,612 | $ | 23,548 | 56.6 | % | ||||||||
|
|
|
|
|
|
|
|||||||||||
ETF advisory fees
ETF advisory fees revenue increased 58.7% from $40.6 million in 2010 to $64.4 million in 2011. This increase was primarily due to higher average asset balances due to strong net inflows particularly into our U.S. equity and international fixed income ETFs. The average fee earned decreased to 0.55% in 2011 from 0.56% in 2010 primarily due to a change in mix of our assets under management, in particular from our emerging market equity ETFs.
Other income
Other income decreased 24.0% from $1.0 million in 2010 to $0.8 million in 2011. This decline was primarily due to lower separate account revenues. Following the first quarter of 2011, we no longer managed separate accounts.
Expenses
| (in thousands) |
Year Ended December 31, |
Change | Percent Change |
|||||||||||||
| 2011 | 2010 | |||||||||||||||
| Compensation and benefits |
$ | 19,634 | $ | 19,193 | $ | 441 | 2.3 | % | ||||||||
| Fund management and administration |
19,882 | 14,286 | 5,596 | 39.2 | % | |||||||||||
| Marketing and advertising |
4,475 | 3,721 | 754 | 20.3 | % | |||||||||||
| Sales and business development |
3,603 | 2,730 | 873 | 32.0 | % | |||||||||||
| Professional and consulting fees |
4,307 | 3,779 | 528 | 14.0 | % | |||||||||||
| Occupancy, communications and equipment |
1,127 | 1,118 | 9 | 0.8 | % | |||||||||||
| Depreciation and amortization |
267 | 314 | (47 | ) | -15.0 | % | ||||||||||
| Third-party sharing arrangements |
5,651 | 2,296 | 3,355 | 146.1 | % | |||||||||||
| Other |
2,243 | 1,724 | 519 | 30.1 | % | |||||||||||
| Litigation, net |
150 | — | 150 | na | ||||||||||||
| Exchange listing and offering |
729 | — | 729 | na | ||||||||||||
|
|
|
|
|
|
|
|
|
|||||||||
| Total expenses |
$ | 62,068 | $ | 49,161 | $ | 12,907 | 26.3 | % | ||||||||
|
|
|
|
|
|
|
|
|
|||||||||
49
| As a Percent of Revenues: |
Year Ended December 31, |
|||||||
| 2011 | 2010 | |||||||
| Compensation and benefits |
30.1 | % | 46.1 | % | ||||
| Fund management and administration |
30.5 | % | 34.3 | % | ||||
| Marketing and advertising |
6.9 | % | 8.9 | % | ||||
| Sales and business development |
5.5 | % | 6.6 | % | ||||
| Professional and consulting fees |
6.6 | % | 9.1 | % | ||||
| Occupancy, communications and equipment |
1.7 | % | 2.7 | % | ||||
| Depreciation and amortization |
0.5 | % | 0.8 | % | ||||
| Third-party sharing arrangements |
8.7 | % | 5.5 | % | ||||
| Other |
3.4 | % | 4.1 | % | ||||
| Litigation, net |
0.2 | % | — | |||||
| Exchange listing and offering |
1.1 | % | — | |||||
|
|
|
|
|
|||||
| Total expenses |
95.3 | % | 118.1 | % | ||||
|
|
|
|
|
|||||
Compensation and benefits
Compensation and benefits expense increased 2.3% from $19.2 million in 2010 to $19.6 million in 2011 primarily due to higher accrued incentive compensation due to our strong 2011 results, as well as costs associated with higher headcount. Our headcount increased from 60 at the end of 2010 to 65 at the end of 2011. Partly offsetting this increase was a decrease of $2.4 million in stock-based compensation as equity awards granted to employees in prior years with higher fair values become fully vested.
Fund management and administration
Fund management and administration expense increased 39.2% from $14.3 million in 2010 to $19.9 million in 2011. Higher average assets under management led to an increase of $3.7 million in portfolio management, fund administration and accounting, index licensing, and distribution fees. Included in 2011 is a one-time charge of $0.7 million related to reimbursing the WisdomTree India ETF for excess fees we collected as a result of overestimating the operating expense recapture fees for the India ETF’s fiscal year ended March 31, 2011. Printing related fees increased $0.5 million due to an increase in the number of shareholders owning our ETFs. In addition, auditing related fees increased $0.4 million due to additional services as well as an increase in the number of funds. We had 47 ETFs at the end of 2011 compared to 44 at the end of 2010.
Marketing and advertising
Marketing and advertising expense increased 20.3% from $3.7 million in 2010 to $4.5 million in 2011 primarily due to higher levels of television, print and online advertising to support our growth.
Sales and business development
Sales and business development expense increased 32.0% from $2.7 million in 2010 to $3.6 million in 2011 primarily due to higher new product related spending and sales activities to support our growth.
Professional and consulting fees
Professional and consulting fees increased 14.0% from $3.8 million in 2010 to $4.3 million in 2011. Variable stock based compensation for equity awards granted to strategic advisors increased $0.7 million from $2.0 million to $2.7 million due to an increase in our stock price. Legal and accounting fees associated with the preparation of our SEC registration statement on Form 10 in connection with the listing of our common stock onto the NASDAQ Global Market were $0.7 million in 2011. Also in 2011, we incurred $0.2 million in legal expenses associated with litigation with Research Affiliates.
50
Occupancy, communications and equipment
Occupancy, communications and equipment expense remained relatively unchanged at $1.1 million in 2010 and 2011.
Depreciation and amortization
Depreciation and amortization expense remained relatively unchanged at $0.3 million in 2010 and 2011.
Third-party sharing arrangements
Third-party sharing arrangements increased $3.4 million from $2.3 million in 2010 to $5.7 million in 2011. This increase was primarily due to a $2.9 million increase in net profits in our currency and fixed income ETFs, which are subject to a profit sharing agreement with Mellon Capital and Dreyfus. Under the agreement, we share revenues and third party costs equally. This expense increased due to the higher average asset balances in these ETFs. In addition, fees paid to third parties for marketing our ETFs in the independent broker-dealer channel and Latin America increased by $0.5 million.
Other
Other expenses increased 30.1% from $1.7 million in 2010 to $2.2 million in 2011 primarily due to higher corporate insurance, public company and administrative related expenses.
Quarterly Results
The following tables set forth our unaudited consolidated quarterly statement of operations data, both in dollar amounts and as a percentage of total revenues, and our unaudited consolidated quarterly operating data for the quarters in 2011 and 2012. In our opinion, this unaudited information has been prepared on substantially the same basis as the consolidated financial statements appearing elsewhere in this Report and includes all adjustments (consisting of normal recurring adjustments) necessary for a fair statement of the unaudited consolidated quarterly data. The unaudited consolidated quarterly data should be read together with the
51
consolidated financial statements and related notes included elsewhere in this Report. The results for any quarter are not necessarily indicative of results for any future period, and you should not rely on them as such.
| (in thousands) | Q1/11 | Q2/11 | Q3/11 | Q4/11 | Q1/12 | Q2/12 | Q3/12 | Q4/12 | ||||||||||||||||||||||||
| Revenues |
||||||||||||||||||||||||||||||||
| ETF advisory fees |
$ | 14,273 | $ | 16,514 | $ | 17,554 | $ | 16,025 | $ | 18,975 | $ | 20,230 | $ | 21,440 | $ | 23,379 | ||||||||||||||||
| Other income |
260 | 202 | 182 | 150 | 195 | 163 | 221 | 195 | ||||||||||||||||||||||||
|
|
|
|
|
|
|
|
|
|
|
|
|
|
|
|
|
|||||||||||||||||
| Total revenues |
14,533 | 16,716 | 17,736 | 16,175 | 19,170 | 20,393 | 21,661 | 23,574 | ||||||||||||||||||||||||
| Expenses |
||||||||||||||||||||||||||||||||
| Compensation and benefits |
5,217 | 4,610 | 5,085 | 4,722 | 5,857 | 5,477 | 5,734 | 6,165 | ||||||||||||||||||||||||
| Fund management and administration |
4,162 | 5,736 | 5,093 | 4,891 | 5,439 | 5,567 | 5,671 | 6,343 | ||||||||||||||||||||||||
| Marketing and advertising |
972 | 1,357 | 911 | 1,235 | 1,326 | 1,548 | 862 | 1,627 | ||||||||||||||||||||||||
| Sales and business development |
745 | 913 | 954 | 991 | 860 | 842 | 831 | 1,053 | ||||||||||||||||||||||||
| Professional and consulting fees |
977 | 966 | 1,250 | 1,114 | 1,109 | 1,401 | 1,305 | 788 | ||||||||||||||||||||||||
| Occupancy, communications and equipment |
273 | 285 | 288 | 281 | 301 | 375 | 374 | 369 | ||||||||||||||||||||||||
| Depreciation and amortization |
65 | 67 | 68 | 67 | 71 | 75 | 79 | 82 | ||||||||||||||||||||||||
| Third-party sharing arrangements |
1,128 | 1,512 | 1,794 | 1,217 | 1,745 | 1,229 | 1,194 | 1,300 | ||||||||||||||||||||||||
| Other |
457 | 457 | 711 | 618 | 609 | 743 | 859 | 765 | ||||||||||||||||||||||||
| ETF shareholder proxy |
— | — | — | — | 66 | 3,198 | — | — | ||||||||||||||||||||||||
| Litigation, net |
— | — | — | 150 | 672 | (191 | ) | 219 | (524 | ) | ||||||||||||||||||||||
| Exchange listing and offering |
382 | 124 | 223 | — | — | — | — | 353 | ||||||||||||||||||||||||
|
|
|
|
|
|
|
|
|
|
|
|
|
|
|
|
|
|||||||||||||||||
| Total expenses |
14,378 | 16,027 | 16,377 | 15,286 | 18,055 | 20,264 | 17,128 | 18,321 | ||||||||||||||||||||||||
|
|
|
|
|
|
|
|
|
|
|
|
|
|
|
|
|
|||||||||||||||||
| Net income/(loss) |
$ | 155 | $ | 689 | $ | 1,359 | $ | 889 | $ | 1,115 | $ | 129 | $ | 4,533 | $ | 5,253 | ||||||||||||||||
|
|
|
|
|
|
|
|
|
|
|
|
|
|
|
|
|
|||||||||||||||||
| Q1/11 | Q2/11 | Q3/11 | Q4/11 | Q1/12 | Q2/12 | Q3/12 | Q4/12 | |||||||||||||||||||||||||
| Percent of Revenues |
||||||||||||||||||||||||||||||||
| Revenues |
||||||||||||||||||||||||||||||||
| ETF advisory fees |
98.2 | % | 98.8 | % | 99.0 | % | 99.1 | % | 99.0 | % | 99.2 | % | 99.0 | % | 99.2 | % | ||||||||||||||||
| Other income |
1.8 | % | 1.2 | % | 1.0 | % | 0.9 | % | 1.0 | % | 0.8 | % | 1.0 | % | 0.8 | % | ||||||||||||||||
|
|
|
|
|
|
|
|
|
|
|
|
|
|
|
|
|
|||||||||||||||||
| Total revenues |
100.0 | % | 100.0 | % | 100.0 | % | 100.0 | % | 100.0 | % | 100.0 | % | 100.0 | % | 100.0 | % | ||||||||||||||||
| Expenses |
||||||||||||||||||||||||||||||||
| Compensation and benefits |
35.9 | % | 27.6 | % | 28.7 | % | 29.2 | % | 30.5 | % | 26.9 | % | 26.5 | % | 26.2 | % | ||||||||||||||||
| Fund management and administration |
28.6 | % | 34.3 | % | 28.7 | % | 30.3 | % | 28.4 | % | 27.3 | % | 26.2 | % | 26.9 | % | ||||||||||||||||
| Marketing and advertising |
6.7 | % | 8.1 | % | 5.1 | % | 7.7 | % | 6.9 | % | 7.6 | % | 4.0 | % | 6.9 | % | ||||||||||||||||
| Sales and business development |
5.1 | % | 5.5 | % | 5.4 | % | 6.1 | % | 4.5 | % | 4.1 | % | 3.8 | % | 4.5 | % | ||||||||||||||||
| Professional and consulting fees |
6.7 | % | 5.8 | % | 7.0 | % | 6.9 | % | 5.8 | % | 6.9 | % | 6.0 | % | 3.3 | % | ||||||||||||||||
| Occupancy, communications and equipment |
1.9 | % | 1.7 | % | 1.6 | % | 1.7 | % | 1.6 | % | 1.8 | % | 1.7 | % | 1.6 | % | ||||||||||||||||
| Depreciation and amortization |
0.5 | % | 0.4 | % | 0.4 | % | 0.4 | % | 0.4 | % | 0.4 | % | 0.4 | % | 0.3 | % | ||||||||||||||||
| Third-party sharing arrangements |
7.8 | % | 9.1 | % | 10.1 | % | 7.5 | % | 9.1 | % | 6.0 | % | 5.5 | % | 5.5 | % | ||||||||||||||||
| Other |
3.1 | % | 2.7 | % | 4.0 | % | 3.8 | % | 3.2 | % | 3.6 | % | 4.0 | % | 3.2 | % | ||||||||||||||||
| ETF shareholder proxy |
— | — | — | — | 0.3 | % | 15.7 | % | — | — | ||||||||||||||||||||||
| Litigation, net |
— | — | — | 0.9 | % | 3.5 | % | (0.9 | %) | 1.0 | % | (2.2 | %) | |||||||||||||||||||
| Exchange listing and offering |
2.6 | % | 0.7 | % | 1.3 | % | — | — | — | — | 1.5 | % | ||||||||||||||||||||
|
|
|
|
|
|
|
|
|
|
|
|
|
|
|
|
|
|||||||||||||||||
| Total expenses |
98.9 | % | 95.9 | % | 92.3 | % | 94.5 | % | 94.2 | % | 99.4 | % | 79.1 | % | 77.7 | % | ||||||||||||||||
|
|
|
|
|
|
|
|
|
|
|
|
|
|
|
|
|
|||||||||||||||||
| Net income/(loss) |
1.1 | % | 4.1 | % | 7.7 | % | 5.5 | % | 5.8 | % | 0.6 | % | 20.9 | % | 22.3 | % | ||||||||||||||||
|
|
|
|
|
|
|
|
|
|
|
|
|
|
|
|
|
|||||||||||||||||
| Q1/11 | Q2/11 | Q3/11 | Q4/11 | Q1/12 | Q2/12 | Q3/12 | Q4/12 | |||||||||||||||||||||||||
| Operating Statistics |
||||||||||||||||||||||||||||||||
| Total ETF AUM (in millions) |
||||||||||||||||||||||||||||||||
| Beginning of period assets |
$ | 9,891 | $ | 11,284 | $ | 12,934 | $ | 11,184 | $ | 12,182 | $ | 15,691 | $ | 15,004 | $ | 16,783 | ||||||||||||||||
| Inflows/(outflows) |
1,264 | 1,699 | 179 | 756 | 2,299 | 338 | 1,036 | 1,059 | ||||||||||||||||||||||||
| Market appreciation/(depreciation) |
129 | (49 | ) | (1,929 | ) | 242 | 1,210 | (1025 | ) | 743 | 444 | |||||||||||||||||||||
|
|
|
|
|
|
|
|
|
|
|
|
|
|
|
|
|
|||||||||||||||||
| End of period assets |
$ | 11,284 | $ | 12,934 | $ | 11,184 | $ | 12,182 | $ | 15,691 | $ | 15,004 | $ | 16,783 | $ | 18,286 | ||||||||||||||||
|
|
|
|
|
|
|
|
|
|
|
|
|
|
|
|
|
|||||||||||||||||
| Average assets during the period |
$ | 10,294 | $ | 12,062 | $ | 12,762 | $ | 11,836 | $ | 14,265 | $ | 15,116 | $ | 15,769 | $ | 17,068 | ||||||||||||||||
52
| Q1/11 | Q2/11 | Q3/11 | Q4/11 | Q1/12 | Q2/12 | Q3/12 | Q4/12 | |||||||||||||||||||||||||
| ETF Industry and Market Share (in billions) |
||||||||||||||||||||||||||||||||
| ETF industry net inflows |
$ | 23.6 | $ | 29.2 | $ | 20.9 | $ | 43.9 | $ | 53.2 | $ | 25.0 | $ | 51.8 | $ | 55.4 | ||||||||||||||||
| WisdomTree market share of industry inflows |
5.4 | % | 5.8 | % | 0.9 | % | 1.7 | % | 4.3 | % | 1.4 | % | 2.0 | % | 1.9 | % | ||||||||||||||||
| International Developed Equity ETFs (in millions) |
||||||||||||||||||||||||||||||||
| Beginning of period assets |
$ | 2,311 | $ | 2,865 | $ | 2,867 | $ | 2,501 | $ | 2,407 | $ | 2,964 | $ | 2,846 | $ | 2,896 | ||||||||||||||||
| Inflows/(outflows) |
475 | 33 | 57 | (94 | ) | 302 | 137 | (58 | ) | 620 | ||||||||||||||||||||||
| Market appreciation/(depreciation) |
79 | (31 | ) | (423 | ) | — | 255 | (255 | ) | 108 | 216 | |||||||||||||||||||||
|
|
|
|
|
|
|
|
|
|
|
|
|
|
|
|
|
|||||||||||||||||
| End of period assets |
$ | 2,865 | $ | 2,867 | $ | 2,501 | $ | 2,407 | $ | 2,964 | $ | 2,846 | $ | 2,896 | $ | 3,732 | ||||||||||||||||
|
|
|
|
|
|
|
|
|
|
|
|
|
|
|
|
|
|||||||||||||||||
| Average assets during the period |
$ | 2,463 | $ | 2,854 | $ | 2,722 | $ | 2,496 | $ | 2,680 | $ | 2,853 | $ | 2,859 | $ | 3,022 | ||||||||||||||||
| Emerging Markets Equity ETFs (in millions) |
||||||||||||||||||||||||||||||||
| Beginning of period assets |
$ | 3,780 | $ | 3,759 | $ | 3,988 | $ | 3,230 | $ | 3,613 | $ | 5,594 | $ | 5,430 | $ | 6,542 | ||||||||||||||||
| Inflows/(outflows) |
59 | 344 | 102 | 418 | 1,398 | 462 | 736 | 515 | ||||||||||||||||||||||||
| Market appreciation/(depreciation) |
(80 | ) | (115 | ) | (860 | ) | (35 | ) | 583 | (626 | ) | 376 | 275 | |||||||||||||||||||
|
|
|
|
|
|
|
|
|
|
|
|
|
|
|
|
|
|||||||||||||||||
| End of period assets |
$ | 3,759 | $ | 3,988 | $ | 3,230 | $ | 3,613 | $ | 5,594 | $ | 5,430 | $ | 6,542 | $ | 7,332 | ||||||||||||||||
|
|
|
|
|
|
|
|
|
|
|
|
|
|
|
|
|
|||||||||||||||||
| Average assets during the period |
$ | 3,618 | $ | 3,863 | $ | 3,719 | $ | 3,456 | $ | 4,780 | $ | 5,398 | $ | 5,915 | $ | 6,767 | ||||||||||||||||
| U.S. Equity ETFs (in millions) |
||||||||||||||||||||||||||||||||
| Beginning of period assets |
$ | 2,057 | $ | 2,218 | $ | 2,612 | $ | 2,523 | $ | 3,429 | $ | 4,275 | $ | 4,094 | $ | 4,640 | ||||||||||||||||
| Inflows/(outflows) |
53 | 374 | 241 | 586 | 565 | (113 | ) | 363 | (205 | ) | ||||||||||||||||||||||
| Market appreciation/(depreciation) |
108 | 20 | (330 | ) | 320 | 281 | (68 | ) | 183 | (64 | ) | |||||||||||||||||||||
|
|
|
|
|
|
|
|
|
|
|
|
|
|
|
|
|
|||||||||||||||||
| End of period assets |
$ | 2,218 | $ | 2,612 | $ | 2,523 | $ | 3,429 | $ | 4,275 | $ | 4,094 | $ | 4,640 | $ | 4,371 | ||||||||||||||||
|
|
|
|
|
|
|
|
|
|
|
|
|
|
|
|
|
|||||||||||||||||
| Average assets during the period |
$ | 2,164 | $ | 2,364 | $ | 2,528 | $ | 2,973 | $ | 3,990 | $ | 4,101 | $ | 4,393 | $ | 4,522 | ||||||||||||||||
| Currency ETFs (in millions) |
||||||||||||||||||||||||||||||||
| Beginning of period assets |
$ | 1,179 | $ | 1,467 | $ | 1,896 | $ | 1,194 | $ | 950 | $ | 881 | $ | 769 | $ | 654 | ||||||||||||||||
| Inflows/(outflows) |
271 | 383 | (566 | ) | (157 | ) | (104 | ) | (82 | ) | (129 | ) | (37 | ) | ||||||||||||||||||
| Market appreciation/(depreciation) |
17 | 46 | (136 | ) | (56 | ) | 35 | (30 | ) | 14 | (6 | ) | ||||||||||||||||||||
| Reclass to Fixed Income |
(31 | ) | ||||||||||||||||||||||||||||||
|
|
|
|
|
|
|
|
|
|
|
|
|
|
|
|
|
|||||||||||||||||
| End of period assets |
$ | 1,467 | $ | 1,896 | $ | 1,194 | $ | 950 | $ | 881 | $ | 769 | $ | 654 | $ | 611 | ||||||||||||||||
|
|
|
|
|
|
|
|
|
|
|
|
|
|
|
|
|
|||||||||||||||||
| Average assets during the period |
$ | 1,335 | $ | 1,677 | $ | 1,786 | $ | 1,120 | $ | 935 | $ | 828 | $ | 694 | $ | 632 | ||||||||||||||||
| International Fixed Income ETFs (in millions) |
||||||||||||||||||||||||||||||||
| Beginning of period assets |
$ | 564 | $ | 902 | $ | 1,379 | $ | 1,493 | $ | 1,506 | $ | 1,735 | $ | 1,698 | $ | 1,904 | ||||||||||||||||
| Inflows/(outflows) |
335 | 442 | 280 | (34 | ) | 161 | (8 | ) | 148 | 190 | ||||||||||||||||||||||
| Market appreciation/(depreciation) |
3 | 35 | (166 | ) | 16 | 68 | (29 | ) | 58 | 24 | ||||||||||||||||||||||
| Reclass from Currency |
31 | |||||||||||||||||||||||||||||||
|
|
|
|
|
|
|
|
|
|
|
|
|
|
|
|
|
|||||||||||||||||
| End of period assets |
$ | 902 | $ | 1,379 | $ | 1,493 | $ | 1,506 | $ | 1,735 | $ | 1,698 | $ | 1,904 | $ | 2,118 | ||||||||||||||||
|
|
|
|
|
|
|
|
|
|
|
|
|
|
|
|
|
|||||||||||||||||
| Average assets during the period |
$ | 679 | $ | 1,195 | $ | 1,780 | $ | 1,536 | $ | 1,627 | $ | 1,716 | $ | 1,749 | $ | 1,990 | ||||||||||||||||
| Alternative Strategy ETFs (in millions) |
||||||||||||||||||||||||||||||||
| Beginning of period assets |
$ | 0 | $ | 73 | $ | 192 | $ | 243 | $ | 277 | $ | 242 | $ | 167 | $ | 147 | ||||||||||||||||
| Inflows/(outflows) |
71 | 123 | 65 | 37 | (23 | ) | (58 | ) | (24 | ) | (24 | ) | ||||||||||||||||||||
| Market appreciation/(depreciation) |
2 | (4 | ) | (14 | ) | (3 | ) | (12 | ) | (17 | ) | 4 | (1 | ) | ||||||||||||||||||
|
|
|
|
|
|
|
|
|
|
|
|
|
|
|
|
|
|||||||||||||||||
| End of period assets |
$ | 73 | $ | 192 | $ | 243 | $ | 277 | $ | 242 | $ | 167 | $ | 147 | $ | 122 | ||||||||||||||||
|
|
|
|
|
|
|
|
|
|
|
|
|
|
|
|
|
|||||||||||||||||
| Average assets during the period |
$ | 35 | $ | 109 | $ | 227 | $ | 255 | $ | 253 | $ | 220 | $ | 159 | $ | 135 | ||||||||||||||||
| Average ETF Asset Mix (during the period) |
||||||||||||||||||||||||||||||||
| Emerging Markets Equity ETFs |
35 | % | 32 | % | 29 | % | 29 | % | 33 | % | 36 | % | 38 | % | 39 | % | ||||||||||||||||
| International Developed Equity ETFs |
24 | % | 23 | % | 22 | % | 21 | % | 19 | % | 19 | % | 18 | % | 18 | % | ||||||||||||||||
| U.S. Equity ETFs |
21 | % | 20 | % | 20 | % | 25 | % | 28 | % | 27 | % | 28 | % | 26 | % | ||||||||||||||||
| Currency ETFs |
13 | % | 14 | % | 14 | % | 10 | % | 7 | % | 6 | % | 4 | % | 4 | % | ||||||||||||||||
| International Fixed Income ETFs |
7 | % | 10 | % | 14 | % | 13 | % | 12 | % | 11 | % | 11 | % | 12 | % | ||||||||||||||||
| Alternative Strategy ETFs |
0 | % | 1 | % | 1 | % | 2 | % | 1 | % | 1 | % | 1 | % | 1 | % | ||||||||||||||||
|
|
|
|
|
|
|
|
|
|
|
|
|
|
|
|
|
|||||||||||||||||
| Total |
100 | % | 100 | % | 100 | % | 100 | % | 100 | % | 100 | % | 100 | % | 100 | % | ||||||||||||||||
|
|
|
|
|
|
|
|
|
|
|
|
|
|
|
|
|
|||||||||||||||||
| Average ETF Advisory Fee (during the period) |
0.56 | % | 0.55 | % | 0.55 | % | 0.54 | % | 0.54 | % | 0.54 | % | 0.54 | % | 0.54 | % | ||||||||||||||||
53
| Q1/11 | Q2/11 | Q3/11 | Q4/11 | Q1/12 | Q2/12 | Q3/12 | Q4/12 | |||||||||||||||||||||||||
| Number of ETFs (end of the period) |
||||||||||||||||||||||||||||||||
| International Developed Equity ETFs |
18 | 18 | 18 | 18 | 18 | 18 | 18 | 18 | ||||||||||||||||||||||||
| Emerging Markets Equity ETFs |
4 | 4 | 4 | 4 | 4 | 4 | 5 | 5 | ||||||||||||||||||||||||
| U.S. Equity ETFs |
12 | 12 | 12 | 12 | 12 | 12 | 12 | 11 | ||||||||||||||||||||||||
| Currency ETFs |
9 | 9 | 9 | 7 | 7 | 7 | 7 | 5 | ||||||||||||||||||||||||
| International Fixed Income ETFs |
2 | 2 | 2 | 4 | 5 | 5 | 5 | 5 | ||||||||||||||||||||||||
| Alternative Strategy ETFs |
1 | 1 | 2 | 2 | 2 | 2 | 2 | 2 | ||||||||||||||||||||||||
|
|
|
|
|
|
|
|
|
|
|
|
|
|
|
|
|
|||||||||||||||||
| Total |
46 | 46 | 47 | 47 | 48 | 48 | 49 | 46 | ||||||||||||||||||||||||
|
|
|
|
|
|
|
|
|
|
|
|
|
|
|
|
|
|||||||||||||||||
| Headcount |
61 | 61 | 64 | 65 | 64 | 66 | 70 | 70 | ||||||||||||||||||||||||
Liquidity and Capital Resources
The following table summarizes key data regarding our liquidity, capital resources and use of capital to fund our operations:
| December 31, | ||||||||
| 2012 | 2011 | |||||||
| Balance Sheet Data (in thousands): |
||||||||
| Cash and cash equivalents |
$ | 41,246 | $ | 25,630 | ||||
| Investments |
11,036 | 9,056 | ||||||
| Accounts receivable |
9,348 | 5,625 | ||||||
| Total liabilities |
(12,365 | ) | (16,714 | ) | ||||
|
|
|
|
|
|||||
| $ | 49,265 | $ | 23,597 | |||||
|
|
|
|
|
|||||
| Year Ended December 31, | ||||||||||||
| 2012 | 2011 | 2010 | ||||||||||
| Cash Flow Data (in thousands): |
||||||||||||
| Operating cash flows |
$ | 11,234 | $ | 13,692 | $ | 2,128 | ||||||
| Investing cash flows |
(2,358 | ) | (680 | ) | 628 | |||||||
| Financing cash flows |
6,740 | (1,615 | ) | 1 | ||||||||
|
|
|
|
|
|
|
|||||||
| Increase in cash and cash equivalents |
$ | 15,616 | $ | 11,397 | $ | 2,757 | ||||||
|
|
|
|
|
|
|
|||||||
Liquidity
We consider our available liquidity to be our liquid assets less our liabilities. Liquid assets consist of cash and cash equivalents, current receivables, and investments. Cash and cash equivalents include cash on hand and non-interest-bearing and interest-bearing deposits with financial institutions. Accounts receivable primarily represents advisory fees we earn from the WisdomTree ETFs which is collected by the fifth business day of the month following the month earned. Investments represent debt instruments of U.S. government and agency securities. Our liabilities consist primarily of payments owed to vendors and third parties in the normal course of business as well as accrued year end incentive compensation for employees.
Cash and cash equivalents increased $15.6 million in 2012 primarily due to $11.2 million of cash flows generated by our operating activities as a result of higher revenues from higher AUM, $4.7 million received from the exercise of stock options and $4.3 million from the sale of our common stock. We also received $7.8 million from the redemption of investment we held during the year. Partly offsetting these increases was $10.0 million used to purchase new investments.
Cash and cash equivalents increased $11.4 million in 2011 primarily due to $13.7 million of cash flows generated by our operating activities as a result of higher revenues from higher AUM offset by $2.2 million of
54
cash flows used to repurchase our common stock. We also received $7.5 million from the redemption of investment we held during the year. Partly offsetting these increases was $8.1 million net proceeds used to purchase new investments.
Cash and cash equivalents increased $2.8 million in 2010 primarily due to $2.1 million of cash flows generated by our operating activities due to higher revenues from higher assets under management as well as proceeds from net redemptions of our investments. We also received $7.7 million from the redemption of investment we held during the year. Partly offsetting these increases was $6.9 million used to purchase new investments.
Capital Resources
Currently, our principal source of financing is our operating cash flow, though historically, our principal source of financing was through the private placement of our common stock. We believe that current cash flows generated by our operating activities and the net proceeds raised through our offering in February 2012 should be sufficient for us to fund our operations for at least the next 12 months.
Use of Capital
Our business does not require us to maintain a significant cash position. We expect that our main uses of cash will be to fund the ongoing operations of our business, invest in strategic growth initiatives, re-acquire shares of our common stock issued to our employees as incentive compensation as discussed below or expand our business through strategic acquisitions.
In 2011, we repurchased approximately 386,396 shares from our employees at then current market prices at a cost of $2.2 million and in 2012, we repurchased approximately 357,123 shares from our employees at then current market prices at a cost of $2.3 million in connection with tax withholding upon vesting of restricted stock. The amount repurchased represented the required amount of tax withholding. We expect to continue purchasing shares for similar reasons.
Contractual Obligations
The following table summarizes our future cash payments associated with contractual obligations as of December 31, 2012.
| Total | Payments Due by Period | |||||||||||||||||||
| (in thousands) | ||||||||||||||||||||
| Less than 1 year |
1 to 3 years | 3 to 5 years | More than 5 years |
|||||||||||||||||
| Operating leases |
$ | 1,587 | $ | 1,391 | $ | 196 | — | — | ||||||||||||
Off-Balance Sheet Arrangements
Other than operating leases, which are included in the table above, we do not have any off-balance sheet financing or other arrangements. We have neither created nor are party to any special-purpose or off-balance sheet entities for the purpose of raising capital, incurring debt or operating our business.
Critical Accounting Policies
Stock-Based Compensation
Stock-based compensation expense reflects the fair value of stock-based awards measured at grant date and is recognized over the relevant service period. The fair value of each option award is estimated on the date of
55
grant using the Black-Scholes option valuation model. The Black-Scholes option valuation model we use includes the input of certain variables that are dependent on future expectations, including the expected lives of our options from grant date to exercise date, the volatility of our underlying common shares in the market over that time period, the rate of dividends that we may pay during that time and an appropriate risk-free interest rate. Many of these assumptions require management’s judgment. If actual experience differs significantly from these estimates, stock-based compensation expense and our results of operations could be materially affected.
Income and Deferred Taxes
We recognize an asset or liability for the deferred tax consequences of temporary differences between the tax basis of assets and liabilities and their reported amounts in the financial statements. These temporary differences will result in taxable or deductible amounts in future years when the reported amounts of assets are recovered or liabilities are settled. A valuation allowance is recorded to reduce the carrying values of deferred tax assets and liabilities to the amount that is more likely than not to be realized. As of December 31, 2011, we have net operating loss carry forwards and we have recognized a deferred tax asset for such carry forwards. Given the significant losses we have incurred since we began our operations, a valuation allowance has been recorded for the full amount of the deferred tax asset.
Recently Issued Accounting Pronouncements
In May 2011, FASB issued ASU No. 2011-04 “Amendments to Achieve Common Fair Value Measurement and Disclosure Requirements in U.S. GAAP and International Financial Reporting Standards (“IFRS”).” ASU No. 2011-04 includes common requirements for measurement of and disclosure about fair value between U.S. GAAP and IFRS. ASU No. 2011-04 requires reporting entities to disclose the following information for fair value measurements categorized within Level 3 of the fair value hierarchy: quantitative information about the unobservable inputs used in the fair value measurement, the valuation processes used by the reporting entity and a narrative description of the sensitivity of the fair value measurement to changes in unobservable inputs and the interrelationships between those unobservable inputs. In addition, ASU No. 2011-04 requires reporting entities to make disclosures about amounts and reasons for all transfers in and out of Level 1 and Level 2 fair value measurements, which is effective for fiscal years beginning after December 15, 2011. This standard did not have a material impact on our consolidated financial statements.
| ITEM 7A. | QUANTITATIVE AND QUALITATIVE DISCLOSURES ABOUT MARKET RISK |
In the normal course of business, our financial results are subject to market risk. Market risk to us generally represents the risk of changes in the value of financial instruments held in the portfolios of the WisdomTree ETFs that generally results from fluctuations in equity prices, foreign currency exchange rates against the U.S. dollar, and interest rates. Nearly all of our revenue is derived from advisory agreements for the WisdomTree ETFs.
Under these agreements, the advisory fee we receive is based on the market value of the assets in the WisdomTree ETF portfolios we manage.
Fluctuations in the value of these securities are common and are generated by numerous factors such as market volatility, the overall economy, inflation, changes in investor strategies, availability of alternative investment vehicles, government regulations and others. Accordingly changes in any one or a combination of these factors may reduce the value of investment securities and, in turn, the underlying assets under management on which our revenues are earned. These declines may cause investors to withdraw funds from our ETFs in favor of investments that they perceive as offering greater opportunity or lower risk, thereby compounding the impact on our revenues. Beginning in the second half of 2008 and into 2009, global equity markets experienced unprecedented volatility which caused significant declines in our assets under management and revenues during the quarters in that time period. Challenging and volatile market conditions might continue to be present in the foreseeable future.
56
In order to maximize yields, we invest our corporate cash in short-term interest earning assets, primarily money market instruments at a commercial bank and U.S. government and agency debt instruments which totaled $9.1 million and $11.0 million as of December 31, 2011 and 2012, respectively. We do not anticipate that changes in interest rates will have a material impact on our financial condition, operating results or cash flows.
| ITEM 8. | CONSOLIDATED FINANCIAL STATEMENTS AND SUPPLEMENTARY DATA |
The report of the independent registered public accounting firm and financial statements listed in the accompanying index are included in Item 15 of this Annual Report on Form 10-K. See Index to the consolidated financial statements on page F-1 of this Annual Report on Form 10-K.
| ITEM 9. | CHANGES IN AND DISAGREEMENTS WITH ACCOUNTANTS ON ACCOUNTING AND FINANCIAL DISCLOSURE |
None.
| ITEM 9A. | CONTROLS AND PROCEDURES |
Evaluation of Disclosure Controls and Procedures
As of December 31, 2012, our management, with the participation of our Chief Executive Officer and our Executive Vice President—Finance and Chief Financial Officer, evaluated the effectiveness of our disclosure controls and procedures pursuant to Rule 13a-15(b) promulgated under the Securities Exchange Act of 1934, as amended, or the “Exchange Act”. Based upon that evaluation, our Chief Executive Officer and our Executive Vice President—Finance and Chief Financial Officer concluded that, as of December 31, 2012, our disclosure controls and procedures were effective at a reasonable assurance level in ensuring that material information required to be disclosed by us in the reports that we file or submit under the Exchange Act is recorded, processed, summarized and reported within the time periods specified in the rules, regulations and forms of the Securities and Exchange Commission, or the SEC, including ensuring that such material information is accumulated by and communicated to our management, including our Chief Executive Officer and our Executive Vice President—Finance and Chief Financial Officer, as appropriate to allow timely decisions regarding required disclosure.
Changes in Internal Control Over Financial Reporting
During the quarter ended December 31, 2012, there were no changes in our internal control over financial reporting that have materially affected, or are reasonably likely to materially affect, our internal control over financial reporting.
Report of Management on Internal Control over Financial Reporting
Our management is responsible for establishing and maintaining adequate internal control over financial reporting, as defined in Rules 13a-15(f) and 15d-15(f) under the Exchange Act. In order to evaluate the effectiveness of internal control over financial reporting, management has conducted an assessment, including testing, using the criteria in Internal Control—Integrated Framework, issued by the Committee of Sponsoring Organizations of the Treadway Commission (COSO). Our system of internal control over financial reporting is designed to provide reasonable assurance regarding the reliability of financial reporting and the preparation of financial statements for external purposes in accordance with generally accepted accounting principles. Our internal control over financial reporting includes those policies and procedures that (i) pertain to the maintenance of records that, in reasonable detail, accurately and fairly reflect the transactions and dispositions of our company’s assets; (ii) provide reasonable assurance that transactions are recorded as necessary to permit preparation of financial statements in accordance with generally accepted accounting principles, and that receipts and expenditures of our company are being made only in accordance with authorizations of management and
57
directors of the Company; and (iii) provide reasonable assurance regarding prevention or timely detection of unauthorized acquisition, use, or disposition of our company’s assets that could have a material effect on the financial statements.
Because of its inherent limitations, internal control over financial reporting may not prevent or detect misstatements. Also, projections of any evaluation of effectiveness to future periods are subject to the risk that controls may become inadequate because of changes in conditions, or that the degree of compliance with the policies or procedures may deteriorate.
Based on the assessment, management has concluded that our company maintained effective internal control over financial reporting as of December 31, 2012, based on criteria in Internal Control—Integrated Framework issued by the COSO.
The effectiveness of the Company’s internal control over financial reporting as of December 31, 2012 has been audited by Ernst & Young LLP, an independent registered public accounting firm, [as stated in their report, which is included herein.]
| ITEM 9B. | OTHER INFORMATION |
None.
58
| ITEM 10. | DIRECTORS, EXECUTIVE OFFICERS AND CORPORATE GOVERNANCE |
The information required by Item 401 of Regulation S-K regarding directors and officers will be contained in our definitive proxy statement to be filed pursuant to Regulation 14A for the 2013 Annual Meeting of our stockholders, expected to be filed within 120 days of our fiscal year end, or in an amendment to this Form 10-K, and is incorporated herein by reference.
The information required by Item 405 of Regulation S-K will be contained in our definitive proxy statement or in an amendment to this Form 10-K, and is incorporated herein by reference.
We have adopted a Code of Conduct that applies to all of our directors, officers and employees, including our principal executive officer, principal financial officer and principal accounting officer. The Code of Conduct is posted on our website at http://ir.wisdomtree.com/governance.cfm.
We will post any amendments to, or waivers from, a provision of this Code of Conduct by posting such information on our website, at the address and location specified above.
The information required by Item 407(c)(3), (d)(4) and (d)(5) of Regulation S-K will be contained in our definitive proxy statement or in an amendment to this Form 10-K, and is incorporated herein by reference.
| ITEM 11. | EXECUTIVE COMPENSATION |
The information required by Item 402 and Item 407(e)(4) and (e)(5) of Regulation S-K will be contained in our definitive proxy statement or in an amendment to this Form 10-K, and is incorporated herein by reference.
| ITEM 12. | SECURITY OWNERSHP OF CERTAIN BENEFICIAL OWNERS AND MANAGEMENT AND RELATED STOCKHOLDER MATTERS |
The information required by Item 201(d) and Item 403 of Regulation S-K will be contained in our definitive proxy statement or in an amendment to this Form 10-K, and is incorporated herein by reference.
| ITEM 13. | CERTAIN RELATIONSHIPS AND RELATED TRANSACTIONS, AND DIRECTOR INDEPENDENCE |
The information required by Item 404 and Item 407(a) of Regulation S-K will be contained in our definitive proxy statement or in an amendment to this Form 10-K, and is incorporated herein by reference.
| ITEM 14. | PRINCIPAL ACCOUNTANT FEES AND SERVICES |
The information required by Item 9(e) of Schedule 14A will be contained in our definitive proxy statement or in an amendment to this Form 10-K, and is incorporated herein by reference.
59
| ITEM 15. | EXHIBITS; FINANCIAL STATEMENT SCHEDULES |
(a). The following are filed as part of this Annual Report on Form 10-K:
| 1. | Consolidated Financial Statements: The consolidated financial statements and report of independent registered public accounting firm required by this item are included beginning on page F-1. |
| 2. | Financial Statement Schedules: None. |
All other schedules are omitted because they are not applicable or not required, or because the required information is shown either in the consolidated financial statements or in the notes thereto.
(b). Exhibits: The attached list of exhibits in the “Exhibit Index” immediately preceding the exhibits to this annual report is incorporated herein by reference in response to this item.
60
Pursuant to the requirements of the Section 13 or 15(d) Securities Exchange Act of 1934, the Registrant has duly caused this report to be signed on its behalf by the undersigned hereunto duly authorized.
| WISDOMTREE INVESTMENTS, INC. | ||||||||
| By: | /s/ JONATHAN L. STEINBERG | |||||||
| Jonathan L. Steinberg | ||||||||
| March 15, 2013 | Chief Executive Officer and Director | |||||||
Pursuant to the requirements of the Securities Exchange Act of 1934, this report has been signed below by the following persons on behalf of the registrant and in the capacities indicated below on the 15th day of March, 2013.
| Signature |
Title |
|||
| /s/ JONATHAN L. STEINBERG Jonathan L. Steinberg |
President, Chief Executive Officer and Director (Principal Executive Officer) |
|||
| /s/ AMIT MUNI Amit Muni |
Executive Vice President—Finance and Chief Financial Officer (Principal Financial and Accounting Officer) |
|||
| /s/ BRUCE I. LAVINE Bruce I. Lavine |
Vice Chairman and |
|||
| /s/ MICHAEL STEINHARDT Michael Steinhardt |
Non-Executive Chairman of the Board |
|||
| /s/ STEVEN L. BEGLEITER Steven L. Begleiter |
Director |
|||
| /s/ ANTHONY BOSSONE Anthony Bossone |
Director |
|||
| /s/ R. JARRETT LILIEN R. Jarrett Lilien |
Director |
|||
| /s/ JAMES D. ROBINSON, IV James D. Robinson, IV |
Director |
|||
| /s/ FRANK SALERNO Frank Salerno |
Director |
|||
61
WISDOMTREE INVESTMENTS, INC.
INDEX TO CONSOLIDATED FINANCIAL STATEMENTS
F-1
Report of Independent Registered Public Accounting Firm
The Board of Directors and Stockholders of
WisdomTree Investments, Inc. and Subsidiaries
We have audited the accompanying consolidated balance sheets of WisdomTree Investments, Inc. and Subsidiaries as of December 31, 2012 and 2011, and the related consolidated statements of operations, stockholders’ equity and cash flows for each of the three years in the period ended December 31, 2012. These financial statements are the responsibility of the Company’s management. Our responsibility is to express an opinion on these financial statements based on our audits.
We conducted our audits in accordance with the standards of the Public Company Accounting Oversight Board (United States). Those standards require that we plan and perform the audit to obtain reasonable assurance about whether the financial statements are free of material misstatement. An audit includes examining, on a test basis, evidence supporting the amounts and disclosures in the financial statements. An audit also includes assessing the accounting principles used and significant estimates made by management, as well as evaluating the overall financial statement presentation. We believe that our audits provide a reasonable basis for our opinion.
In our opinion, the financial statements referred to above present fairly, in all material respects, the consolidated financial position of WisdomTree Investments, Inc. and Subsidiaries at December 31, 2012 and 2011, and the consolidated results of their operations and their cash flows for each of the three years in the period ended December 31, 2012, in conformity with U.S. generally accepted accounting principles.
We also have audited, in accordance with the standards of the Public Company Accounting Oversight Board (United States), WisdomTree Investments, Inc. and Subsidiaries’ internal control over financial reporting as of December 31, 2012, based on criteria established in Internal Control-Integrated Framework issued by the Committee of Sponsoring Organizations of the Treadway Commission and our report dated March 15, 2013 expressed an unqualified opinion thereon.
/s/ Ernst & Young LLP
New York, NY
March 15, 2013
F-2
Report of Independent Registered Public Accounting Firm
The Board of Directors and Stockholders of WisdomTree Investments, Inc. and Subsidiaries
We have audited WisdomTree Investments, Inc. and Subsidiaries’ internal control over financial reporting as of December 31, 2012 based on criteria established in Internal Control—Integrated Framework issued by the Committee of Sponsoring Organizations of the Treadway Commission (the COSO criteria). WisdomTree Investments, Inc. and Subsidiaries’ management is responsible for maintaining effective internal control over financial reporting, and for its assessment of the effectiveness of internal control over financial reporting included in the accompanying Report of Management on Internal Control over Financial Reporting. Our responsibility is to express an opinion on the company’s internal control over financial reporting based on our audit.
We conducted our audit in accordance with the standards of the Public Company Accounting Oversight Board (United States). Those standards require that we plan and perform the audit to obtain reasonable assurance about whether effective internal control over financial reporting was maintained in all material respects. Our audit included obtaining an understanding of internal control over financial reporting, assessing the risk that a material weakness exists, testing and evaluating the design and operating effectiveness of internal control based on the assessed risk, and performing such other procedures as we considered necessary in the circumstances. We believe that our audit provides a reasonable basis for our opinion.
A company’s internal control over financial reporting is a process designed to provide reasonable assurance regarding the reliability of financial reporting and the preparation of financial statements for external purposes in accordance with generally accepted accounting principles. A company’s internal control over financial reporting includes those policies and procedures that (1) pertain to the maintenance of records that, in reasonable detail, accurately and fairly reflect the transactions and dispositions of the assets of the company; (2) provide reasonable assurance that transactions are recorded as necessary to permit preparation of financial statements in accordance with generally accepted accounting principles, and that receipts and expenditures of the company are being made only in accordance with authorizations of management and directors of the company; and (3) provide reasonable assurance regarding prevention or timely detection of unauthorized acquisition, use, or disposition of the company’s assets that could have a material effect on the financial statements.
Because of its inherent limitations, internal control over financial reporting may not prevent or detect misstatements. Also, projections of any evaluation of effectiveness to future periods are subject to the risk that controls may become inadequate because of changes in conditions, or that the degree of compliance with the policies or procedures may deteriorate.
In our opinion, WisdomTree Investments, Inc. and Subsidiaries maintained, in all material respects, effective internal control over financial reporting as of December 31, 2012, based on the COSO criteria.
We also have audited, in accordance with the standards of the Public Company Accounting Oversight Board (United States), the consolidated balance sheets of WisdomTree Investments, Inc. and Subsidiaries as of December 31, 2012 and 2011, and the related consolidated statements of operations, stockholders’ equity, and cash flows for each of the three years in the period ended December 31, 2012 of WisdomTree Investments, Inc. and Subsidiaries and our report dated March 15, 2013 expressed an unqualified opinion thereon.
/s/ Ernst & Young LLP
New York, NY
March 15, 2013
F-3
WisdomTree Investments, Inc. and Subsidiaries
(In Thousands, Except Per Share Amounts)
| December 31, | ||||||||
| 2012 | 2011 | |||||||
| Assets |
||||||||
| Current assets: |
||||||||
| Cash and cash equivalents |
$ | 41,246 | $ | 25,630 | ||||
| Accounts receivable |
9,348 | 5,625 | ||||||
| Other current assets |
1,273 | 1,601 | ||||||
|
|
|
|
|
|||||
| Total current assets |
51,867 | 32,856 | ||||||
| Fixed assets, net |
480 | 597 | ||||||
| Investments |
11,036 | 9,056 | ||||||
| Other noncurrent assets |
42 | 58 | ||||||
|
|
|
|
|
|||||
| Total assets |
$ | 63,425 | $ | 42,567 | ||||
|
|
|
|
|
|||||
| Liabilities and stockholders’ equity |
||||||||
| Liabilities: |
||||||||
| Current liabilities: |
||||||||
| Fund management and administration payable |
$ | 6,924 | $ | 10,035 | ||||
| Compensation and benefits payable |
2,156 | 4,168 | ||||||
| Accounts payable and other liabilities |
3,272 | 2,360 | ||||||
|
|
|
|
|
|||||
| Total current liabilities |
12,352 | 16,563 | ||||||
| Other noncurrent liabilities |
13 | 151 | ||||||
|
|
|
|
|
|||||
| Total liabilities |
12,365 | 16,714 | ||||||
|
|
|
|
|
|||||
| Stockholders’ equity: |
||||||||
| Preferred stock, par value $0.01; 2,000 shares authorized: |
— | — | ||||||
| Common stock, par value $0.01; 250,000 shares authorized; issued: 126,554 and 116,703; outstanding: 125,272 and 115,392 |
1,265 | 1,167 | ||||||
| Additional paid-in capital |
177,826 | 163,747 | ||||||
| Accumulated deficit |
(128,031 | ) | (139,061 | ) | ||||
|
|
|
|
|
|||||
| Total stockholders’ equity |
51,060 | 25,853 | ||||||
|
|
|
|
|
|||||
| Total liabilities and stockholders’ equity |
$ | 63,425 | $ | 42,567 | ||||
|
|
|
|
|
|||||
The accompanying notes are an integral part of these consolidated financial statements
F-4
WisdomTree Investments, Inc. and Subsidiaries
Consolidated Statements of Operations
(In Thousands, Except Per Share Amounts)
| Year Ended December 31, | ||||||||||||
| 2012 | 2011 | 2010 | ||||||||||
| Revenues: |
||||||||||||
| ETF advisory fees |
$ | 84,024 | $ | 64,366 | $ | 40,567 | ||||||
| Other income |
774 | 794 | 1,045 | |||||||||
|
|
|
|
|
|
|
|||||||
| Total revenues |
84,798 | 65,160 | 41,612 | |||||||||
| Expenses: |
||||||||||||
| Compensation and benefits |
23,233 | 19,634 | 19,193 | |||||||||
| Fund management and administration |
23,020 | 19,882 | 14,286 | |||||||||
| Marketing and advertising |
5,363 | 4,475 | 3,721 | |||||||||
| Sales and business development |
3,586 | 3,603 | 2,730 | |||||||||
| Professional and consulting fees |
4,603 | 4,307 | 3,779 | |||||||||
| Occupancy, communications, and equipment |
1,419 | 1,127 | 1,118 | |||||||||
| Depreciation and amortization |
307 | 267 | 314 | |||||||||
| Third-party sharing arrangements |
5,468 | 5,651 | 2,296 | |||||||||
| Other |
2,976 | 2,243 | 1,724 | |||||||||
| ETF shareholders proxy |
3,264 | — | — | |||||||||
| Litigation, net |
176 | 150 | — | |||||||||
| Exchange listing and offering |
353 | 729 | — | |||||||||
|
|
|
|
|
|
|
|||||||
| Total expenses |
73,768 | 62,068 | 49,161 | |||||||||
|
|
|
|
|
|
|
|||||||
| Income/(loss) before provision for income taxes |
11,030 | 3,092 | (7,549 | ) | ||||||||
| Provision for income taxes |
— | — | — | |||||||||
|
|
|
|
|
|
|
|||||||
| Net income/(loss) |
$ | 11,030 | $ | 3,092 | $ | (7,549 | ) | |||||
|
|
|
|
|
|
|
|||||||
| Net income/(loss) per share—basic |
$ | 0.09 | $ | 0.03 | $ | (0.07 | ) | |||||
|
|
|
|
|
|
|
|||||||
| Net income/(loss) per share—diluted |
$ | 0.08 | $ | 0.02 | $ | (0.07 | ) | |||||
|
|
|
|
|
|
|
|||||||
| Weighted-average common shares—basic |
122,138 | 114,132 | 111,981 | |||||||||
|
|
|
|
|
|
|
|||||||
| Weighted-average common shares—diluted |
137,968 | 135,539 | 111,981 | |||||||||
|
|
|
|
|
|
|
|||||||
The accompanying notes are an integral part of these consolidated financial statements
F-5
WisdomTree Investments, Inc. and Subsidiaries
Consolidated Statements of Stockholders’ Equity
(In Thousands)
| Common Stock | Additional Paid-In Capital |
Accumulated Deficit |
Total | |||||||||||||||||
| Shares Issued |
Par Value |
|||||||||||||||||||
| Balance—January 1, 2010 |
114,535 | $ | 1,145 | $ | 149,487 | $ | (134,604 | ) | $ | 16,028 | ||||||||||
| Restricted stock issued, net |
501 | 5 | (5 | ) | — | — | ||||||||||||||
| Exercise of stock options, net |
235 | 2 | (1 | ) | — | 1 | ||||||||||||||
| Stock issued for services |
20 | — | 29 | — | 29 | |||||||||||||||
| Stock-based compensation |
— | — | 8,726 | — | 8,726 | |||||||||||||||
| Net loss |
— | — | — | (7,549 | ) | (7,549 | ) | |||||||||||||
|
|
|
|
|
|
|
|
|
|
|
|||||||||||
| Balance—December 31, 2010 |
115,291 | 1,152 | 158,236 | (142,153 | ) | 17,235 | ||||||||||||||
| Restricted stock issued, net |
535 | 5 | (5 | ) | — | — | ||||||||||||||
| Shares repurchased |
(386 | ) | (3 | ) | (2,150 | ) | — | (2,153 | ) | |||||||||||
| Exercise of stock options, net |
1,243 | 13 | 525 | — | 538 | |||||||||||||||
| Stock issued for services |
20 | — | 127 | — | 127 | |||||||||||||||
| Stock-based compensation |
— | — | 7,014 | — | 7,014 | |||||||||||||||
| Net income |
— | — | — | 3,092 | 3,092 | |||||||||||||||
|
|
|
|
|
|
|
|
|
|
|
|||||||||||
| Balance—December 31, 2011 |
116,703 | 1,167 | 163,747 | (139,061 | ) | 25,853 | ||||||||||||||
| Net proceeds from sale of common stock |
1,000 | 10 | 4,319 | — | 4,329 | |||||||||||||||
| Restricted stock issued, net |
1,179 | 12 | (12 | ) | — | — | ||||||||||||||
| Shares repurchased |
(357 | ) | (4 | ) | (2,257 | ) | — | (2,261 | ) | |||||||||||
| Exercise of stock options, net |
8,019 | 80 | 4,592 | — | 4,672 | |||||||||||||||
| Stock issued for services |
10 | — | 28 | — | 28 | |||||||||||||||
| Stock-based compensation |
— | — | 7,409 | — | 7,409 | |||||||||||||||
| Net income |
— | — | — | 11,030 | 11,030 | |||||||||||||||
|
|
|
|
|
|
|
|
|
|
|
|||||||||||
| Balance—December 31, 2012 |
126,554 | $ | 1,265 | $ | 177,826 | $ | (128,031 | ) | $ | 51,060 | ||||||||||
|
|
|
|
|
|
|
|
|
|
|
|||||||||||
The accompanying notes are an integral part of these consolidated financial statements
F-6
WisdomTree Investments, Inc. and Subsidiaries
Consolidated Statements of Cash Flows
(In Thousands)
| Year Ended December 31, | ||||||||||||
| 2012 | 2011 | 2010 | ||||||||||
| Cash flows from operating activities: |
||||||||||||
| Net income/(loss) |
$ | 11,030 | $ | 3,092 | $ | (7,549 | ) | |||||
| Non-cash items included in net income/(loss): |
||||||||||||
| Depreciation and amortization and other |
307 | 267 | 314 | |||||||||
| Stock-based compensation |
7,437 | 7,141 | 8,755 | |||||||||
| Deferred rent |
(140 | ) | (154 | ) | (105 | ) | ||||||
| Accretion to interest income and other |
194 | 135 | 4 | |||||||||
| Changes in operating assets and liabilities: |
||||||||||||
| Accounts receivable |
(3,723 | ) | (800 | ) | (1,941 | ) | ||||||
| Other assets |
337 | (950 | ) | 313 | ||||||||
| Fund management and administration payable |
(3,111 | ) | 4,321 | 659 | ||||||||
| Compensation and benefits payable |
(2,012 | ) | 530 | 1,051 | ||||||||
| Accounts payable and other liabilities |
915 | 110 | 627 | |||||||||
|
|
|
|
|
|
|
|||||||
| Net cash provided by operating activities |
11,234 | 13,692 | 2,128 | |||||||||
| Cash flows from investing activities: |
||||||||||||
| Purchase of fixed assets |
(190 | ) | (108 | ) | (93 | ) | ||||||
| Purchase of investments |
(10,004 | ) | (8,114 | ) | (6,935 | ) | ||||||
| Proceeds from the redemption of investments |
7,836 | 7,542 | 7,656 | |||||||||
|
|
|
|
|
|
|
|||||||
| Net cash (used in)/provided by investing activities |
(2,358 | ) | (680 | ) | 628 | |||||||
| Cash flows from financing activities: |
||||||||||||
| Net proceeds from sale of common stock |
4,329 | — | — | |||||||||
| Shares repurchased |
(2,261 | ) | (2,153 | ) | — | |||||||
| Proceeds from exercise of stock options and warrants |
4,672 | 538 | 1 | |||||||||
|
|
|
|
|
|
|
|||||||
| Net cash provided by/(used in) financing activities |
6,740 | (1,615 | ) | 1 | ||||||||
|
|
|
|
|
|
|
|||||||
| Net increase in cash and cash equivalents |
15,616 | 11,397 | 2,757 | |||||||||
| Cash and cash equivalents—beginning of year |
25,630 | 14,233 | 11,476 | |||||||||
|
|
|
|
|
|
|
|||||||
| Cash and cash equivalents—end of year |
$ | 41,246 | $ | 25,630 | $ | 14,233 | ||||||
|
|
|
|
|
|
|
|||||||
| Supplemental disclosure of cash flow information: |
||||||||||||
| Cash paid for income taxes |
$ | 33 | $ | 13 | $ | 11 | ||||||
|
|
|
|
|
|
|
|||||||
| Noncash investing and financing activities: |
||||||||||||
| Cashless exercise of stock options and warrants |
$ | — | $ | 391 | $ | 517 | ||||||
|
|
|
|
|
|
|
|||||||
The accompanying notes are an integral part of these consolidated financial statements
F-7
WisdomTree Investments, Inc. and Subsidiaries
Notes to Consolidated Financial Statements
(In Thousands, Except Share and Per Share Amounts)
1. Organization and Description of Business
WisdomTree Investments, Inc. (“WisdomTree” or the “Company”) is a New York-based exchange-traded fund sponsor and asset manager. The Company is the seventh largest sponsor of ETFs in the United States based on assets under management (“AUM”). In June 2006, the Company launched 20 ETFs and, as of December 31, 2012, had 46 ETFs with AUM of $18.3 billion. Through its operating subsidiary, the Company provides investment advisory and other management services to the WisdomTree Trust (“WTT”) and WisdomTree ETFs. The Company also licenses its indexes to third parties and promotes the use of WisdomTree ETFs in 401(k) plans. The Company has the following subsidiaries:
| • | WisdomTree Asset Management, Inc. (“WTAM”)—a wholly owned subsidiary formed in February 2005, is an investment advisor registered with the Securities and Exchange Commission (“SEC”). WTAM provides investment advisory and other management services to WTT and the WisdomTree ETFs. In exchange for providing these services, the Company receives advisory fee revenues based on a percentage of the ETFs average daily net assets under management. |
| • | WisdomTree Retirement Services, Inc. (“WTRS”)—a wholly owned subsidiary formed in August 2007, markets with selected third parties the use of WisdomTree ETFs in 401(k) plans. |
The WisdomTree ETFs are issued by WTT. WTT, a non-consolidated third-party, is a Delaware statutory trust registered with the SEC as an open-end management investment company. WTT offers ETFs across international and domestic equities, currency, fixed income and alternatives asset classes. The Company has licensed the use of its own fundamentally-weighted indexes on an exclusive basis to WTT for the WisdomTree ETFs. The Board of WTT, or the Trustees, is separate from the Board of the Company. The Trustees are primarily responsible for overseeing the management and affairs of the WisdomTree ETFs and the Trust for the benefit of the WisdomTree ETF shareholders and has contracted with the Company to provide for general management and administration services of WTT and the WisdomTree ETFs. The Company, in turn, has contracted with third parties to provide the majority of these administration services. In addition, certain officers of the Company provide general management services for WTT.
2. Significant Accounting Policies
Basis of Presentation
These consolidated financial statements have been prepared in conformity with U.S. generally accepted accounting principles (“GAAP”) and in the opinion of management reflect all adjustments, consisting of only normal recurring adjustments, necessary for a fair statement of financial condition, results of operations, and cash flows for the periods presented. The consolidated financial statements include the accounts of the Company’s wholly owned subsidiaries WTAM and WTRS. All intercompany accounts and transactions have been eliminated in consolidation. Certain accounts in the prior years’ consolidated financial statements have been reclassified to conform to the current year’s consolidated financial statements presentation. These reclassifications had no effect on the previously reported operating results.
Use of Estimates
The preparation of the Company’s consolidated financial statements in conformity with GAAP requires management to make estimates and assumptions that affect the reported amounts of assets and liabilities as of the balance sheet dates and the reported amounts of revenues and expenses for the periods presented. Actual results could differ materially from those estimates.
F-8
Revenue Recognition
The Company earns investment advisory fees for ETFs and separately managed accounts as well as licensing fees from third parties. ETF advisory fees are based on a percentage of the ETFs average daily net assets and recognized over the period the related service is provided. Fees for separately managed accounts and licensing are based on a percentage of the average monthly net assets and recognized over the period the related service is provided.
Depreciation and Amortization
Depreciation is provided for using the straight-line method over the estimated useful lives of the related assets as follows:
| Equipment |
3 years | |||
| Furniture and fixtures |
7 years |
Leasehold improvements are amortized over the term of their respective leases or service lives of the improvements, whichever is shorter. Fixed assets are stated at cost less accumulated depreciation and amortization.
Marketing and Advertising
Advertising costs, including media advertising and production costs, are expensed when incurred.
Cash and Cash Equivalents
The Company considers all highly liquid investments with an original maturity of 90 days or less at the time of purchase to be classified as cash equivalents. Cash and cash equivalents are held with one large financial institution.
Accounts Receivable and Allowance for Doubtful Accounts
Accounts receivable are customers’ obligations due under normal trade terms. An allowance for doubtful accounts is not provided since, in the opinion of management, all accounts receivable recorded are deemed collectible.
Impairment of Long-Lived Assets
On a periodic basis, the Company performs a review for the impairment of long-lived assets when events or changes in circumstances indicate that the estimated undiscounted future cash flows expected to be generated by the assets are less than their carrying amounts or when other events occur which may indicate that the carrying amount of an asset may not be recoverable.
Earnings/(Loss) per Share
Basic earnings or loss per share is computed by dividing net income or loss available to common stockholders by the weighted-average number of common shares outstanding for the period. Diluted earnings per share reflects the potential reduction in earnings per share that could occur if options or other contracts to issue common stock were exercised or converted into common stock. Options and restricted shares to purchase shares of common stock were included in the calculation of diluted earnings per share in the years ended December 31, 2012 and 2011, but not included in the computation of diluted loss per share for the years ended December 31, 2010 , as the Company incurred losses during that year.
F-9
Investments
The Company accounts for all of its investments as held-to-maturity, which are recorded at amortized cost, which approximates fair value. For held-to-maturity investments, the Company has the intent and ability to hold investments to maturity and it is not more likely than not that the Company will be required to sell the investments before recovery of their amortized cost bases, which may be maturity.
On a periodic basis, the Company reviews its portfolio of investments for impairment. If a decline in fair value is deemed to be other-than-temporary, the security is written down to its fair value through earnings.
Subsequent Events
The Company has evaluated subsequent events after the date of the consolidated financial statements to consider whether or not the impact of such events needed to be reflected or disclosed in the consolidated financial statements. Such evaluation was performed through the issuance date of the consolidated financial statements.
Stock-Based Awards
Accounting for share-based compensation requires the measurement and recognition of compensation expense for all equity awards based on estimated fair values. The Company accounts for stock-based compensation for its employees based on the cost of employee services received in exchange for a stock-based award. Stock-based compensation is measured based on the grant-date fair value of the award and are amortized over the relevant service period.
Stock-based awards granted to non-employees for goods or services are valued at the fair value of the equity instruments issued or the fair value of consideration received, whichever is a more reliable measure of the fair value of the transaction, and recognized when performance obligations are complete.
Income Taxes
The Company accounts for income taxes using the liability method, which requires the determination of deferred tax assets and liabilities based on the differences between the financial and tax basis of assets and liabilities using the enacted tax rates in effect for the year in which differences are expected to reverse. Deferred tax assets are adjusted by a valuation allowance if, based on the weight of available evidence, it is more-likely-than-not that some portion or all of the deferred tax assets will not be realized.
In order to recognize and measure any unrecognized tax benefits, management evaluates and determines whether any of its tax positions are more-likely-than-not to be sustained upon examination, including resolution of any related appeals or litigation processes, based on the technical merits of the position. Once it is determined that a position meets this recognition threshold, the position is measured to determine the amount of benefit to be recognized in the consolidated financial statements. The Company has elected to record interest expense and penalties related to tax expenses as income tax expense.
Related-Party Transactions
The Company’s revenues are derived primarily from investment advisory agreements with WTT and WisdomTree ETFs. Under these agreements, the Company has granted WTT an exclusive license to its own indexes for operation of the WisdomTree ETFs. The Trustees are primarily responsible for overseeing the management and affairs of the WisdomTree ETFs and the Trust for the benefit of the WisdomTree ETF shareholders and has contracted with the Company to provide for general management and administration of WTT and the WisdomTree ETFs. The Company is also responsible for expenses of WTT, including the cost of
F-10
transfer agency, custody, fund administration and accounting, legal, audit, and other non-distribution services. In exchange, the Company receives fees based on a percentage of the ETF average daily net assets. The advisory agreements may be terminated by WTT upon notice. Certain officers of the Company also provide general management oversight of WTT; however, these officers have no material decision making responsibilities and primarily implement the decisions of the Trustees. At December 31, 2012, and 2011, the balance of accounts receivable from WTT was approximately $8,180 and $5,457, respectively which is included as a component of accounts receivable in the consolidated balance sheet. Revenue from advisory services provided to WTT for the years ended December 31, 2012, 2011 and 2010 was approximately $84,024, $64,366 and $40,567, respectively.
Third-Party Sharing Arrangements
Included in third party sharing arrangements expense are payments (reimbursements) from/(to) the Company with respect to (i) a collaborative arrangement and (ii) marketing agreements with third parties:
Collaborative Arrangement—In 2008, the Company entered into a mutual participation agreement with Mellon Capital Management Corporation (“Mellon Capital”) and The Dreyfus Corporation (“Dreyfus”) in which the parties agreed to collaborate in developing currency and fixed income ETFs under WTT. Under the agreement, the Company is responsible for operating the ETFs and providing sales, marketing and research support at its own cost. Mellon Capital and Dreyfus are responsible for providing sub-advisory, fund administration and accounting services for these collaborative ETFs at their own cost. Any revenues less third party costs, such as marketing, legal, accounting or fund management, related to these collaborative products are shared equally, including any losses (“net profit/(loss)”). The Company is responsible for arranging any third party costs related to this collaborative arrangement.
In October 2012, the parties agreed to end this joint venture as of December 31, 2012 and entered into a new fee arrangement effective January 1, 2013.
The Company has determined it is the principal participant for transactions under this collaborative arrangement and as such, records these transactions on a gross basis reflecting all of the revenues and third party expenses on its consolidated financial statements in accordance with the nature of the revenue or expense. Any net profit/(loss) payments are reflected in Third-Party Sharing Arrangements expense on the consolidated financial statements.
Revenues and expenses under this collaborative arrangement included in the Company’s consolidated financial statements are as follows:
| Year Ended December 31, | ||||||||||||
| 2012 | 2011 | 2010 | ||||||||||
| ETF advisory fee revenue |
$ | 10,968 | $ | 12,596 | $ | 6,578 | ||||||
| Expenses: |
||||||||||||
| Fund management and administration |
1,341 | 1,712 | 1,057 | |||||||||
| Marketing and advertising |
39 | 406 | 809 | |||||||||
| Sales and business development |
24 | 159 | 196 | |||||||||
| Other |
— | 1 | 4 | |||||||||
|
|
|
|
|
|
|
|||||||
| Third party expenses |
1,404 | 2,278 | 2,066 | |||||||||
| Net profit |
9,564 | 10,318 | 4,512 | |||||||||
| Sharing |
$ | 4,662 | $ | 5,114 | $ | 2,256 | ||||||
Marketing agreements—In 2010, the Company entered into agreements with certain firms to serve as the external marketing agents for the WisdomTree ETFs. Under these agreements, the Company will pay a percentage of their advisory fee revenue, subject to caps, to the marketing agents based on incremental growth in assets under management. The Company incurred marketing fees of $806, $537 and $40 for the year ended December 31, 2012, 2011 and 2010 respectively.
F-11
Segment, Geographic and Customer Information
The Company operates as one business segment, as an ETF sponsor and asset manager providing investment advisory services. Revenues are derived in the U.S. and all of the Company’s assets are located in the U.S.
Recently Issued Accounting Pronouncements
In May 2011, FASB issued ASU No. 2011-04 “Amendments to Achieve Common Fair Value Measurement and Disclosure Requirements in U.S. GAAP and International Financial Reporting Standards (“IFRS”).” ASU No. 2011-04 includes common requirements for measurement of and disclosure about fair value between U.S. GAAP and IFRS. ASU No. 2011-04 requires reporting entities to disclose the following information for fair value measurements categorized within Level 3 of the fair value hierarchy: quantitative information about the unobservable inputs used in the fair value measurement, the valuation processes used by the reporting entity and a narrative description of the sensitivity of the fair value measurement to changes in unobservable inputs and the interrelationships between those unobservable inputs. In addition, ASU No. 2011-04 requires reporting entities to make disclosures about amounts and reasons for all transfers in and out of Level 1 and Level 2 fair value measurements, which is effective for fiscal years beginning after December 15, 2011. This standard did not have a material impact on our consolidated financial statements.
3. Investments and Fair Value Measurements
The following table is a summary of the Company’s investments:
| 2012 | 2011 | |||||||
| Held-to- Maturity |
Held-to- Maturity |
|||||||
| Federal agency debt instruments |
$ | 11,036 | $ | 9,056 | ||||
|
|
|
|
|
|||||
The following table summarizes unrealized gains, losses, and fair value of investments:
| 2012 | 2011 | |||||||
| Held-to- Maturity |
Held-to- Maturity |
|||||||
| Cost/amortized cost |
$ | 11,036 | $ | 9,056 | ||||
| Gross unrealized gains |
61 | 53 | ||||||
| Gross unrealized losses |
(157 | ) | (112 | ) | ||||
|
|
|
|
|
|||||
| Fair value |
$ | 10,940 | $ | 8,997 | ||||
|
|
|
|
|
|||||
The following table sets forth the maturity profile of investments:
| 2012 | 2011 | |||||||
| Held-to- Maturity |
Held-to- Maturity |
|||||||
| Due within one year |
$ | — | $ | — | ||||
| Due one year through five years |
— | 250 | ||||||
| Due five years through ten years |
727 | 1,134 | ||||||
| Due over ten years |
10,309 | 7,672 | ||||||
|
|
|
|
|
|||||
| Total |
$ | 11,036 | $ | 9,056 | ||||
|
|
|
|
|
|||||
F-12
Fair Value Measurement
Under the accounting for fair value measurements and disclosures, fair value is defined as the price that would be received to sell an asset or paid to transfer a liability, or the exit price, in an orderly transaction between market participants at the measurement date. The accounting guidance establishes a hierarchy of valuation techniques based on whether the inputs to those valuation techniques are observable or unobservable. Observable inputs reflect market data obtained from independent sources, while unobservable inputs reflect the Company’s market assumptions.
These three types of inputs create the following fair value hierarchy:
Level 1—Quoted prices for identical instruments in active markets.
Level 2—Quoted prices for similar instruments in active markets; quoted prices for identical or similar instruments in markets that are not active; and model-derived valuations whose inputs are observable or whose significant value drivers are observable.
Level 3—Instruments whose significant value drivers are unobservable.
This hierarchy requires the use of observable market data when available. The Company’s held-to-maturity securities are categorized as Level 1. The amortized cost of the held-to-maturity securities approximates fair value. The Company does not intend to sell its investments held-to maturity before the recovery of their amortized cost bases which may be at maturity.
Some of our financial instruments are not measured at fair value on a recurring basis but are recorded at amounts that approximate fair value due to their liquid or short-term nature. Such financial assets and financial liabilities are categorized as Level 3.
4. Fixed Assets
The following table summarizes fixed assets:
| December 31, | ||||||||
| 2012 | 2011 | |||||||
| Equipment |
$ | 786 | $ | 669 | ||||
| Furniture and fixtures |
308 | 244 | ||||||
| Leasehold improvements |
1,062 | 1,053 | ||||||
| Less accumulated depreciation and amortization |
(1,676 | ) | (1,369 | ) | ||||
|
|
|
|
|
|||||
| Total |
$ | 480 | $ | 597 | ||||
|
|
|
|
|
|||||
5. Commitments and Contingencies
Contractual Obligations
The Company has entered into obligations under operating leases with initial non-cancelable terms in excess of one year for office space, telephone, and data services. Expenses recorded under these agreements for the years ended December 31, 2012, 2011, and 2010 were approximately $1,338, $1,046 and $1,015, respectively.
F-13
Future minimum lease payments with respect to non-cancelable operating leases at December 31, 2012 are approximately as follows:
| 2013 |
$ | 1,391 | ||
| 2014 |
162 | |||
| 2015 |
31 | |||
| 2016 and thereafter |
3 | |||
|
|
|
|||
| Total |
$ | 1,587 | ||
|
|
|
The Company’s office lease expires in January 2014. The Company has begun the search for new office space.
Letter of Credit
The Company collateralizes its office lease space through a standby letter of credit held as an investment in debt securities, which was included in investments on the consolidated balance sheets at December 31, 2011 in the amount of $700. Pursuant to the terms of the lease agreement in 2012, the Company decreased its standby letter of credit to $419 and replaced its investments in debt securities with cash.
Contingencies
The Company is subject to various routine regulatory reviews and inspections by the SEC as well as legal proceedings arising in the ordinary course of business. The Company is not currently party to any litigation or other legal proceedings that are expected to have a material impact on our business, financial position or results of operations.
On December 1, 2011, Research Affiliates, LLC filed a complaint in the United States District Court for the Central District of California, (Research Affiliates, LLC v. WisdomTree Investments, Inc., et. al., Case No. SACV11-01846 DOC (ANx)), naming the Company and our subsidiaries, as well as WisdomTree Trust, Mellon Capital Management Corporation and ALPS Distributors, Inc., as defendants. In the complaint, plaintiff alleged that the fundamentally weighted investment methodology we employ for the ETFs using our indexes infringed three of plaintiff’s patents and sought both unspecified monetary damages to be determined and an injunction to prevent further infringement.
On November 7, 2012, Research Affiliates, LLC agreed to withdraw its patent infringement suit against the Company and the Company agreed to withdraw its counterclaims and entered into a settlement agreement. Under the settlement, all parties exchanged releases for all existing claims. The other material terms of the settlement are as follows:
| • | Research Affiliates agreed not to sue the Company for any future claims arising under any current patents held by Research Affiliates, as well as any future patents relating to fundamentally-weighted indexes and strategies that may issue under existing or future patent applications that may be filed by Research Affiliates within the next eight years, subject to reduction by up to three years if Research Affiliates is acquired. The covenant not to sue extends to the Company’s service providers and customers in connection with its products and services. |
| • | The Company has agreed not to sue Research Affiliates for any future claims arising under any current patents held the Company, as well as any future patents relating to fundamentally-weighted indexes and strategies that may issue under existing or future patent applications that may be filed by the Company within the next eight years, subject to reduction by up to three years if the Company is acquired. The covenant not to sue extends to service providers and customers of Research Affiliates in connection with Research Affiliates’ products and services. |
F-14
| • | Research Affiliates and the Company agreed that the covenants not to sue do not include a right under each party’s patents to copy the other party’s methodologies. Research Affiliates and the Company have further agreed that it is not copying if Research Affiliates introduces an index or strategy that uses at least three fundamental factors to weight its indexes and they are not predominantly dividend- or earnings weighted, or the Company introduces an index or strategy that is weighted by less than three fundamental factors. |
| • | The parties also agreed not to challenge the other party’s patents or patent applications. |
| • | Research Affiliates agreed to a one-time payment of $0.7 million to WisdomTree. WisdomTree and the other defendants were not required to make any current or future payments to Research Affiliates. |
All other terms of the settlement are confidential.
The Company’s insurance carrier funded a significant majority of the cost of defending this patent infringement lawsuit. During 2012, the Company incurred $3.4 million of legal defense and other associated costs and its insurance carrier has agreed to reimburse $2.5 million. In addition the Company received $0.7 million settlement payment from Research Affiliates leading to a net amount of $0.2 million in net costs the Company incurred for the year ended December 31, 2012. During 2011 the Company incurred $0.2 million in litigation expenses.
6. Stock-Based Awards
Stock Options
The Company grants stock options to employees, certain directors and non-employee consultants and special advisors for services. The Company has six stock option plans, which are similar in nature (collectively, referred to as the “Plans”). Under the Plans, the Company can issue a maximum of 25,000,000 shares of Common Stock pursuant to stock options and other stock-based awards and also has issued from time to time stock-based awards outside the Plans.
Options are issued generally for terms of ten years and vest between two to four years. Options are issued with an exercise price equal to the fair value of the Company on the date of grant. Options expire on dates ranging from March 16, 2014, to November 15, 2021.
In January 2009, the Company’s Compensation Committee and Board of the Directors approved a proposal to provide eligible employees an opportunity to exercise their underwater stock options in the future at an alternative lower strike price. To obtain the full benefit of the alternative strike price, employees are required to remain with the Company for an additional 4 years. Under the program, eligible employees could exercise one quarter of their stock options each year at an alternative strike price of $1.07. The alternative strike price represented a 50% premium to the Company’s thirty day volume weighted-average price on the day the program was approved. Options prices on the programs approval date ranged from $1.75 to $9.45 with a weighted-average exercise price of $4.34. The Company is recording a charge of $589 over four years which represents the excess of the fair value of eligible options using the alternative strike price over the existing strike price. For the years ended December 31, 2012, 2011 and 2010, the Company recorded $118, $138 and $140, respectively, for this program.
F-15
A summary of option activity is as follows:
| Options | Weighted- Average Exercise Price |
|||||||
| Outstanding January 1, 2010 |
21,372,959 | $ | 0.57 | |||||
| Granted |
860,000 | 2.38 | ||||||
| Forfeitures or expirations |
(336,868 | ) | 2.77 | |||||
| Exercised |
(452,474 | ) | 1.15 | |||||
|
|
|
|
|
|||||
| Outstanding at December 31, 2010 |
21,443,617 | 0.60 | ||||||
| Granted |
825,000 | 5.80 | ||||||
| Forfeitures or expirations |
(135,316 | ) | 2.04 | |||||
| Exercised |
(1,280,687 | ) | 0.64 | |||||
|
|
|
|
|
|||||
| Outstanding at December 31, 2011 |
20,852,614 | 0.79 | ||||||
| Granted |
— | 0.00 | ||||||
| Forfeitures or expirations |
(73,907 | ) | 1.75 | |||||
| Exercised |
(8,018,516 | ) | 0.58 | |||||
|
|
|
|
|
|||||
| Outstanding at December 31, 2012 |
12,760,191 | $ | 0.95 | |||||
|
|
|
|
|
|||||
In 2012, all of the 1,320,833 outstanding options awards granted to nonemployee consultants and special advisors were exercised with a weighted average exercise price of $1.34. There are no remaining option awards outstanding to non-employees at December 31, 2012. In 2011, 77,500 options were exercised with a weighted average exercise price of $2.38. For the years ended December 31, 2011 and 2010, 1,320,833 and 1,398,333 option awards granted to nonemployee consultants and special advisors are included in the table of option activity. These options had a weighted exercise price of $1.34 and $1.40, respectively.
The following table summarizes information on stock options outstanding at December 31, 2012:
| Options Outstanding | Options Exercisable | |||||||||||||||||||||||
| Range of Exercise Prices | Number Outstanding at December 31, 2012 |
Weighted- Average Remaining Contractual Life in Years |
Weighted- Average Exercise Price |
Number Exercisable at December 31, 2012 |
Weighted- Average Exercise Price |
Aggregate Intrinsic Value at December 31, 2012 |
||||||||||||||||||
| $0.03 – $0.45 |
5,901,953 | 1.5 | $ | 0.09 | 5,901,953 | $ | 0.09 | $ | 35,573 | |||||||||||||||
| $0.70 – $0.97 |
2,542,500 | 6.1 | 0.70 | 1,773,750 | 0.70 | 9,614 | ||||||||||||||||||
| $1.07 – $1.80 |
2,267,439 | 4.0 | 1.07 | 1,474,609 | 1.07 | 7,445 | ||||||||||||||||||
| $2.03 – $4.03 |
1,258,299 | 5.3 | 2.22 | 1,163,299 | 2.18 | 4,587 | ||||||||||||||||||
| $5.05 – $5.26 |
470,000 | 8.1 | 5.07 | 12,500 | 5.26 | 11 | ||||||||||||||||||
| $6.36 – $6.82 |
200,000 | 8.5 | 6.52 | 50,000 | 6.52 | — | ||||||||||||||||||
| $7.01 – $8.51 |
120,000 | 8.7 | 7.48 | 30,000 | 7.48 | — | ||||||||||||||||||
|
|
|
|
|
|
|
|
|
|
|
|
|
|||||||||||||
| 12,760,191 | 3.7 | $ | 0.95 | 10,406,111 | $ | 0.63 | $ | 57,230 | ||||||||||||||||
|
|
|
|
|
|
|
|
|
|
|
|
|
|||||||||||||
F-16
The Company estimated the fair value for options using the Black-Scholes Option Pricing Model. The Company did not grant options in 2012. The following assumptions were used in the option pricing model for 2011 and 2010:
The estimated weighted-average fair value for options granted in 2011 and 2010 was $3.31 and $2.38, respectively.
| 2011 |
2010 | |||
| Expected life (years) |
5.0 | 5.0 | ||
| Risk free interest rate |
0.84% to 2.32% | 1.13% to 2.54% | ||
| Dividends |
— | — | ||
| Volatility |
67.00% to 70.62% | 71.13% to 76.55% |
The Company recognized stock-based compensation in the amount of $1,436, $2,402 and $3,824 for options awarded to employees and directors for the years ended December 31, 2012, 2011 and 2010, respectively.
The amount of unrecognized stock-based compensation relating to stock options grants as of December 31, 2012 is $1,382 and the weighted-average remaining vesting period is approximately 2.93 years.
The Company did not recognize stock-based compensation expense for option awards to nonemployee consultants and special advisors for the years ended December 31, 2012, 2011 and 2010.
The Company grants restricted stock to employees, and certain directors. All restricted stock awards require future service as a condition of delivery of the underlying shares of common stock along with certain other requirements outlined in the award agreements. Restricted stock awards generally vest over one to four years.
From time-to-time, the Company also grants restricted and common stock to nonemployee consultants and special advisors for services. In general, theses awards vest over the contractual period of the consulting arrangement. The fair value of these awards is measured at the grant dated fair value and re-measured at each reporting period. Fair value is determined as the closing price of the Company’s common stock on the date of grant.
The following table summarizes information about restricted shares outstanding for the years ended December 31, 2012, 2011 and 2010:
| Restricted Stock Awards |
||||
| Unvested balance at January 1, 2010 |
4,430,123 | |||
| Granted |
554,011 | |||
| Vested |
(2,772,125 | ) | ||
| Forfeited |
(53,500 | ) | ||
|
|
|
|||
| Unvested balance at December 31, 2010 |
2,158,509 | |||
| Granted |
561,526 | |||
| Vested |
(1,382,376 | ) | ||
| Forfeited |
(26,288 | ) | ||
|
|
|
|||
| Unvested balance at December 31, 2011 |
1,311,371 | |||
| Granted |
1,209,114 | |||
| Vested |
(1,209,121 | ) | ||
| Forfeited |
(30,220 | ) | ||
|
|
|
|||
| Unvested balance at December 31, 2012 |
1,281,144 | |||
|
|
|
|||
F-17
As of December 31, 2012 all awards of restricted stock have vested for nonemployee consultants and special advisors. There are no remaining unvested restricted shares to non-employees or special advisors at December 31, 2012. As of December 31, 2011 and 2010, 312,500 and 750,000 shares of unvested restricted stock for awards granted to nonemployee consultants and special advisors are included in the above.
The Company recognized stock-based compensation in the amount of $3,814, $2,041 and $2,921 for restricted stock awards to employees and directors for the year ended 2012, 2011 and 2010, respectively. The amount of unrecognized stock-based compensation expense for employee restricted share grants as of December 31, 2012, is approximately $5,565 and the weighted-average remaining vesting period is approximately 2.47 years.
The Company recognized stock-based compensation expense in the amount of $2,187, $2,698 and $2,010, for restricted stock awards to nonemployee consultants and special advisors for the years ended 2012, 2011 and 2010, which is included in professional and consulting fees and other expenses on the consolidated statements of operations.
Warrants
The Company has no warrants outstanding.
7. Employee Benefit Plans
The Company has a 401(k) savings plan covering all eligible employees in which the Company can make discretionary contributions from its profits. The Company has not made any discretionary contributions for years ended December 31, 2012, 2011 and 2010.
8. Earnings Per Share
The following is a reconciliation of the basic and diluted earnings per share computation:
| For the Year Ended December 31, |
||||||||||||
| 2012 | 2011 | 2010 | ||||||||||
| (shares in thousands) | ||||||||||||
| Net income/(loss) |
$ | 11,030 | $ | 3,092 | $ | (7,549 | ) | |||||
|
|
|
|
|
|
|
|||||||
| Shares of common stock and common stock equivalents: |
||||||||||||
| Weighted averages shares used in basic computation |
122,138 | 114,132 | 111,981 | |||||||||
| Dilutive effect of stock options and unvested restricted stock |
15,830 | 21,407 | — | |||||||||
|
|
|
|
|
|
|
|||||||
| Weighted averages shares used in dilutive computation |
137,968 | 135,539 | 111,981 | |||||||||
|
|
|
|
|
|
|
|||||||
| Basic earnings/(loss) per share |
$ | 0.09 | $ | 0.03 | $ | (0.07 | ) | |||||
| Dilutive earnings/(loss) per share |
$ | 0.08 | $ | 0.02 | $ | (0.07 | ) | |||||
Diluted earnings per share reflects the potential reduction in earnings per share that could occur if options or other contracts to issue common stock were exercised or converted into common stock under the treasury stock method. The dilutive effect of options and restricted shares to purchase shares of common stock were included in the years ended December 31, 2012 and 2011, respectively, but not included in the computation of diluted loss per share for the years ended December 31, 2010 , as the Company incurred losses during that year.
F-18
9. Income Taxes
The components of current and deferred income tax expense included in the Consolidated Statement of Operations as determined in accordance with ASC 740, Income Taxes (“ASC 740”), are as follows:
| Current: |
||||
| Federal |
$ | — | ||
| State and local |
— | |||
|
|
|
|||
| — | ||||
|
|
|
|||
| Deferred: |
||||
| Federal |
— | |||
| State and local |
— | |||
|
|
|
|||
| — | ||||
|
|
|
|||
| Income tax expense from operations |
$ | — | ||
|
|
|
|||
The Company has recorded its non-income based taxes as part of other liabilities and other expenses.
At December 31, 2012 and 2011, the Company had total net operating losses carry forwards of $136,515 and $106,939, respectively. Due to an ownership change on November 10, 2004, this carry forward includes a Section 382 (of the U.S. Internal Revenue Code) limited net operating loss of approximately $14,049 at December 31, 2012, which expires at various dates through 2024, and the annual utilization of which is limited to $524 in future years. In 2012, $3,487 of these losses have been deemed to be worthless and written off. The NOLs before the writeoff will expire as follows:
| Year Ending December 31: |
||||
| 2018 |
$ | 5,819 | ||
| 2019 |
5,101 | |||
| 2021 |
579 | |||
| 2023 |
608 | |||
| 2024 |
1,942 | |||
|
|
|
|||
| $ | 14,049 | |||
|
|
|
The Company has determined that a second Section 382 change in ownership occurred on November 12, 2012. Accordingly, the NOLs incurred between the two ownership changes (detailed below) are also subject to an annual limit as currently estimated of $58,888. Approximately $4,300 of the 2012 losses are allocable to the post change period and therefore not subject to limitation.
| Year Ending December 31: |
||||
| 2024 |
$ | 388 | ||
| 2025 |
3,239 | |||
| 2026 |
15,560 | |||
| 2027 |
24,655 | |||
| 2028 |
19,754 | |||
| 2029 |
14,218 | |||
| 2030 |
6,385 | |||
| 2031 |
6,052 | |||
| 2032 |
32,215 | |||
|
|
|
|||
| $ | 122,466 | |||
|
|
|
F-19
At December 31, 2012 and 2011, the composition of the deferred tax asset is summarized as follows by applying a 45.22% and 45.13% tax rate to the deferred tax items:
| December 31, | ||||||||
| 2012 | 2011 | |||||||
| Deferred tax assets: |
||||||||
| Net operating losses |
$ | 37,571 | $ | 39,977 | ||||
| Stock-based compensation |
6,471 | 8,998 | ||||||
| Fixed assets |
286 | 236 | ||||||
| Deferred rent liability |
68 | 132 | ||||||
| Other |
82 | 79 | ||||||
|
|
|
|
|
|||||
| Total deferred tax assets |
44,478 | 49,422 | ||||||
| Less: valuation allowance |
(44,478 | ) | (49,422 | ) | ||||
|
|
|
|
|
|||||
| Net deferred tax assets |
$ | — | $ | — | ||||
|
|
|
|
|
|||||
$49,946 of the available NOLs (total NOLs excluding those written off) has been generated from excess stock compensation deductions that cannot be recognized under ASC 718. Accordingly, a deferred tax asset related to this amount has not been set up.
At December 31, 2012 and 2011, the deferred tax asset has been offset by a valuation allowance of $44,478 and $49,422 respectively.
A reconciliation between the statutory federal income tax rate of 35% and the Company’s effective rate is as follows:
| December 31, | ||||||||||||
| 2012 | 2011 | 2010 | ||||||||||
| Federal statutory rate |
35.00 | % | 35.00 | % | (35.00 | %) | ||||||
| Permanent differences |
(119.37 | %) | (105.65 | %) | 2.02 | % | ||||||
| State income tax rate, net of federal benefit |
9.44 | % | 21.28 | % | (0.33 | %) | ||||||
| (Decrease)/increase in valuation allowance |
(44.82 | %) | (89.25 | %) | 5.59 | % | ||||||
| Worthless Net Operating Losses per Section 382 |
0.00 | % | 0.00 | % | 32.89 | % | ||||||
| Change in effective rate |
0.00 | % | 0.00 | % | 7.85 | % | ||||||
| NOL adjustment |
119.74 | % | 138.22 | % | 0.00 | % | ||||||
| Other differences, net |
0.01 | % | 0.40 | % | (13.02 | %) | ||||||
|
|
|
|
|
|
|
|||||||
| Effective rate |
0.00 | % | 0.00 | % | 0.00 | % | ||||||
|
|
|
|
|
|
|
|||||||
As of December 31, 2012, the Company determined that it has no uncertain tax positions, interest or penalties as defined within ASC 740-10. The Company does not have unrecognized tax benefits. The Company does not believe that it is reasonably possible that the total unrecognized benefits will significantly increase within the next 12 months. The Company is not currently under audit by any taxing authority. Tax returns filed with each jurisdiction remain open to examination under the normal three-year statute of limitations.
10. Shares Repurchased
During the year ended December 31, 2012, the Company repurchased 357,123 shares of its Company stock for an aggregate price of $2,261. The shares repurchased related to the vesting of restricted common stock granted to employees.
F-20
11. Public Offerings
In February 2012, the Company completed a public offering of its common stock at $5.61 per share. The Company sold 1,000,000 shares and certain of our stockholders sold 15,516,587 shares. Proceeds to the Company, less commissions and other direct selling expenses were approximately $4,329 and were used for working capital and other general corporate purposes. In November 2012, the Company completed a second public offering of its common stock where certain of our existing stockholders sold 27,795,630 shares at $6.10 per share. The Company did not sell any stock in the second offering and did not receive any proceeds from the sale of shares of its common stock by the selling stockholders. The Company incurred $353 in expenses in 2012 related to the second offering.
12. ETF Shareholder Proxy Solicitation
In 2012, the Company completed its solicitation from the WisdomTree ETF shareholders to obtain approval for the Company to continue as investment advisor for the WisdomTree ETFs if the Company’s largest stockholder, Michael Steinhardt, who beneficially owned 25.5% of the Company’s common stock prior to the second public offering discussed above in Note 11 were to sell or otherwise transfer shares of the Company’s common stock resulting in his beneficial ownership falling below 25%. The Investment Company Act presumes a change in control of the Company if Mr. Steinhardt’s ownership fell below the 25% threshold, which would trigger an automatic termination of the Company’s investment advisory agreements with the WisdomTree Trust and require approval of the WisdomTree ETF shareholders to continue the agreements. No further shareholder approval was required when Mr. Steinhardt’s ownership fell below 25%. In addition, the Company received approval from the WisdomTree ETF shareholders to allow the Company to change sub-advisors in the future. For the year ended December 31, 2012, the Company incurred proxy related expense of $3,264.
F-21
EXHIBIT INDEX
| Exhibit |
Description | |
| 3.1(1) | Amended and Restated Certificate of Incorporation | |
| 3.2(1) | Amended and Restated Bylaws | |
| 4.1(1) | Specimen Common Stock Certificate | |
| 4.2(1) | Amended and Restated Stockholders Agreement among Registrant and certain investors dated December 21, 2006 | |
| 4.3(1) | Securities Purchase Agreement among Registrant and certain investors dated December 21, 2006 | |
| 4.4(1) | Securities Purchase Agreement among Registrant and certain investors dated October 15, 2009 | |
| 4.5(1) | Third Amended and Restated Registration Rights Agreement dated October 15, 2009 | |
| 10.1(1) | Representative Form of Advisory Agreement between WisdomTree Asset Management, Inc. and WisdomTree Trust | |
| 10.2(2) | Amended and Restated License Agreement between WisdomTree Investments, Inc. and WisdomTree Trust dated March 1, 2012 | |
| 10.4(1) | WisdomTree Investments, Inc. 1993 Stock Option Plan | |
| 10.5(1) | WisdomTree Investments, Inc. 1996 Performance Equity Plan | |
| 10.6(1) | WisdomTree Investments, Inc. 1996 Management Incentive Plan | |
| 10.7(1) | WisdomTree Investments, Inc. 2000 Performance Equity Plan | |
| 10.8(1) | WisdomTree Investments, Inc. 2001 Performance Equity Plan | |
| 10.9(1) | WisdomTree Investments, Inc. 2005 Performance Equity Plan | |
| 10.10(1) | Amendment to WisdomTree Investments, Inc. 2005 Performance Equity Plan approved by stockholder on August 20, 2007 | |
| 10.11(1) | Amendment to WisdomTree Investments, Inc. 2005 Performance Equity Plan approved by stockholder on August 23, 2010 | |
| 10.12(1) | Form of Restricted Stock Agreement (Multiple Year Vesting) for Executive Officers | |
| 10.13(1) | Form of Restricted Stock Agreement (Single Year Vesting) for Executive Officers | |
| 10.14(1) | Form of Stock Option Agreement for Executive Officers | |
| 10.15(1) | Form of Restricted Stock Agreement for Independent Directors | |
| 10.16(1) | Form of Stock Option Agreement for Independent Directors | |
| 10.17(1) | Form of Amendment dated January 26, 2009 to Existing Option Agreements between Registrant and Employees | |
| 10.19(1) | Stock Option Agreement between Registrant and Jonathan Steinberg dated March 17, 2004 | |
| 10.20(1) | Amendment dated November 10, 2004 to Stock Option Agreements between Registrant and Jonathan Steinberg dated January 3, 2001, April 3, 2002 and March 17, 2004 | |
| 10.21(1) | Stock Option Agreement between Registrant and Jonathan Steinberg dated November 10, 2004 | |
| 10.24(1) | Stock Option Agreement between Registrant and Luciano Siracusano dated March 17, 2004 | |
| 10.26(1) | Stock Option Agreement between Registrant and Luciano Siracusano dated November 10, 2004 | |
| Exhibit |
Description | |
| 10.27(1) | Stock Option Agreement between Registrant and Luciano Siracusano dated January 26, 2009 | |
| 10.28(1) | Amendment dated March 30, 2011 to Stock Option Agreements between Registrant and Luciano Siracusano dated January 26, 2009 | |
| 10.29(1) | Stock Option Agreement between Registrant and Michael Steinhardt dated November 10, 2004 | |
| 10.30(1) | Stock Option Agreement between Registrant and Frank Salerno dated July 22, 2005 | |
| 10.31.1(3) | Further Amended and Restated Employment Agreement between WisdomTree Asset Management, Inc. and Bruce Lavine dated as of April 24, 2012 | |
| 10.32(1) | Amended and Restated Employment Agreement between WisdomTree Asset Management, Inc. and Peter M. Ziemba dated as of May 24, 2011 | |
| 10.33(1) | Amended and Restated Employment Agreement between WisdomTree Asset Management, Inc. and Amit Muni dated as of May 24, 2011 | |
| 10.34(1) | Form of Proprietary Rights and Confidentiality Agreement | |
| 10.35(1) | Form of Indemnification Agreement for Officers and Directors | |
| 10.36(4) | Employment Agreement between WisdomTree Asset Management, Inc. and Gregory Barton dated as of October 8, 2012 | |
| 21.1(5) | Subsidiaries of WisdomTree Investments, Inc. | |
| 23.1(5) | Consent of Ernst & Young LLP, independent registered public accounting firm. | |
| 31.1(5) | Rule 13a-14(a) / 15d-14(a) Certifications | |
| 31.2(5) | Rule 13a-14(a) / 15d-14(a) Certifications | |
| 32.1(5) | Certification pursuant to 18 U.S.C. Section 1350, as adopted pursuant to Section 906 of the Sarbanes-Oxley Act of 2002 | |
| 101.INS(5)* | XBRL Instance Document | |
| 101.SCH(5)* | XBRL Taxonomy Extension Schema Document | |
| 101.CAL(5)* | XBRL Taxonomy Extension Calculation Linkbase Document | |
| 101.DEF(5)* | XBRL Taxonomy Extension Definition Linkbase Document | |
| 101.LAB(5)* | XBRL Taxonomy Extension Labels Linkbase Document | |
| 101.PRE(5)* | XBRL Taxonomy Extension Presentation Linkbase Document | |
| (1) | Incorporated by reference from the Registrant’s Registration Statement on Form 10 filed with the SEC on March 31, 2011. |
| (2) | Incorporated by reference from the Registrant’s Quarterly Report on Form 10-Q filed with the SEC on May 14, 2012. |
| (3) | Incorporated by reference from the Registrant’s Current Report on Form 8-K filed with the SEC on April 26, 2012. |
| (4) | Incorporated by reference from the Registrant’s Current Report on Form 8-K filed with the SEC on October 10, 2012. |
| (5) | Filed herewith. |
| * | Pursuant to Rule 406T, the interactive data files in Exhibit 101 hereto are deemed not filed or a part of a registration statement or prospectus for purposes of Section 11 or 12 of the Securities Act of 1933, as amended, are deemed not filed for purposes of Section 18 of the Securities Exchange Act of 1934, as amended ,and otherwise is not subject to liability under these sections and shall not be incorporated by reference into any registration statement or other document filed under the Securities Act of 1933, as amended, except as expressly set forth by specific reference in such filing. |