UNITED STATES
SECURITIES AND EXCHANGE COMMISSION
Washington, D.C. 20549
Form 10-Q
(Mark One)
| x | QUARTERLY REPORT PURSUANT TO SECTION 13 OR 15(d) OF THE SECURITIES EXCHANGE ACT OF 1934 |
For the quarterly period ended March 31, 2013
or
| ¨ | TRANSITION REPORT PURSUANT TO SECTION 13 OR 15(d) OF THE SECURITIES EXCHANGE ACT OF 1934 |
For the transition period from to .
Commission File Number 001-10932
WisdomTree Investments, Inc.
(Exact name of registrant as specified in its charter)
| Delaware | 13-3487784 | |
| (State or other jurisdiction of incorporation or organization) |
(IRS Employer Identification No.) | |
| 380 Madison Avenue, 21st Floor New York, New York |
10017 | |
| (Address of principal executive officers) | (Zip Code) | |
212-801-2080
(Registrant’s Telephone Number, Including Area Code)
Indicate by check mark whether the registrant (1) has filed all reports required to be filed by Section 13 or 15(d) of the Securities Exchange Act of 1934, as amended (the “Exchange Act”) during the preceding 12 months (or for such shorter period that the registrant was required to file such reports), and (2) has been subject to such filing requirements for the past 90 days. Yes x No ¨
Indicate by check mark whether the registrant has submitted electronically and posted on its corporate Web site, if any, every Interactive Data File required to be submitted and posted pursuant to Rule 405 of Regulation S-T (§232.405 of this chapter) during the preceding 12 months (or for such shorter period that the registrant was required to submit and post such files). x Yes ¨ No
Indicate by check mark whether the registrant is a large accelerated filer, an accelerated filer, a non-accelerated filer or a smaller reporting company. See definitions of “large accelerated filer,” “accelerated filer” and “smaller reporting company” in 12b-2 of the Exchange Act.
| Large accelerated filer | ¨ | Accelerated filer | x | |||||
| Non-accelerated filer | ¨ | Smaller reporting company | ¨ | |||||
Indicate by check mark whether the registrant is a shell company (as defined in Rule 12b-2 of the Exchange Act). Yes ¨ No x
As of April 30, 2013 there were 127,673,005 shares of the registrant’s Common Stock, $0.01 par value per share, outstanding (voting shares).
WISDOMTREE INVESTMENTS, INC.
Form 10-Q
For the Quarterly Period Ended March 31, 2013
TABLE OF CONTENTS
| Page Number |
||||
| 4 | ||||
| 4 | ||||
| Item 2. Management’s Discussion and Analysis of Financial Condition and Results of Operations |
14 | |||
| Item 3. Quantitative and Qualitative Disclosures about Market Risk |
22 | |||
| 22 | ||||
| 22 | ||||
| 22 | ||||
| 22 | ||||
| Item 2. Unregistered Sales of Equity Securities and Use of Proceeds |
23 | |||
| 23 | ||||
| 23 | ||||
| Item 5. Other Information |
||||
| 24 | ||||
2
CAUTIONARY NOTE REGARDING FORWARD-LOOKING STATEMENTS
This Quarterly Report on Form 10-Q contains forward-looking statements that are based on our management’s belief and assumptions and on information currently available to our management. Although we believe that the expectations reflected in these forward-looking statements are reasonable, these statements relate to future events or our future financial performance, and involve known and unknown risks, uncertainties and other factors that may cause our actual results, levels of activity, performance or achievements to be materially different from any future results, levels of activity, performance or achievements expressed or implied by these forward-looking statements.
In some cases, you can identify forward-looking statements by terminology such as “may,” “will,” “should,” “expects,” “intends,” “plans,” “anticipates,” “believes,” “estimates,” “predicts,” “potential,” “continue” or the negative of these terms or other comparable terminology. These statements are only predictions. You should not place undue reliance on forward-looking statements because they involve known and unknown risks, uncertainties and other factors, which are, in some cases, beyond our control and which could materially affect results. Factors that may cause actual results to differ materially from current expectations include, among other things, those listed in the section entitled “Risk Factors” included in our Annual Report on Form 10-K for the fiscal year ended December 31, 2012. If one or more of these risks or uncertainties occur, or if our underlying assumptions prove to be incorrect, actual events or results may vary significantly from those implied or projected by the forward-looking statements. No forward-looking statement is a guarantee of future performance. You should read this Report and the documents that we reference in this Report and have filed with the Securities and Exchange Commission as exhibits to this Report, completely and with the understanding that our actual future results may be materially different from any future results expressed or implied by these forward-looking statements.
In particular, forward-looking statements in this Report include statements about:
| • | anticipated trends, conditions and investor sentiment in the global markets; |
| • | anticipated levels of inflows into and outflows out of our exchange traded funds (“ETFs”); |
| • | our ability to deliver favorable rates of return to investors; |
| • | our ability to develop new products and services; |
| • | our ability to maintain current vendors or find new vendors to provide services to us at favorable costs; |
| • | competition in our business; and |
| • | the effect of laws and regulations that apply to our business. |
The forward-looking statements in this Report represent our views as of the date of this Report. We anticipate that subsequent events and developments may cause our views to change. However, while we may elect to update these forward-looking statements at some point in the future, we have no current intention of doing so except to the extent required by applicable law. Therefore, these forward-looking statements do not represent our views as of any date other than the date of this Report.
3
| ITEM 1. | CONSOLIDATED FINANCIAL STATEMENTS |
WisdomTree Investments, Inc. and Subsidiaries
Consolidated Balance Sheets
(In Thousands, Except Per Share Amounts)
| March 31, 2013 |
December 31, 2012 |
|||||||
| (Unaudited) | ||||||||
| Assets |
||||||||
| Current assets: |
||||||||
| Cash and cash equivalents |
$ | 52,297 | $ | 41,246 | ||||
| Accounts receivable |
11,098 | 9,348 | ||||||
| Other current assets |
1,529 | 1,273 | ||||||
|
|
|
|
|
|||||
| Total current assets |
64,924 | 51,867 | ||||||
| Fixed assets, net |
408 | 480 | ||||||
| Investments |
10,668 | 11,036 | ||||||
| Other noncurrent assets |
53 | 42 | ||||||
|
|
|
|
|
|||||
| Total assets |
$ | 76,053 | $ | 63,425 | ||||
|
|
|
|
|
|||||
| Liabilities and stockholders’ equity |
||||||||
| Liabilities: |
||||||||
| Current liabilities: |
||||||||
| Fund management and administration payable |
$ | 9,513 | $ | 6,924 | ||||
| Compensation and benefits payable |
2,613 | 2,156 | ||||||
| Accounts payable and other liabilities |
2,800 | 3,272 | ||||||
|
|
|
|
|
|||||
| Total current liabilities |
14,926 | 12,352 | ||||||
| Other noncurrent liabilities |
— | 13 | ||||||
|
|
|
|
|
|||||
| Total liabilities |
14,926 | 12,365 | ||||||
|
|
|
|
|
|||||
| Stockholders’ equity: |
||||||||
| Preferred stock, par value $0.01; 2,000 shares authorized: |
— | — | ||||||
| Common stock, par value $0.01; 250,000 shares authorized; issued: 127,667 and 126,554; outstanding: 125,628 and 125,272 |
1,276 | 1,265 | ||||||
| Additional paid-in capital |
180,028 | 177,826 | ||||||
| Accumulated deficit |
(120,177 | ) | (128,031 | ) | ||||
|
|
|
|
|
|||||
| Total stockholders’ equity |
61,127 | 51,060 | ||||||
|
|
|
|
|
|||||
| Total liabilities and stockholders’ equity |
$ | 76,053 | $ | 63,425 | ||||
|
|
|
|
|
|||||
The accompanying notes are an integral part of these consolidated financial statements
4
WisdomTree Investments, Inc. and Subsidiaries
Consolidated Statements of Operations
(In Thousands, Except Per Share Amounts)
(Unaudited)
| Three Months Ended | ||||||||
| March 31, 2013 |
March 31, 2012 |
|||||||
| Revenues: |
||||||||
| ETF advisory fees |
$ | 29,153 | $ | 18,975 | ||||
| Other income |
188 | 195 | ||||||
|
|
|
|
|
|||||
| Total revenues |
29,341 | 19,170 | ||||||
| Expenses: |
||||||||
| Compensation and benefits |
7,482 | 5,857 | ||||||
| Fund management and administration |
8,223 | 5,439 | ||||||
| Marketing and advertising |
1,937 | 1,326 | ||||||
| Sales and business development |
1,801 | 860 | ||||||
| Professional and consulting fees |
613 | 1,109 | ||||||
| Occupancy, communications, and equipment |
377 | 301 | ||||||
| Depreciation and amortization |
82 | 71 | ||||||
| Third-party sharing arrangements |
111 | 1,745 | ||||||
| Other |
861 | 609 | ||||||
| ETF shareholder proxy |
— | 66 | ||||||
| Patent litigation, net |
— | 672 | ||||||
|
|
|
|
|
|||||
| Total expenses |
21,487 | 18,055 | ||||||
|
|
|
|
|
|||||
| Income before provision for income taxes |
7,854 | 1,115 | ||||||
| Provision for income taxes |
— | — | ||||||
|
|
|
|
|
|||||
| Net income |
$ | 7,854 | $ | 1,115 | ||||
|
|
|
|
|
|||||
| Net income per share—basic |
$ | 0.06 | $ | 0.01 | ||||
|
|
|
|
|
|||||
| Net income per share—diluted |
$ | 0.06 | $ | 0.01 | ||||
|
|
|
|
|
|||||
| Weighted-average common shares—basic |
125,436 | 119,182 | ||||||
|
|
|
|
|
|||||
| Weighted-average common shares—diluted |
139,650 | 137,400 | ||||||
|
|
|
|
|
|||||
The accompanying notes are an integral part of these consolidated financial statements
5
WisdomTree Investments, Inc. and Subsidiaries
Consolidated Statements of Cash Flows
(In Thousands)
(Unaudited)
| Three Months Ended | ||||||||
| March 31, 2013 |
March 31, 2012 |
|||||||
| Cash flows from operating activities: |
||||||||
| Net income |
$ | 7,854 | $ | 1,115 | ||||
| Non-cash items included in net income: |
||||||||
| Depreciation and amortization and other |
82 | 71 | ||||||
| Stock-based compensation |
1,714 | 2,115 | ||||||
| Deferred rent |
(34 | ) | (37 | ) | ||||
| Accretion to interest income and other |
39 | 20 | ||||||
| Changes in operating assets and liabilities: |
||||||||
| Accounts receivable |
(1,750 | ) | (1,504 | ) | ||||
| Other assets |
(256 | ) | 198 | |||||
| Fund management and administration payable |
2,589 | 1,913 | ||||||
| Compensation and benefits payable |
457 | (2,931 | ) | |||||
| Accounts payable and other liabilities |
(451 | ) | 1,720 | |||||
|
|
|
|
|
|||||
| Net cash provided by operating activities |
10,244 | 2,680 | ||||||
| Cash flows from investing activities: |
||||||||
| Purchase of fixed assets |
(10 | ) | (56 | ) | ||||
| Purchase of investments |
(1,314 | ) | (3,549 | ) | ||||
| Proceeds from the redemption of investments |
1,633 | 2,486 | ||||||
|
|
|
|
|
|||||
| Net cash provided by/(used in) investing activities |
309 | (1,119 | ) | |||||
| Cash flows from financing activities: |
||||||||
| Net proceeds from sale of common stock |
— | 4,329 | ||||||
| Shares repurchased |
(249 | ) | (995 | ) | ||||
| Proceeds from exercise of stock options |
747 | 1,613 | ||||||
|
|
|
|
|
|||||
| Net cash provided by financing activities |
498 | 4,947 | ||||||
|
|
|
|
|
|||||
| Net increase in cash and cash equivalents |
11,051 | 6,508 | ||||||
| Cash and cash equivalents—beginning of period |
41,246 | 25,630 | ||||||
|
|
|
|
|
|||||
| Cash and cash equivalents—end of period |
$ | 52,297 | $ | 32,138 | ||||
|
|
|
|
|
|||||
| Supplemental disclosure of cash flow information: |
||||||||
| Cash paid for income taxes |
$ | 34 | $ | 3 | ||||
|
|
|
|
|
|||||
The accompanying notes are an integral part of these consolidated financial statements
6
WisdomTree Investments, Inc. and Subsidiaries
Notes to Consolidated Financial Statements
(In Thousands, Except Share and Per Share Amounts)
1. Organization and Description of Business
WisdomTree Investments, Inc. (“WisdomTree” or the “Company”) is a New York-based exchange-traded fund sponsor and asset manager. The Company is the sixth largest sponsor of ETFs in the United States based on assets under management (“AUM”) at March 31, 2013. In June 2006, the Company launched 20 ETFs and, as of March 31, 2013, had 47 ETFs with AUM of $25.1 billion. Through its operating subsidiary, the Company provides investment advisory and other management services to the WisdomTree Trust (“WTT”) and WisdomTree ETFs. The Company also licenses its indexes to third parties and promotes the use of WisdomTree ETFs in 401(k) plans. The Company has the following subsidiaries:
| • | WisdomTree Asset Management, Inc. (“WTAM”)—a wholly owned subsidiary formed in February 2005, is an investment advisor registered with the Securities and Exchange Commission (“SEC”). WTAM provides investment advisory and other management services to WTT and the WisdomTree ETFs. In exchange for providing these services, the Company receives advisory fee revenues based on a percentage of the ETFs average daily net assets under management. |
| • | WisdomTree Retirement Services, Inc. (“WTRS”)—a wholly owned subsidiary formed in August 2007, markets with selected third parties the use of WisdomTree ETFs in 401(k) plans. |
The WisdomTree ETFs are issued by WTT. WTT, a non-consolidated third-party, is a Delaware statutory trust registered with the SEC as an open-end management investment company. WTT offers ETFs across equities, fixed income, currency, and alternatives asset classes. The Company has licensed the use of its own fundamentally-weighted indexes on an exclusive basis to WTT for the WisdomTree ETFs. The Board of WTT, or the Trustees, is separate from the Board of the Company. The Trustees are primarily responsible for overseeing the management and affairs of the WisdomTree ETFs and the Trust for the benefit of the WisdomTree ETF shareholders and has contracted with the Company to provide for general management and administration services of WTT and the WisdomTree ETFs. The Company, in turn, has contracted with third parties to provide the majority of these administration services. In addition, certain officers of the Company provide general management services for WTT.
2. Significant Accounting Policies
Basis of Presentation
These consolidated financial statements have been prepared in conformity with U.S. generally accepted accounting principles (“GAAP”) and in the opinion of management reflect all adjustments, consisting of only normal recurring adjustments, necessary for a fair statement of financial condition, results of operations, and cash flows for the periods presented. The consolidated financial statements include the accounts of the Company’s wholly owned subsidiaries WTAM and WTRS. All intercompany accounts and transactions have been eliminated in consolidation. Certain accounts in the prior years’ consolidated financial statements have been reclassified to conform to the current year’s consolidated financial statements presentation. These reclassifications had no effect on the previously reported operating results.
Use of Estimates
The preparation of the Company’s consolidated financial statements in conformity with GAAP requires management to make estimates and assumptions that affect the reported amounts of assets and liabilities as of the balance sheet dates and the reported amounts of revenues and expenses for the periods presented. Actual results could differ materially from those estimates.
Revenue Recognition
The Company earns investment advisory fees for ETFs and separately managed accounts as well as licensing fees from third parties. ETF advisory fees are based on a percentage of the ETFs average daily net assets and recognized over the period the related service is provided. Fees for separately managed accounts and licensing are based on a percentage of the average monthly net assets and recognized over the period the related service is provided.
7
Depreciation and Amortization
Depreciation is provided for using the straight-line method over the estimated useful lives of the related assets as follows:
| Equipment |
3 years | |||
| Furniture and fixtures |
7 years |
Leasehold improvements are amortized over the term of their respective leases or service lives of the improvements, whichever is shorter. Fixed assets are stated at cost less accumulated depreciation and amortization.
Marketing and Advertising
Advertising costs, including media advertising and production costs, are expensed when incurred.
Cash and Cash Equivalents
The Company considers all highly liquid investments with an original maturity of 90 days or less at the time of purchase to be classified as cash equivalents. Cash and cash equivalents are held with one large financial institution.
Accounts Receivable and Allowance for Doubtful Accounts
Accounts receivable are customers’ obligations due under normal trade terms. An allowance for doubtful accounts is not provided since, in the opinion of management, all accounts receivable recorded are deemed collectible.
Impairment of Long-Lived Assets
On a periodic basis, the Company performs a review for the impairment of long-lived assets when events or changes in circumstances indicate that the estimated undiscounted future cash flows expected to be generated by the assets are less than their carrying amounts or when other events occur which may indicate that the carrying amount of an asset may not be recoverable.
Earnings per Share
Basic earnings per share is computed by dividing net income available to common stockholders by the weighted-average number of common shares outstanding for the period. Diluted earnings per share reflects the potential reduction in earnings per share that could occur if options or other contracts to issue common stock were exercised or converted into common stock. Options and restricted shares to purchase shares of common stock were included in the calculation of diluted earnings per share in the three months ended March 31, 2013 and 2012, respectively.
Investments
The Company accounts for all of its investments as held-to-maturity, which are recorded at amortized cost, which approximates fair value. For held-to-maturity investments, the Company has the intent and ability to hold investments to maturity and it is not more likely than not that the Company will be required to sell the investments before recovery of their amortized cost bases, which may be maturity.
On a periodic basis, the Company reviews its portfolio of investments for impairment. If a decline in fair value is deemed to be other-than-temporary, the security is written down to its fair value through earnings.
Subsequent Events
The Company has evaluated subsequent events after the date of the consolidated financial statements to consider whether or not the impact of such events needed to be reflected or disclosed in the consolidated financial statements. Such evaluation was performed through the issuance date of the consolidated financial statements.
Stock-Based Awards
Accounting for share-based compensation requires the measurement and recognition of compensation expense for all equity awards based on estimated fair values. The Company accounts for stock-based compensation for its employees based on the cost of employee services received in exchange for a stock-based award. Stock-based compensation is measured based on the grant-date fair value of the award and is amortized over the relevant service period.
Stock-based awards granted to non-employees for goods or services are valued at the fair value of the equity instruments issued or the fair value of consideration received, whichever is a more reliable measure of the fair value of the transaction, and recognized when performance obligations are complete.
8
Income Taxes
The Company accounts for income taxes using the liability method, which requires the determination of deferred tax assets and liabilities based on the differences between the financial and tax basis of assets and liabilities using the enacted tax rates in effect for the year in which differences are expected to reverse. Deferred tax assets are adjusted by a valuation allowance if, based on the weight of available evidence, it is more-likely-than-not that some portion or all of the deferred tax assets will not be realized.
In order to recognize and measure any unrecognized tax benefits, management evaluates and determines whether any of its tax positions are more-likely-than-not to be sustained upon examination, including resolution of any related appeals or litigation processes, based on the technical merits of the position. Once it is determined that a position meets this recognition threshold, the position is measured to determine the amount of benefit to be recognized in the consolidated financial statements. The Company has elected to record interest expense and penalties related to tax expenses as income tax expense.
Related-Party Transactions
The Company’s revenues are derived primarily from investment advisory agreements with WTT and WisdomTree ETFs. Under these agreements, the Company has granted WTT an exclusive license to its own indexes for operation of the WisdomTree ETFs. The Trustees are primarily responsible for overseeing the management and affairs of the WisdomTree ETFs and the Trust for the benefit of the WisdomTree ETF shareholders and has contracted with the Company to provide for general management and administration of WTT and the WisdomTree ETFs. The Company is also responsible for expenses of WTT, including the cost of transfer agency, custody, fund administration and accounting, legal, audit, and other non-distribution services. In exchange, the Company receives fees based on a percentage of the ETF average daily net assets. The advisory agreements may be terminated by WTT upon notice. Certain officers of the Company also provide general management oversight of WTT; however, these officers have no material decision making responsibilities and primarily implement the decisions of the Trustees. At March 31, 2013 and December 31, 2012 the balance of accounts receivable from WTT was approximately $10,969 and $8,180, respectively which is included as a component of accounts receivable in the consolidated balance sheet. Revenue from advisory services provided to WTT for the three months ended March 31, 2013 and 2012 was $29,153 and $18,975 respectively.
Third-Party Sharing Arrangements
Included in third party sharing arrangements expense are payments (reimbursements) from/(to) the Company with respect to (i) a collaborative arrangement and (ii) marketing agreements with third parties:
Collaborative Arrangement— The Company was the principal participant for transactions under a collaborative arrangement with Mellon Capital Management Corporation (“Mellon Capital”) and The Dreyfus Corporation (“Dreyfus”). This arrangement ended in December 2012. Under the arrangement, the parties collaborated in developing currency and fixed income ETFs under WTT. The Company was responsible for operating the ETFs and providing sales, marketing and research support at its own cost. Mellon Capital and Dreyfus were responsible for providing sub-advisory, fund administration and accounting services for these collaborative ETFs at their own cost. Any revenues less third party costs, such as marketing, legal, accounting or fund management, related to these collaborative products are shared, including any losses (“net profit/(loss)”). The Company was responsible for arranging any third party costs related to this collaborative arrangement. The Company recorded these transactions on a gross basis reflecting all of the revenues and third party expenses on its consolidated financial statements in accordance with the nature of the revenue or expense. Any net profit/(loss) payments are reflected in Third-Party Sharing Arrangements expense on the consolidated financial statements.
Revenues and expenses under this collaborative arrangement included in the Company’s consolidated financial statements are as follows:
| Three Month Ended March 31, 2012 |
||||
| ETF advisory fee revenue |
$ | 2,790 | ||
| Expenses: |
||||
| Fund management and administration |
341 | |||
| Marketing and advertising |
10 | |||
| Sales and business development |
4 | |||
|
|
|
|||
| Total third party expenses |
355 | |||
|
|
|
|||
| Net profit |
2,435 | |||
|
|
|
|||
| Sharing |
$ | 1,195 | ||
|
|
|
|||
9
Marketing agreements— the Company has entered into agreements with certain firms to serve as the external marketing agents for the WisdomTree ETFs. Under these agreements, the Company will pay a percentage of their advisory fee revenue, subject to caps, to the marketing agents based on incremental growth in assets under management. The Company incurred marketing fees of $111 and $550 for the three months March 31, 2013 and 2012 respectively.
Segment, Geographic and Customer Information
The Company operates as one business segment, as an ETF sponsor and asset manager providing investment advisory services. Revenues are derived in the U.S. and all of the Company’s assets are located in the U.S.
3. Investments and Fair Value Measurements
The following table is a summary of the Company’s investments:
| March 31, 2013 |
December 31, 2012 |
|||||||
| Held-to- Maturity |
Held-to- Maturity |
|||||||
| Federal agency debt instruments |
$ | 10,668 | $ | 11,036 | ||||
|
|
|
|
|
|||||
The following table summarizes unrealized gains, losses, and fair value of investments:
| March 31, 2013 |
December 31, 2012 |
|||||||
| Held-to- Maturity |
Held-to- Maturity |
|||||||
| Cost/amortized cost |
$ | 10,668 | $ | 11,036 | ||||
| Gross unrealized gains |
48 | 61 | ||||||
| Gross unrealized losses |
(163 | ) | (157 | ) | ||||
|
|
|
|
|
|||||
| Fair value |
$ | 10,553 | $ | 10,940 | ||||
|
|
|
|
|
|||||
The following table sets forth the maturity profile of investments:
| March 31, 2013 |
December 31, 2012 |
|||||||
| Held-to- Maturity |
Held-to- Maturity |
|||||||
| Due within one year |
$ | — | $ | — | ||||
| Due one year through five years |
— | — | ||||||
| Due five years through ten years |
714 | 727 | ||||||
| Due over ten years |
9,954 | 10,309 | ||||||
|
|
|
|
|
|||||
| Total |
$ | 10,668 | $ | 11,036 | ||||
|
|
|
|
|
|||||
Fair Value Measurement
Under the accounting for fair value measurements and disclosures, fair value is defined as the price that would be received to sell an asset or paid to transfer a liability, or the exit price, in an orderly transaction between market participants at the measurement date. The accounting guidance establishes a hierarchy of valuation techniques based on whether the inputs to those valuation techniques are observable or unobservable. Observable inputs reflect market data obtained from independent sources, while unobservable inputs reflect the Company’s market assumptions.
These three types of inputs create the following fair value hierarchy:
Level 1—Quoted prices for identical instruments in active markets.
Level 2—Quoted prices for similar instruments in active markets; quoted prices for identical or similar instruments in markets that are not active; and model-derived valuations whose inputs are observable or whose significant value drivers are observable.
Level 3—Instruments whose significant value drivers are unobservable.
10
This hierarchy requires the use of observable market data when available. The Company’s held-to-maturity securities are categorized as Level 1. The amortized cost of the held-to-maturity securities approximates fair value. The Company does not intend to sell its investments held-to maturity before the recovery of their amortized cost bases which may be at maturity.
Some of our financial instruments are not measured at fair value on a recurring basis but are recorded at amounts that approximate fair value due to their liquid or short-term nature. Such financial assets and financial liabilities are categorized as Level 3.
4. Fixed Assets
The following table summarizes fixed assets:
| March 31, 2013 |
December 31, 2012 |
|||||||
| Equipment |
$ | 796 | $ | 786 | ||||
| Furniture and fixtures |
308 | 308 | ||||||
| Leasehold improvements |
1,062 | 1,062 | ||||||
| Less accumulated depreciation and amortization |
(1,758 | ) | (1,676 | ) | ||||
|
|
|
|
|
|||||
| Total |
$ | 408 | $ | 480 | ||||
|
|
|
|
|
|||||
5. Commitments and Contingencies
Contractual Obligations
The Company has entered into obligations under operating leases with initial non-cancelable terms in excess of one year for office space, telephone, and data services. Expenses recorded under these agreements for the three months ended March 31, 2013 and 2012 were approximately $362 and $288, respectively.
Future minimum lease payments with respect to non-cancelable operating leases at March 31, 2013 are approximately as follows:
| Remainder of 2013 |
$ | 1,049 | ||
| 2014 |
184 | |||
| 2015 |
32 | |||
| 2016 and thereafter |
3 | |||
|
|
|
|||
| Total |
$ | 1,268 | ||
|
|
|
The Company’s office lease expires in January 2014. The Company has begun the search for new office space.
Letter of Credit
The Company collateralizes its office lease space through a standby letter of credit. Pursuant to the terms of the lease agreement in 2012, the Company decreased its standby letter of credit from $700 to $419 and replaced its investments in debt securities with cash.
Contingencies
The Company is subject to various routine regulatory reviews and inspections by the SEC as well as legal proceedings arising in the ordinary course of business. The Company is not currently party to any litigation or other legal proceedings that are expected to have a material impact on our business, financial position, results of operations, or cash flows.
In December 2011, Research Affiliates LLC filed a patent infringement lawsuit against the Company. In November 2012, Research Affiliates withdrew its lawsuit and entered into a settlement agreement with the Company. The Company’s insurance carrier funded a significant majority of the cost of defending this patent infringement lawsuit. The Company incurred litigation expense of $672, net of insurance reimbursement, in the three months ended March 31, 2012.
11
6. Stock-Based Awards
The Company grants equity awards to employees and directors and has in the past granted such awards to special advisors for services:
| • | Options are issued generally for terms of ten years and vest between two to four years. Options are issued with an exercise price equal to the fair value of the Company on the date of grant. The Company estimated the fair value for options using the Black-Scholes Option Pricing Model. |
| • | All restricted stock and option awards require future service as a condition of vesting with certain awards subject to acceleration under certain conditions. Awards generally vest over one to four years. |
| • | Stock awards granted to advisors vested over the contractual period of the consulting arrangement. The fair value of these awards was measured at the grant dated fair value and re-measured at each reporting period. Fair value was initially determined as the closing price of the Company’s common stock on the date of grant. |
A summary of options and restricted stock activity is as follows:
| Options | Weighted Average Exercise Price of Options |
Restricted Stock Awards |
||||||||||
| Balance at January 1, 2013 |
12,760,191 | $ | 0.95 | 1,281,144 | ||||||||
| Granted |
— | $ | — | 826,849 | ||||||||
| Exercised/vested |
(315,000 | ) | $ | 2.37 | (69,080 | ) | ||||||
| Forfeitures |
(37,500 | ) | $ | 4.23 | — | |||||||
|
|
|
|
|
|
|
|||||||
| Balance at March 31, 2013 |
12,407,691 | $ | 0.90 | 2,038,913 | ||||||||
|
|
|
|
|
|
|
|||||||
A summary of stock-based compensation expense is as follows:
| Three Months Ended March 31, |
||||||||
| 2013 | 2012 | |||||||
| Employees and directors |
$ | 1,714 | $ | 1,424 | ||||
| Non-employees |
— | 691 | ||||||
|
|
|
|
|
|||||
| Total |
$ | 1,714 | $ | 2,115 | ||||
|
|
|
|
|
|||||
7. Earnings Per Share
The following is a reconciliation of the basic and diluted earnings per share computation:
| Three Months Ended March 31, |
||||||||
| 2013 | 2012 | |||||||
| Net income |
$ | 7,854 | $ | 1,115 | ||||
|
|
|
|
|
|||||
| Shares of common stock and common stock equivalents: |
||||||||
| Weighted averages shares used in basic computation |
125,436 | 119,182 | ||||||
| Dilutive effect of stock options and unvested restricted stock |
14,214 | 18,218 | ||||||
|
|
|
|
|
|||||
| Weighted averages shares used in dilutive computation |
139,650 | 137,400 | ||||||
|
|
|
|
|
|||||
| Basic earnings per share |
$ | 0.06 | $ | 0.01 | ||||
| Dilutive earnings per share |
$ | 0.06 | $ | 0.01 | ||||
Diluted earnings per share reflects the potential reduction in earnings per share that could occur if options or other contracts to issue common stock were exercised or converted into common stock under the treasury stock method. The dilutive effect of options and restricted shares to purchase shares of common stock were included in the three months ended March 31, 2013 and 2012 respectively.
12
8. Shares Repurchased
During the three months ended March 31, 2013 and 2012, the Company repurchased 28,659 and 157,080 shares of its Company stock for an aggregate cost of $249 and $995 respectively. The shares repurchased relate to the tax withholding obligations that occur upon the vesting of restricted common stock granted to employees.
9. Public Offerings
In February 2012, the Company completed a public offering of its common stock at $5.61 per share. The Company sold 1,000,000 shares and certain of our stockholders sold 15,516,587 shares. Proceeds to the Company, less commissions and other direct selling expenses were approximately $4,329 and were used for working capital and other general corporate purposes. In November 2012, the Company completed a second public offering of its common stock where certain of our existing stockholders sold 27,795,630 shares at $6.10 per share. The Company did not sell any stock in the second offering and did not receive any proceeds from the sale of shares of its common stock by the selling stockholders. The Company incurred $353 in expenses in the fourth quarter of 2012 related to the second offering.
13
| ITEM 2. | MANAGEMENT’S DISCUSSION AND ANALYSIS OF FINANCIAL CONDITION AND RESULTS OF OPERATIONS |
The following discussion and analysis of our financial condition and results of operations should be read together with our consolidated financial statements and the related notes and the other financial information included elsewhere in this Report. In addition to historical consolidated financial information, the following discussion contains forward-looking statements that reflect our plans, estimates and beliefs. Our actual results could differ materially from those discussed in the forward-looking statements. Factors that could cause or contribute to these differences include those discussed below. For a more complete description of the risks noted above and other risks that could cause our actual results to materially differ from our current expectations, please see the Item 1A. “Risk Factors” of our Annual Report on Form 10-K for the fiscal year ended December 31, 2012. We assume no obligation to update or revise publicly any forward-looking statements, whether as a result of new information, future events or otherwise, unless required by law.
Our Business
We were the sixth largest sponsor of ETFs in the United States based on AUM, with AUM of approximately $25.1 billion as of March 31, 2013. An ETF is an investment fund that holds securities such as stocks or bonds and trades at approximately the same price as the net asset value of its underlying assets. ETFs offer exposure to a wide variety of investment themes, including domestic, international and emerging market equities, fixed income securities, currencies or commodities, as well as securities in specific industries and countries. We currently offer a comprehensive family of 47 ETFs, which includes 34 equity ETFs, six fixed income ETFs, five currency ETFs and two alternative strategy ETFs.
Through our operating subsidiary, we provide investment advisory and other management services to the WisdomTree ETFs. In exchange for providing these services, we receive advisory fee revenues based on a percentage of the ETFs average daily net assets under management. Our expenses are predominantly related to selling, operating and marketing our ETFs. We have contracted with third parties to provide certain operational services for the ETFs.
We distribute our ETFs through all major channels within the asset management industry, including brokerage firms, registered investment advisors, institutional investors, private wealth managers and discount brokers. We do not target our ETFs for sale directly to the retail segment but rather to the financial advisor who acts as the intermediary between the end-client and us.
Our revenues are highly correlated to the level and relative mix of our AUM, as well as the fee rate associated with our ETFs. While our AUM has increased on an annual basis, we have experienced fluctuations on a quarterly basis due to changes in net inflows and market movement. A significant portion of our AUM is invested in securities issued outside of the United States. Accordingly, our AUM and our revenues are affected by movements in global capital market levels and the strengthening or weakening of the U.S. dollar against other currencies. It is our belief that our ability to generate inflows into our ETFs, coupled with general stock market trends, will have the greatest impact on our business.
Market Environment
Equity markets worldwide experienced positive results for the first three months of 2013 with the S&P 500 and MSCI EAFE indexes increasing 10.6% and 5.1%, respectively; while, the MSCI Emerging Market index decreased 1.6%. Positive momentum in equities helped fuel flows into equity products for both ETFs and long term mutual funds in the first quarter of 2013.
Our Results – Executive Summary
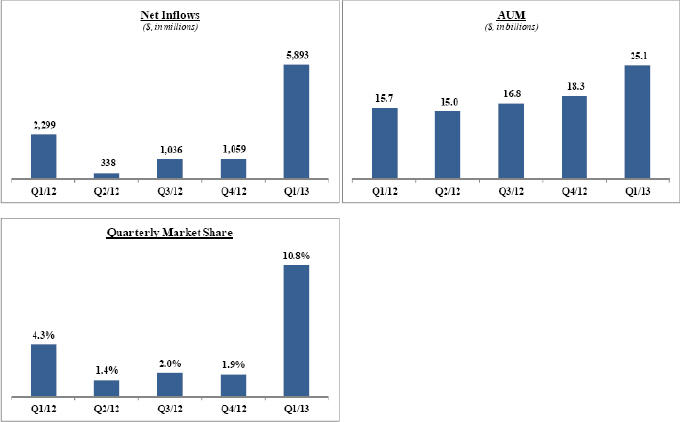
Our AUM has been growing and reaching record levels, increasing from $15.7 billion at the end of the first quarter of 2012 to $25.1 billion at the end of the first quarter of 2013. Our net inflows increased from $2.3 billion in the first quarter of 2012 to a record $5.9 billion over the same time period in 2013. The positive momentum into equities helped drive these strong inflows in the first quarter of 2013. In particular, $3.9 billion of our inflows in the first quarter of 2013 were in our Japanese hedged equity ETF. Political and economic policy changes in Japan drove increased investor interest in the region. Our market share of industry net inflows was 10.8% in the first quarter of 2013 as compared to 4.3% in the first quarter of last year.
14
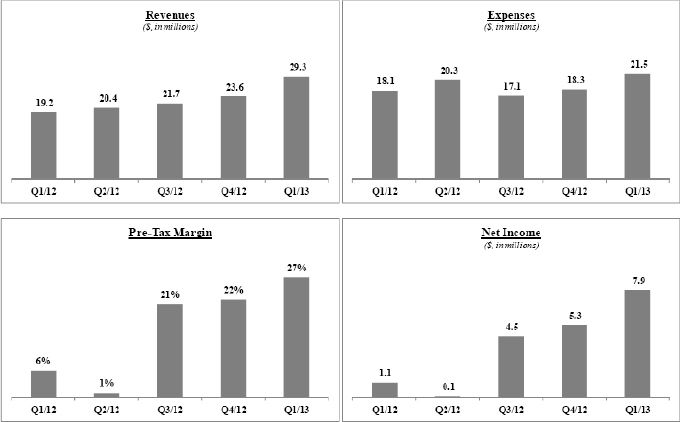
These operating metrics helped drive strong financial results. We recorded ETF revenues of $29.2 million in the first quarter of 2013, up 53.6% from the first quarter of last year primarily due to higher average AUM. Our expenses increased 19.0% compared to the first quarter of last year, due to higher compensation costs resulting from our record level of net inflows and higher fund related costs resulting from higher average AUM. Marketing and sales related expenses also increased as compared to the same period in 2012 as part of our planned strategic growth initiatives. Our net income reached $7.9 million as compared to $1.1 million over the same period last year and our pre-tax operating margin reached 27% as compared to 6%.
15
Competitive Environment
As the ETF industry grows, competition is increasing as existing players compete on price and broaden their suite of products to different strategies. For example, In March 2013, Charles Schwab & Co. filed a registration statement for six ETFs using the Russell fundamental indexes and in April 2013, iShares announced it would launch five factor-based ETFs. In addition, Deutsche Bank renamed five of their equity ETFs to stress their currency hedging strategy. We do not know what effect, if any, the launch of these ETFs may have on our business. Within the ETF industry, being a first mover, or one of the first providers of ETFs in a particular asset class, can be a significant advantage, as the first ETF in a category to attract scale in AUM and trading liquidity is generally viewed as the most attractive ETF. We believe that our early launch of ETFs in a number of asset classes or strategies, including fundamental weighting and currency hedging, positions us well to maintain our position as one of the leaders of the ETF industry.
Key Operating Statistics
The following table presents key operating statistics that serve as indicators for the performance of our business:
| Three Months Ended | ||||||||||||
| March 31, 2013 |
December 31, 2012 |
March 31, 2012 |
||||||||||
| Total ETFs (in millions) |
||||||||||||
| Beginning of period assets |
$ | 18,286 | $ | 16,783 | $ | 12,182 | ||||||
| Inflows/(outflows) |
5,893 | 1,059 | 2,299 | |||||||||
| Market appreciation/(depreciation) |
924 | 444 | 1,210 | |||||||||
|
|
|
|
|
|
|
|||||||
| End of period assets |
$ | 25,103 | $ | 18,286 | $ | 15,691 | ||||||
|
|
|
|
|
|
|
|||||||
| Average assets during the period |
$ | 21,934 | $ | 17,068 | $ | 14,265 | ||||||
| ETF Industry and Market Share (in billions) |
||||||||||||
| ETF industry net inflows |
$ | 54 | $ | 55 | $ | 53 | ||||||
| WisdomTree market share of industry inflows |
10.8 | % | 1.9 | % | 4.3 | % | ||||||
| International Developed Equity ETFs (in millions) |
||||||||||||
| Beginning of period assets |
$ | 3,732 | $ | 2,896 | $ | 2,407 | ||||||
| Inflows/(outflows) |
4,210 | 620 | 302 | |||||||||
| Market appreciation/(depreciation) |
583 | 216 | 255 | |||||||||
|
|
|
|
|
|
|
|||||||
| End of period assets |
$ | 8,525 | $ | 3,732 | $ | 2,964 | ||||||
|
|
|
|
|
|
|
|||||||
| Average assets during the period |
$ | 6,072 | $ | 3,022 | $ | 2,680 | ||||||
| Emerging Markets Equity ETFs (in millions) |
||||||||||||
| Beginning of period assets |
$ | 7,332 | $ | 6,542 | $ | 3,613 | ||||||
| Inflows/(outflows) |
876 | 515 | 1,398 | |||||||||
| Market appreciation/(depreciation) |
(137 | ) | 275 | 583 | ||||||||
|
|
|
|
|
|
|
|||||||
| End of period assets |
$ | 8,071 | $ | 7,332 | $ | 5,594 | ||||||
|
|
|
|
|
|
|
|||||||
| Average assets during the period |
$ | 7,905 | $ | 6,767 | $ | 4,780 | ||||||
| US Equity ETFs (in millions) |
||||||||||||
| Beginning of period assets |
$ | 4,371 | $ | 4,640 | $ | 3,429 | ||||||
| Inflows/(outflows) |
291 | (205 | ) | 565 | ||||||||
| Market appreciation/(depreciation) |
499 | (64 | ) | 281 | ||||||||
|
|
|
|
|
|
|
|||||||
| End of period assets |
$ | 5,161 | $ | 4,371 | $ | 4,275 | ||||||
|
|
|
|
|
|
|
|||||||
| Average assets during the period |
$ | 4,749 | $ | 4,522 | $ | 3,990 | ||||||
16
| Three Months Ended | ||||||||||||
| March 31, 2013 |
December 31, 2012 |
March 31, 2012 |
||||||||||
| Fixed Income ETFs (in millions) |
||||||||||||
| Beginning of period assets |
$ | 2,118 | $ | 1,904 | $ | 1,506 | ||||||
| Inflows/(outflows) |
508 | 190 | 161 | |||||||||
| Market appreciation/(depreciation) |
(26 | ) | 24 | 68 | ||||||||
|
|
|
|
|
|
|
|||||||
| End of period assets |
$ | 2,600 | $ | 2,118 | $ | 1,735 | ||||||
|
|
|
|
|
|
|
|||||||
| Average assets during the period |
$ | 2,453 | $ | 1,990 | $ | 1,627 | ||||||
| Currency ETFs (in millions) |
||||||||||||
| Beginning of period assets |
$ | 611 | $ | 654 | $ | 950 | ||||||
| Inflows/(outflows) |
12 | (37 | ) | (104 | ) | |||||||
| Market appreciation/(depreciation) |
3 | (6 | ) | 35 | ||||||||
|
|
|
|
|
|
|
|||||||
| End of period assets |
$ | 626 | $ | 611 | $ | 881 | ||||||
|
|
|
|
|
|
|
|||||||
| Average assets during the period |
$ | 637 | $ | 632 | $ | 935 | ||||||
| Alternative Strategy ETFs (in millions) |
||||||||||||
| Beginning of period assets |
$ | 122 | $ | 147 | $ | 277 | ||||||
| Inflows/(outflows) |
(4 | ) | (24 | ) | (23 | ) | ||||||
| Market appreciation/(depreciation) |
2 | (1 | ) | (12 | ) | |||||||
|
|
|
|
|
|
|
|||||||
| End of period assets |
$ | 120 | $ | 122 | $ | 242 | ||||||
|
|
|
|
|
|
|
|||||||
| Average assets during the period |
$ | 118 | $ | 135 | $ | 253 | ||||||
| Average ETF assets during the period |
||||||||||||
| Emerging markets equity ETFs |
36 | % | 39 | % | 33 | % | ||||||
| International developed equity ETFs |
27 | % | 18 | % | 19 | % | ||||||
| US equity ETFs |
22 | % | 26 | % | 28 | % | ||||||
| Fixed income ETFs |
11 | % | 12 | % | 12 | % | ||||||
| Currency ETFs |
3 | % | 4 | % | 7 | % | ||||||
| Alternative strategy ETFs |
1 | % | 1 | % | 1 | % | ||||||
|
|
|
|
|
|
|
|||||||
| Total |
100 | % | 100 | % | 100 | % | ||||||
|
|
|
|
|
|
|
|||||||
| Average ETF advisory fee during the period |
||||||||||||
| Alternative strategy ETFs |
0.94 | % | 0.94 | % | 0.95 | % | ||||||
| Emerging markets equity ETFs |
0.67 | % | 0.67 | % | 0.67 | % | ||||||
| Fixed income ETFs |
0.55 | % | 0.55 | % | 0.55 | % | ||||||
| International developed equity ETFs |
0.52 | % | 0.54 | % | 0.55 | % | ||||||
| Currency ETFs |
0.51 | % | 0.50 | % | 0.49 | % | ||||||
| US equity ETFs |
0.35 | % | 0.35 | % | 0.35 | % | ||||||
|
|
|
|
|
|
|
|||||||
| Blended total |
0.54 | % | 0.54 | % | 0.54 | % | ||||||
|
|
|
|
|
|
|
|||||||
17
Number of ETFs—end of the period
| Three Months Ended | ||||||||||||
| March 31, 2013 |
December 31, 2012 |
March 31, 2012 |
||||||||||
| International developed equity ETFs |
18 | 18 | 18 | |||||||||
| US equity ETFs |
11 | 11 | 12 | |||||||||
| Fixed income ETFs |
6 | 5 | 5 | |||||||||
| Currency ETFs |
5 | 5 | 7 | |||||||||
| Emerging markets equity ETFs |
5 | 5 | 4 | |||||||||
| Alternative strategy ETFs |
2 | 2 | 2 | |||||||||
|
|
|
|
|
|
|
|||||||
| Total |
47 | 46 | 48 | |||||||||
|
|
|
|
|
|
|
|||||||
| Headcount |
72 | 70 | 64 | |||||||||
Note: Previously issued statistics may be restated due to trade adjustments
Source: Investment Company Institute, Bloomberg, WisdomTree
Three Months Ended March 31, 2013 Compared to March 31, 2012
Revenues
| Three Months Ended March 31, |
Change | Percent Change |
||||||||||||||
| 2013 | 2012 | |||||||||||||||
| Average assets under management (in millions) |
$ | 21,934 | $ | 14,265 | $ | 7,669 | 53.8 | % | ||||||||
| Average ETF advisory fee |
0.54 | % | 0.54 | % | — | |||||||||||
| ETF advisory fees (in thousands) |
$ | 29,153 | $ | 18,975 | $ | 10,178 | 53.6 | % | ||||||||
| Other income (in thousands) |
188 | 195 | (7 | ) | (3.6 | %) | ||||||||||
|
|
|
|
|
|
|
|||||||||||
| Total revenues (in thousands) |
$ | 29,341 | $ | 19,170 | $ | 10,171 | 53.1 | % | ||||||||
|
|
|
|
|
|
|
|||||||||||
ETF advisory fees
ETF advisory fees revenue increased 53.6% from $19.0 million in the three months ended March 31, 2012 to $29.2 million in the comparable period in 2013. This increase was primarily due to higher average AUM as a result of record levels of net inflows, in particular, into our Japanese hedged equity ETF. The average fee remained constant at 0.54%.
Other income
Other income remained relatively unchanged at $0.2 million in the three months ended March 31, 2012 and 2013.
Expenses
| Three Months Ended March 31, |
Change | Percent Change |
||||||||||||||
| (in thousands) |
2013 | 2012 | ||||||||||||||
| Compensation and benefits |
$ | 7,482 | $ | 5,857 | $ | 1,625 | 27.7 | % | ||||||||
| Fund management and administration |
8,223 | 5,439 | 2,784 | 51.2 | % | |||||||||||
| Marketing and advertising |
1,937 | 1,326 | 611 | 46.1 | % | |||||||||||
| Sales and business development |
1,801 | 860 | 941 | 109.4 | % | |||||||||||
| Professional and consulting fees |
613 | 1,109 | (496 | ) | (44.7 | %) | ||||||||||
| Occupancy, communication and equipment |
377 | 301 | 76 | 25.2 | % | |||||||||||
| Depreciation and amortization |
82 | 71 | 11 | 15.5 | % | |||||||||||
| Third-party sharing arrangements |
111 | 1,745 | (1,634 | ) | (93.6 | %) | ||||||||||
| Other |
861 | 609 | 252 | 41.4 | % | |||||||||||
| ETF shareholder proxy |
— | 66 | (66 | ) | na | |||||||||||
| Patent litigation, net |
— | 672 | (672 | ) | na | |||||||||||
|
|
|
|
|
|
|
|
|
|||||||||
| Total expenses |
$ | 21,487 | $ | 18,055 | $ | 3,432 | 19.0 | % | ||||||||
|
|
|
|
|
|
|
|
|
|||||||||
18
| Three Months Ended March 31, |
||||||||
| As a Percent of Revenues: |
2013 | 2012 | ||||||
| Compensation and benefits |
25.5 | % | 30.6 | % | ||||
| Fund management and administration |
28.0 | % | 28.4 | % | ||||
| Marketing and advertising |
6.6 | % | 6.9 | % | ||||
| Sales and business development |
6.1 | % | 4.5 | % | ||||
| Professional and consulting fees |
2.1 | % | 5.8 | % | ||||
| Occupancy, communication and equipment |
1.3 | % | 1.6 | % | ||||
| Depreciation and amortization |
0.3 | % | 0.4 | % | ||||
| Third-party sharing arrangements |
0.4 | % | 9.1 | % | ||||
| Other |
2.9 | % | 3.2 | % | ||||
| ETF shareholder proxy |
0.0 | % | 0.3 | % | ||||
| Patent litigation, net |
0.0 | % | 3.4 | % | ||||
|
|
|
|
|
|||||
| Total expenses |
73.2 | % | 94.2 | % | ||||
Compensation and benefits
Compensation and benefits expense increased 27.7% from $5.9 million in the three months ended March 31, 2012 to $7.5 million in the comparable period in 2013. This increase was primarily due to higher accrued incentive compensation due to our record levels of net inflows. Our headcount at March 31, 2012 was 64 compared to 72 at March 31, 2013.
Fund management and administration
Fund management and administration expenses increased 51.2% from $5.4 million in the three months ended March 31, 2012 to $8.2 million in the comparable period in 2013. At the end of 2012, we ended our joint venture with BNY Mellon. As a result, we began to record certain operating costs related to our currency and fixed income ETFs, which were previously recognized by BNY Mellon as part of the joint venture. This resulted in approximately $0.6 million in higher costs. Higher average AUM resulted in a $1.8 million increase in portfolio management, fund administration, accounting, index licensing, regulatory and distribution fees. We also incurred $0.3 million in higher printing related fees due to an increase in the number of holders of our ETFs. We had 47 ETFs at March 31, 2013 compared to 48 at March 31, 2012.
Marketing and advertising
Marketing and advertising expense increased 46.1% from $1.3 million in the three months ended March 31, 2012 to $1.9 million in the comparable period in 2013 primarily due to higher levels of online, print and television advertising to support our growth.
Sales and business development
Sales and business development expense increased 109.4% from $0.9 million in the three months ended March 31, 2012 to $1.8 million in the comparable period in 2013 primarily due to higher levels of sales related initiatives and activities.
Professional and consulting fees
Professional and consulting fees decreased 44.7% from $1.1 million in the three months ended March 31, 2012 to $0.6 million in the comparable period in 2013. This decrease was primarily due to no longer incurring variable stock based compensation for equity awards granted to strategic advisors partly offset by higher corporate consulting and accounting related fees.
Occupancy, communications and equipment expense increased 25.2% from $0.3 million in the three months ended March 31, 2012 to $0.4 million in the comparable period in 2013. Beginning in the second quarter of 2012, we began occupying office space we had previously sub-leased to a third party.
Depreciation and amortization
Depreciation and amortization expense increased 15.5% from $0.07 million in the three months ended March 31, 2012 to $0.08 million in the comparable period in 2013 due to improvements we made to office space we had previously sub-leased to a third party and began occupying.
19
Third-party sharing arrangements
Third-party sharing arrangements decreased 93.6% from $1.7 million in the three months ended March 31, 2012 to $0.1 million in the comparable period in 2013 primarily due to the end of our joint venture with BNY Mellon at the end of 2012.
Other
Other expenses increased 41.4% from $0.6 million in the three months ended March 31, 2012 to $0.9 million in the comparable period in 2013 primarily due to higher general and administrative expenses.
Liquidity and Capital Resources
The following table summarizes key data regarding our liquidity, capital resources and use of capital to fund our operations:
| March 31, 2013 |
December 31, 2012 |
|||||||
| Balance Sheet Data (in thousands): |
||||||||
| Cash and cash equivalents |
$ | 52,297 | $ | 41,246 | ||||
| Investments |
$ | 10,668 | $ | 11,036 | ||||
| Accounts receivable |
$ | 11,098 | $ | 9,348 | ||||
| Total liabilities |
$ | 14,926 | $ | 12,365 | ||||
| Three Months Ended March 31, |
||||||||
| 2013 | 2012 | |||||||
| Cash Flow Data (in thousands): |
||||||||
| Operating cash flows |
$ | 10,244 | $ | 2,680 | ||||
| Investing cash flows |
309 | (1,119 | ) | |||||
| Financing cash flows |
498 | 4,947 | ||||||
|
|
|
|
|
|||||
| Increase in cash and cash equivalents |
$ | 11,051 | $ | 6,508 | ||||
|
|
|
|
|
|||||
Liquidity
We consider our available liquidity to be our liquid assets less our liabilities. Liquid assets consist of cash and cash equivalents, current receivables and investments. We account for investments as held to maturity securities and have the intention and ability to hold to maturity. However, if needed, such investments could be redeemed for liquidity. Cash and cash equivalents include cash on hand and non-interest-bearing and interest-bearing deposits with financial institutions. Accounts receivable primarily represents advisory fees we earn from the WisdomTree ETFs which is collected by the fifth business day of the month following the month earned. Investments represent debt instruments of U.S. government and agency securities. Our liabilities consist primarily of payments owed to vendors and third parties in the normal course of business as well as accrued year end incentive compensation for employees.
Cash and cash equivalents increased to $52.3 million at March 31, 2013 primarily due to $10.2 million of cash flow from operations due to our strong results, $0.7 million received from the proceeds from employees exercising stock options, $1.6 million of cash received from the redemption of investments, partly offset by $1.3 million used to purchase new investments.
Capital Resources
Currently, our principal source of financing is our operating cash flows, though historically, our principal source of financing was through the private placement of our common stock. We believe that current cash flows generated by our operating activities should be sufficient for us to fund our operations for at least the next 12 months.
Use of Capital
Our business does not require us to maintain a significant cash position. We expect that our main uses of cash will be to fund the ongoing operations of our business, invest in strategic growth initiatives, re-acquire shares of our common stock issued to our employees as incentive compensation as discussed below or expand our business through strategic acquisitions.
20
During the first three months of 2013, we repurchased 28,659 shares from our employees at then current market prices at a cost of $0.2 million in connection with tax withholding upon vesting of restricted stock. The amount repurchased represented the required amount of tax withholding. We expect to continue purchasing shares for similar reasons.
Contractual Obligations
The following table summarizes our future cash payments associated with contractual obligations as of March 31, 2013.
| Payments Due by Period | ||||||||||||||||||||
| (in thousands) | ||||||||||||||||||||
| Total | Less than 1 year |
1 to 3 years | 3 to 5 years | More than 5 years |
||||||||||||||||
| Operating leases |
$ | 1,268 | $ | 1,049 | $ | 219 | — | — | ||||||||||||
Our office space lease expires in January 2014 and we have begun to search for new office space and as such expect these costs to increase in the future.
Off-Balance Sheet Arrangements
Other than operating leases, which are included in the table above, we do not have any off-balance sheet financing or other arrangements. We have neither created nor are party to any special-purpose or off-balance sheet entities for the purpose of raising capital, incurring debt or operating our business.
Critical Accounting Policies
Stock-Based Compensation
Stock-based compensation expense reflects the fair value of stock-based awards measured at grant date and is recognized over the relevant service period. The fair value of each option award is estimated on the date of grant using the Black-Scholes option valuation model. The Black-Scholes option valuation model we use includes the input of certain variables that are dependent on future expectations, including the expected lives of our options from grant date to exercise date, the volatility of our underlying common shares in the market over that time period, the rate of dividends that we may pay during that time and an appropriate risk-free interest rate. Many of these assumptions require management’s judgment. If actual experience differs significantly from these estimates, stock-based compensation expense and our results of operations could be materially affected.
Income and Deferred Taxes
We recognize an asset or liability for the deferred tax consequences of temporary differences between the tax basis of assets and liabilities and their reported amounts in the financial statements. These temporary differences will result in taxable or deductible amounts in future years when the reported amounts of assets are recovered or liabilities are settled. A valuation allowance is recorded to reduce the carrying values of deferred tax assets and liabilities to the amount that is more likely than not to be realized. As of March 31, 2013, we have net operating loss carry forwards and we have recognized a deferred tax asset for such carry forwards. Given the significant losses we have incurred since we began our operations, a valuation allowance has been recorded for the full amount of the deferred tax asset.
Recently Issued Accounting Pronouncements
None.
21
| ITEM 3. | QUANTITATIVE AND QUALITATIVE DISCLOSURES ABOUT MARKET RISK |
In the normal course of business, our financial results are subject to market risk. Market risk to us generally represents the risk of changes in the value of financial instruments held in the portfolios of the WisdomTree ETFs that generally results from fluctuations in equity prices, foreign currency exchange rates against the U.S. dollar, and interest rates. Nearly all of our revenue is derived from advisory agreements for the WisdomTree ETFs. Under these agreements, the advisory fee we receive is based on the market value of the assets in the WisdomTree ETF portfolios we manage.
Fluctuations in the value of these securities are common and are generated by numerous factors such as market volatility, the overall economy, inflation, changes in investor strategies, availability of alternative investment vehicles, government regulations and others. Accordingly changes in any one or a combination of these factors may reduce the value of investment securities and, in turn, the underlying assets under management on which our revenues are earned. These declines may cause investors to withdraw funds from our ETFs in favor of investments that they perceive as offering greater opportunity or lower risk, thereby compounding the impact on our revenues. We believe challenging and volatile market conditions will continue to be present in the foreseeable future.
In order to maximize yields, we invest our corporate cash in short-term interest earning assets, primarily money market instruments at a commercial bank and U.S. government and agency debt instruments which totaled $52.3 million and $41.2 million as of March 31, 2013 and December 31, 2012, respectively. We do not anticipate that changes in interest rates will have a material impact on our financial condition, operating results or cash flows.
| ITEM 4. | CONTROLS AND PROCEDURES |
Evaluation of Disclosure Controls and Procedures
As of March 31, 2013, our management, with the participation of our Chief Executive Officer and our Executive Vice President—Finance and Chief Financial Officer, evaluated the effectiveness of our disclosure controls and procedures pursuant to Rule 13a-15(b) promulgated under the Securities Exchange Act of 1934, as amended, or the “Exchange Act”. Based upon that evaluation, our Chief Executive Officer and our Executive Vice President—Finance and Chief Financial Officer concluded that, as of March 31, 2013, our disclosure controls and procedures were effective at a reasonable assurance level in ensuring that material information required to be disclosed by us in the reports that we file or submit under the Exchange Act is recorded, processed, summarized and reported within the time periods specified in the rules, regulations and forms of the Securities and Exchange Commission, or the SEC, including ensuring that such material information is accumulated by and communicated to our management, including our Chief Executive Officer and our Executive Vice President—Finance and Chief Financial Officer, as appropriate to allow timely decisions regarding required disclosure.
Changes in Internal Control over Financial Reporting
During the quarter ended March 31, 2013, there were no changes in our internal control over financial reporting that have materially affected, or are reasonably likely to materially affect, our internal control over financial reporting.
| ITEM 1. | LEGAL PROCEEDINGS |
None.
| ITEM 1A. | RISK FACTORS |
In addition to the other information set forth below and elsewhere in this report, you should carefully consider the information set forth in Part 1, Item 1A. “Risk Factors” in our Annual Report on Form 10-K for the fiscal year ended December 31, 2012.
A significant portion of our assets under management are held in a single ETF that invests in Japanese companies and which hedges exposure to the Japanese Yen and we therefore have substantial exposure to Japan’s market conditions and are subject to risks associated with the Yen’s currency exchange rate.
At April 30, 2013, approximately $7.7 billion of our AUM, or 27.5%, was concentrated in our WisdomTree Japan Hedged Equity Fund, which invests solely in the securities of Japanese companies and hedges exposure to the Japanese Yen as against the U.S. Dollar. This fund has grown rapidly since December 31, 2012, when its AUM was approximately $1.2 billion. Therefore, to a significant extent, our near term operating results are particularly exposed to the performance of this fund, future fluctuations in the currency exchange rate of the Yen and investor sentiment concerning expected directional movement of the Yen, economic and market conditions in Japan and investor sentiment regarding future growth in Japan’s market. A strengthening of the Yen against the U.S. Dollar could result in investor redemptions thus reducing revenue.
22
| ITEM 2. | UNREGISTERED SALES OF EQUITY SECURITIES AND USE OF PROCEEDS |
Recent sales of Unregistered Securities
None.
Use of Proceeds
Not applicable.
Purchase of Equity Securities by the Issuer and Affiliated Purchasers
The following table provides information with respect to purchases made by or on behalf of the Company or any “affiliated purchaser” of shares of the Company’s common stock.
| (In thousands, except per share data) | ||||||||||||||||
| Period |
Total Number of Shares Purchased(1) |
Average Price Paid Per Share(1) |
Total Number of Shares Purchased as Part of Publicly Announced Plans or Programs |
Approximate Dollar Value of Shares that May Yet Be Purchased Under the Plans or Programs |
||||||||||||
| January 1, 2013 to January 31, 2013 |
28,659 | $ | 8.68 | — | $ | — | ||||||||||
| February 1, 2013 to February 28, 2013 |
— | $ | — | — | $ | — | ||||||||||
| March 1, 2013 to March 31, 2013 |
— | $ | — | — | $ | — | ||||||||||
|
|
|
|
|
|||||||||||||
| Total |
28,659 | $ | 8.68 | — | $ | — | ||||||||||
|
|
|
|
|
|||||||||||||
| (1) | The identified shares reflect restricted shares withheld pursuant to the terms of awards granted to employees to offset tax withholding obligations that occur upon vesting and release of the restricted share. The value of the shares withheld is based upon the volume weighted average price of the common stock on the date of vesting. During the three months ended March 31, 2013, the Company repurchased 28,659 restricted shares of Company stock withheld pursuant to the terms of awards granted to employees to offset tax withholding obligations for an aggregate price of $248,608 with an average price per share of $8.68. |
| ITEM 3. | DEFAULTS UPON SENIOR SECURITIES |
None.
| ITEM 4. | MINE SAFETY DISCLOSURE |
Not applicable.
23
| ITEM 6. | EXHIBITS |
| Exhibit |
Description |
Reference Exhibit No. | ||||
| 3.1 | (1) | Form of Amended and Restated Certificate of Incorporation. | 3.1 | |||
| 3.2 | (1) | Amended and Restated Bylaws. | 3.2 | |||
| 4.1 | (1) | Specimen Common Stock Certificate. | 4.1 | |||
| 4.2 | (1) | Amended and Restated Stockholders Agreement among Registrant and certain investors dated December 21, 2006. | 4.2 | |||
| 4.3 | (1) | Securities Purchase Agreement among Registrant and certain investors dated December 21, 2006. | 4.3 | |||
| 4.4 | (1) | Securities Purchase Agreement among Registrant and certain investors dated October 15, 2009. | 4.4 | |||
| 4.5 | (1) | Third Amended and Restated Registration Rights Agreement dated October 15, 2009.
|
4.5
| |||
| 31.1 | (2) | Certification of Chief Executive Officer and Principal Executive Officer pursuant to Rules 13a-14 of the Exchange Act. | ||||
| 31.2 | (2) | Certification of Chief Financial Officer and Principal Accounting Officer pursuant to Rules 13a-14 of the Exchange Act. | ||||
| 32 | (2) | Section 1350 Certification. | ||||
| 101.INS | (2)* | XBRL Instance Document | ||||
| 101.SCH | (2)* | XBRL Taxonomy Extension Schema Document | ||||
| 101.CAL | (2)* | XBRL Taxonomy Extension Calculation Linkbase Document | ||||
| 101.DEF | (2)* | XBRL Taxonomy Extension Definition Linkbase Document | ||||
| 101.LAB | (2)* | XBRL Taxonomy Extension Labels Linkbase Document | ||||
| 101.PRE | (2)* | XBRL Taxonomy Extension Presentation Linkbase Document | ||||
| (1) | Incorporated by reference from the Registrant’s Registration Statement on Form 10, filed with the SEC on March 31, 2011. |
| (2) | Filed herewith |
| * | Pursuant to Rule 406T, the interactive data files in Exhibit 101 hereto are deemed not filed or a part of a registration statement or prospectus for purposes of Section 11 or 12 of the Securities Act of 1933, as amended, are deemed not filed for purposes of Section 18 of the Securities Exchange Act of 1934, as amended, and otherwise is not subject to liability under these sections and shall not be incorporated by reference into any registration statement or other document filed under the Securities Act of 1933, as amended, except as expressly set forth by specific reference in such filing. |
24
SIGNATURE
Pursuant to the requirements of the Securities Exchange Act of 1934, the registrant has duly caused this Report to be signed on its behalf by the undersigned thereunto duly authorized on this 10th day of May, 2013.
| WISDOMTREE INVESTMENTS, INC. | ||
| By: |
/s/ JONATHAN STEINBERG | |
| Jonathan Steinberg | ||
| Chief Executive Officer | ||
| (Authorized Officer and Principal Executive Officer) | ||
| WISDOMTREE INVESTMENTS, INC. | ||
| By: | /S/ AMIT MUNI | |
| Amit Muni | ||
|
Executive Vice President— (Authorized Officer and Principal Financial and Accounting Officer) | ||
25