UNITED STATES
SECURITIES AND EXCHANGE COMMISSION
Washington, D.C. 20549
Form 10-Q
(Mark One)
| x | QUARTERLY REPORT PURSUANT TO SECTION 13 OR 15(d) OF THE SECURITIES EXCHANGE ACT OF 1934 |
For the quarterly period ended September 30, 2014
or
| ¨ | TRANSITION REPORT PURSUANT TO SECTION 13 OR 15(d) OF THE SECURITIES EXCHANGE ACT OF 1934 |
For the transition period from to .
Commission File Number 001-10932
WisdomTree Investments, Inc.
(Exact name of registrant as specified in its charter)
| Delaware | 13-3487784 | |
| (State or other jurisdiction of incorporation or organization) |
(IRS Employer Identification No.) | |
|
245 Park Avenue, 35th Floor New York, New York |
10167 | |
| (Address of principal executive officers) | (Zip Code) |
212-801-2080
(Registrant’s Telephone Number, Including Area Code)
Indicate by check mark whether the registrant (1) has filed all reports required to be filed by Section 13 or 15(d) of the Securities Exchange Act of 1934, as amended (the “Exchange Act”) during the preceding 12 months (or for such shorter period that the registrant was required to file such reports), and (2) has been subject to such filing requirements for the past 90 days. Yes x No ¨
Indicate by check mark whether the registrant has submitted electronically and posted on its corporate Web site, if any, every Interactive Data File required to be submitted and posted pursuant to Rule 405 of Regulation S-T (§232.405 of this chapter) during the preceding 12 months (or for such shorter period that the registrant was required to submit and post such files). x Yes ¨ No
Indicate by check mark whether the registrant is a large accelerated filer, an accelerated filer, a non-accelerated filer or a smaller reporting company. See definitions of “large accelerated filer,” “accelerated filer” and “smaller reporting company” in Rule 12b-2 of the Exchange Act.
| Large accelerated filer | x | Accelerated filer | ¨ | |||
| Non-accelerated filer | ¨ | Smaller reporting company | ¨ | |||
Indicate by check mark whether the registrant is a shell company (as defined in Rule 12b-2 of the Exchange Act). Yes ¨ No x
As of October 31, 2014, there were 133,492,949 shares of the registrant’s Common Stock, $0.01 par value per share, outstanding (voting shares).
Form 10-Q
For the Quarterly Period Ended September 30, 2014
TABLE OF CONTENTS
2
CAUTIONARY NOTE REGARDING FORWARD-LOOKING STATEMENTS
This Quarterly Report on Form 10-Q contains forward-looking statements that are based on our management’s belief and assumptions and on information currently available to our management. Although we believe that the expectations reflected in these forward-looking statements are reasonable, these statements relate to future events or our future financial performance, and involve known and unknown risks, uncertainties and other factors that may cause our actual results, levels of activity, performance or achievements to be materially different from any future results, levels of activity, performance or achievements expressed or implied by these forward-looking statements.
In some cases, you can identify forward-looking statements by terminology such as “may,” “will,” “should,” “expects,” “intends,” “plans,” “anticipates,” “believes,” “estimates,” “predicts,” “potential,” “continue” or the negative of these terms or other comparable terminology. These statements are only predictions. You should not place undue reliance on forward-looking statements because they involve known and unknown risks, uncertainties and other factors, which are, in some cases, beyond our control and which could materially affect results. Factors that may cause actual results to differ materially from current expectations include, among other things, those listed in the section entitled “Risk Factors” included in this Report and in our Annual Report on Form 10-K for the fiscal year ended December 31, 2013. If one or more of these risks or uncertainties occur, or if our underlying assumptions prove to be incorrect, actual events or results may vary significantly from those implied or projected by the forward-looking statements. No forward-looking statement is a guarantee of future performance. You should read this Report and the documents that we reference in this Report and have filed with the Securities and Exchange Commission (“SEC”) as exhibits to this Report, completely and with the understanding that our actual future results may be materially different from any future results expressed or implied by these forward-looking statements.
In particular, forward-looking statements in this Report include statements about:
| • | anticipated trends, conditions and investor sentiment in the global markets and exchange traded products (“ETPs”); |
| • | anticipated levels of inflows into and outflows out of our ETPs; |
| • | our ability to deliver favorable rates of return to investors; |
| • | our ability to develop new products and services; |
| • | our ability to maintain current vendors or find new vendors to provide services to us at favorable costs; |
| • | our ability to successfully expand our business into non-U.S. markets; |
| • | timing of payment of our cash income taxes; |
| • | competition in our business; and |
| • | the effect of laws and regulations that apply to our business. |
The forward-looking statements in this Report represent our views as of the date of this Report. We anticipate that subsequent events and developments may cause our views to change. However, while we may elect to update these forward-looking statements at some point in the future, we have no current intention of doing so except to the extent required by applicable law. Therefore, these forward-looking statements do not represent our views as of any date other than the date of this Report.
3
| ITEM 1. | FINANCIAL STATEMENTS |
WisdomTree Investments, Inc. and Subsidiaries
Consolidated Balance Sheets
(In Thousands, Except Per Share Amounts)
| September 30, 2014 |
December 31, 2013 |
|||||||
| (Unaudited) | ||||||||
| Assets |
||||||||
| Current assets: |
||||||||
| Cash and cash equivalents |
$ | 151,287 | $ | 104,316 | ||||
| Accounts receivable |
16,268 | 18,100 | ||||||
| Other current assets |
2,208 | 1,320 | ||||||
|
|
|
|
|
|||||
| Total current assets |
169,763 | 123,736 | ||||||
| Fixed assets, net |
10,263 | 6,252 | ||||||
| Investments |
12,224 | 11,748 | ||||||
| Deferred tax asset, net |
8,253 | — | ||||||
| Goodwill |
1,676 | — | ||||||
| Other noncurrent assets |
56 | 55 | ||||||
|
|
|
|
|
|||||
| Total assets |
$ | 202,235 | $ | 141,791 | ||||
|
|
|
|
|
|||||
| Liabilities and stockholders’ equity |
||||||||
| Liabilities: |
||||||||
| Current liabilities: |
||||||||
| Fund management and administration payable |
$ | 8,833 | $ | 10,394 | ||||
| Compensation and benefits payable |
7,062 | 14,278 | ||||||
| Accounts payable and other liabilities |
4,956 | 4,384 | ||||||
|
|
|
|
|
|||||
| Total current liabilities |
20,851 | 29,056 | ||||||
| Acquisition payable |
1,757 | — | ||||||
| Deferred rent payable |
5,326 | 3,706 | ||||||
|
|
|
|
|
|||||
| Total liabilities |
27,934 | 32,762 | ||||||
|
|
|
|
|
|||||
| Stockholders’ equity: |
||||||||
| Preferred stock, par value $0.01; 2,000 shares authorized |
— | — | ||||||
| Common stock, par value $0.01; 250,000 shares authorized; issued: 133,516 and 132,247; outstanding: 131,947 and 130,350 |
1,335 | 1,322 | ||||||
| Additional paid-in capital |
198,040 | 184,201 | ||||||
| Accumulated other comprehensive loss |
(9 | ) | — | |||||
| Accumulated deficit |
(25,065 | ) | (76,494 | ) | ||||
|
|
|
|
|
|||||
| Total stockholders’ equity |
174,301 | 109,029 | ||||||
|
|
|
|
|
|||||
| Total liabilities and stockholders’ equity |
$ | 202,235 | $ | 141,791 | ||||
|
|
|
|
|
|||||
The accompanying notes are an integral part of these consolidated financial statements.
4
WisdomTree Investments, Inc. and Subsidiaries
Consolidated Statements of Operations and Comprehensive Income
(In Thousands, Except Per Share Amounts)
(Unaudited)
| Three Months Ended | Nine Months Ended | |||||||||||||||
| September 30, 2014 |
September 30, 2013 |
September 30, 2014 |
September 30, 2013 |
|||||||||||||
| Revenues: |
||||||||||||||||
| Advisory fees |
$ | 46,942 | $ | 39,437 | $ | 133,489 | $ | 105,691 | ||||||||
| Other income |
172 | 193 | 673 | 611 | ||||||||||||
|
|
|
|
|
|
|
|
|
|||||||||
| Total revenues |
47,114 | 39,630 | 134,162 | 106,302 | ||||||||||||
| Expenses: |
||||||||||||||||
| Compensation and benefits |
9,990 | 9,648 | 26,896 | 26,577 | ||||||||||||
| Fund management and administration |
8,465 | 8,794 | 25,451 | 26,123 | ||||||||||||
| Marketing and advertising |
3,341 | 2,031 | 8,645 | 6,164 | ||||||||||||
| Sales and business development |
1,279 | 1,305 | 4,307 | 4,626 | ||||||||||||
| Professional and consulting fees |
1,383 | 542 | 5,018 | 1,812 | ||||||||||||
| Occupancy, communications, and equipment |
882 | 723 | 2,635 | 1,691 | ||||||||||||
| Depreciation and amortization |
207 | 84 | 600 | 249 | ||||||||||||
| Third-party sharing arrangements |
187 | 374 | 312 | 913 | ||||||||||||
| Other |
1,123 | 1,164 | 3,429 | 3,086 | ||||||||||||
|
|
|
|
|
|
|
|
|
|||||||||
| Total expenses |
26,857 | 24,665 | 77,293 | 71,241 | ||||||||||||
|
|
|
|
|
|
|
|
|
|||||||||
| Income before taxes |
20,257 | 14,965 | 56,869 | 35,061 | ||||||||||||
| Income tax |
9,634 | — | 5,440 | — | ||||||||||||
|
|
|
|
|
|
|
|
|
|||||||||
| Net income |
$ | 10,623 | $ | 14,965 | $ | 51,429 | $ | 35,061 | ||||||||
|
|
|
|
|
|
|
|
|
|||||||||
| Net income per share—basic |
$ | 0.08 | $ | 0.12 | $ | 0.39 | $ | 0.28 | ||||||||
|
|
|
|
|
|
|
|
|
|||||||||
| Net income per share—diluted |
$ | 0.08 | $ | 0.11 | $ | 0.37 | $ | 0.25 | ||||||||
|
|
|
|
|
|
|
|
|
|||||||||
| Weighted-average common shares—basic |
131,778 | 126,509 | 131,418 | 125,909 | ||||||||||||
|
|
|
|
|
|
|
|
|
|||||||||
| Weighted-average common shares—diluted |
138,346 | 140,097 | 138,476 | 139,805 | ||||||||||||
|
|
|
|
|
|
|
|
|
|||||||||
| Other comprehensive income |
||||||||||||||||
| Net income |
$ | 10,623 | $ | 14,965 | $ | 51,429 | $ | 35,061 | ||||||||
| Foreign currency translation adjustment |
(9 | ) | — | (9 | ) | — | ||||||||||
|
|
|
|
|
|
|
|
|
|||||||||
| Comprehensive income |
$ | 10,614 | $ | 14,965 | $ | 51,420 | $ | 35,061 | ||||||||
|
|
|
|
|
|
|
|
|
|||||||||
The accompanying notes are an integral part of these consolidated financial statements.
5
WisdomTree Investments, Inc. and Subsidiaries
Consolidated Statements of Cash Flows
(In Thousands)
(Unaudited)
| Nine Months Ended | ||||||||
| September 30, 2014 |
September 30, 2013 |
|||||||
| Cash flows from operating activities: |
||||||||
| Net income |
$ | 51,429 | $ | 35,061 | ||||
| Non-cash items included in net income: |
||||||||
| Income tax |
5,396 | — | ||||||
| Depreciation and amortization |
600 | 249 | ||||||
| Stock-based compensation |
6,122 | 5,186 | ||||||
| Deferred rent |
1,620 | 111 | ||||||
| Accretion to interest income and other |
(76 | ) | 108 | |||||
| Changes in operating assets and liabilities: |
||||||||
| Accounts receivable |
2,049 | (3,683 | ) | |||||
| Other assets |
(811 | ) | (720 | ) | ||||
| Fund management and administration payable |
(1,579 | ) | 3,697 | |||||
| Compensation and benefits payable |
(7,510 | ) | 7,235 | |||||
| Accounts payable and other liabilities |
(590 | ) | 471 | |||||
|
|
|
|
|
|||||
| Net cash provided by operating activities |
56,650 | 47,715 | ||||||
| Cash flows from investing activities: |
||||||||
| Purchase of fixed assets |
(4,580 | ) | (1,118 | ) | ||||
| Purchase of investments |
(1,384 | ) | (3,358 | ) | ||||
| Cash acquired on acquisition |
1,349 | — | ||||||
| Proceeds from the redemption of investments |
868 | 2,693 | ||||||
|
|
|
|
|
|||||
| Net cash used in investing activities |
(3,747 | ) | (1,783 | ) | ||||
| Cash flows from financing activities: |
||||||||
| Shares repurchased |
(6,259 | ) | (1,413 | ) | ||||
| Proceeds from exercise of stock options |
341 | 1,349 | ||||||
|
|
|
|
|
|||||
| Net cash used in financing activities |
(5,918 | ) | (64 | ) | ||||
| Decrease in cash flows due to changes in foreign exchange rate |
(14 | ) | — | |||||
|
|
|
|
|
|||||
| Net increase in cash and cash equivalents |
46,971 | 45,868 | ||||||
| Cash and cash equivalents—beginning of period |
104,316 | 41,246 | ||||||
|
|
|
|
|
|||||
| Cash and cash equivalents—end of period |
$ | 151,287 | $ | 87,114 | ||||
|
|
|
|
|
|||||
| Supplemental disclosure of cash flow information: |
||||||||
| Cash paid for taxes |
$ | 66 | $ | 33 | ||||
|
|
|
|
|
|||||
The accompanying notes are an integral part of these consolidated financial statements.
6
WisdomTree Investments, Inc. and Subsidiaries
Notes to Consolidated Financial Statements
(In Thousands, Except Share and Per Share Amounts)
| 1. | Organization and Description of Business |
WisdomTree Investments, Inc., through its subsidiaries in the U.S., U.K., Jersey and Ireland (collectively, “WisdomTree” or the “Company”), is an ETP sponsor and asset manager headquartered in New York. WisdomTree offers ETPs covering equity, fixed income, currency, alternative and commodity asset classes. The Company has the following operating subsidiaries:
| • | WisdomTree Asset Management, Inc. (“WTAM”) is a New York based investment adviser registered with the SEC providing investment advisory and other management services to WisdomTree Trust (“WTT”) and WisdomTree exchange traded funds (“ETFs”). |
| • | Boost Management Limited (“BML” or “Boost”) is a Jersey based investment manager providing investment and other management services to Boost Issuer PLC (“BI”) and Boost ETPs. |
| • | WisdomTree Europe Limited (“WisdomTree Europe”) is a U.K. based company registered with the Financial Conduct Authority providing management and other services to BML and WTML. |
| • | WisdomTree Management Limited (“WTML”) is an Ireland based investment manager providing investment and other management services to WisdomTree Issuer PLC (“WTI”) and WisdomTree UCITS ETFs. |
The WisdomTree ETFs are issued in the U.S. by WTT. WTT, a non-consolidated third party, is a Delaware statutory trust registered with the SEC as an open-end management investment company. The Company has licensed the use of certain of its own indexes on an exclusive basis in the U.S. to WTT for the WisdomTree ETFs. The Boost ETPs are issued by BI. BI, a non-consolidated third party, is a public limited company organized in Ireland. The WisdomTree UCITS ETFs are issued by WTI. WTI, a non-consolidated third party, is a public limited company organized in Ireland.
The Board of Trustees and Board of Directors of WTT, BI and WTI, respectively, are separate from the Board of Directors of the Company. The Trustees and Directors of WTT, BI and WTI respectively, are primarily responsible for overseeing the management and affairs of the WisdomTree ETFs, Boost ETPs and the WisdomTree UCITS ETFs for the benefit of the WisdomTree ETF, Boost ETP and the WisdomTree UCITS ETF shareholders, respectively, and have contracted with the Company to provide for general management and administration services. The Company, in turn, has contracted with third parties to provide the majority of these administration services. In addition, certain officers of the Company provide general management services for WTT, BI and WTI.
| 2. | Significant Accounting Policies |
Basis of Presentation
These consolidated financial statements have been prepared in conformity with U.S. generally accepted accounting principles (“GAAP”) and in the opinion of management reflect all adjustments, consisting of only normal recurring adjustments, necessary for a fair statement of financial condition, results of operations, and cash flows for the periods presented. The consolidated financial statements include the accounts of the Company’s wholly owned subsidiaries.
All intercompany accounts and transactions have been eliminated in consolidation. Certain accounts in the prior years’ consolidated financial statements have been reclassified to conform to the current year’s consolidated financial statements presentation. These reclassifications had no effect on the previously reported operating results.
Foreign Currency Translation
Assets and liabilities of subsidiaries whose functional currency is not the U.S. dollar are translated based on the end of period exchange rates from local currency to U.S. dollars. Results of operations are translated at the average exchange rates in effect during the period.
7
Use of Estimates
The preparation of the Company’s consolidated financial statements in conformity with U.S. GAAP requires management to make estimates and assumptions that affect the reported amounts of assets and liabilities as of the balance sheet dates and the reported amounts of revenues and expenses for the periods presented. Actual results could differ materially from those estimates.
Revenue Recognition
The Company earns investment advisory fees as well as licensing fees from third parties. Advisory fees are based on a percentage of the ETPs average daily net assets and recognized over the period the related service is provided. Licensing fees are based on a percentage of the average monthly net assets and recognized over the period the related service is provided.
Depreciation and Amortization
Depreciation is provided for using the straight-line method over the estimated useful lives of the related assets as follows:
| Equipment |
5 years | |||
| Furniture and fixtures |
15 years |
Leasehold improvements are amortized over the term of their respective leases or service lives of the improvements, whichever is shorter. Fixed assets are stated at cost less accumulated depreciation and amortization.
Marketing and Advertising
Advertising costs, including media advertising and production costs are expensed when incurred.
Cash and Cash Equivalents
The Company considers all highly liquid investments with an original maturity of 90 days or less at the time of purchase to be classified as cash equivalents. Cash and cash equivalents are held primarily with one large financial institution.
Accounts Receivable and Allowance for Doubtful Accounts
Accounts receivable are customer and other obligations due under normal trade terms. An allowance for doubtful accounts is not provided since, in the opinion of management, all accounts receivable recorded are deemed collectible.
Impairment of Long-Lived Assets
On a periodic basis, the Company performs a review for the impairment of long-lived assets when events or changes in circumstances indicate that the estimated undiscounted future cash flows expected to be generated by the assets are less than their carrying amounts or when other events occur which may indicate that the carrying amount of an asset may not be recoverable.
Earnings per Share
Basic earnings per share is computed by dividing net income available to common stockholders by the weighted-average number of common shares outstanding for the period. Diluted earnings per share reflects the reduction in earnings per share assuming options or other contracts to issue common stock were exercised or converted into common stock.
Investments
The Company accounts for all of its investments as held-to-maturity, which are recorded at amortized cost. For held-to-maturity investments, the Company has the intent and ability to hold investments to maturity and it is not more-likely-than-not that the Company will be required to sell the investments before recovery of their amortized cost bases, which may be maturity.
On a periodic basis, the Company reviews its portfolio of investments for impairment. If a decline in fair value is deemed to be other-than-temporary, the security is written down to its fair value through earnings.
8
Goodwill
Goodwill is the excess of the fair value of the purchase price over the fair values of the identifiable net assets at the acquisition date. The Company tests its goodwill for impairment at least annually. An impairment loss is triggered if the estimated fair value of the operating reporting unit is less than the estimated net book value. Such loss is calculated as the difference between the estimated fair value of goodwill and its carrying value.
Stock-Based Awards
Accounting for stock-based compensation requires the measurement and recognition of compensation expense for all equity awards based on estimated fair values. The Company accounts for stock-based compensation for its employees based on the cost of employee services received in exchange for a stock-based award. Stock-based compensation is measured based on the grant-date fair value of the award and are amortized over the relevant service period.
Stock-based awards granted to non-employees for goods or services are valued at the fair value of the equity instruments issued or the fair value of consideration received, whichever is a more reliable measure of the fair value of the transaction, and recognized when performance obligations are complete.
Income Taxes
The Company accounts for income taxes using the liability method, which requires the determination of deferred tax assets and liabilities based on the differences between the financial and tax basis of assets and liabilities using the enacted tax rates in effect for the year in which differences are expected to reverse. Deferred tax assets are adjusted by a valuation allowance if, based on the weight of available evidence, it is more-likely-than-not that some portion or all of the deferred tax assets will not be realized.
In order to recognize and measure any unrecognized tax benefits, management evaluates and determines whether any of its tax positions are more-likely-than-not to be sustained upon examination, including resolution of any related appeals or litigation processes, based on the technical merits of the position. Once it is determined that a position meets this recognition threshold, the position is measured to determine the amount of benefit to be recognized in the consolidated financial statements.
The Company records interest expense and penalties related to tax expenses as income tax expense.
Related Party Transactions
The Company’s primary revenues and the majority of its expenses are associated with providing investment advisory services to WTT and WisdomTree ETFs. The Trustees of WTT are primarily responsible for overseeing the management and affairs of the WisdomTree ETFs and WTT for the benefit of the WisdomTree ETF shareholders and WTT has contracted with the Company to provide for general management and administration of WTT and the WisdomTree ETFs. Certain officers of the Company also provide general management oversight of WTT; however, these officers have no material decision making responsibilities and primarily implement the decisions of the Trustees of WTT. The Company has granted WTT an exclusive license to certain of its indexes for operation of the WisdomTree ETFs and is also responsible for certain expenses of WTT, including the cost of transfer agency, custody, fund administration and accounting, legal, audit, and other non-distribution services, excluding extraordinary expenses, taxes and certain other expenses. In exchange, the Company receives fees based on a percentage of the ETF average daily net assets. The advisory agreements may be terminated by WTT upon notice. At September 30, 2014 and December 31, 2013, the balance of accounts receivable from WTT was approximately $15,471 and $14,791, respectively, which are included as a component of accounts receivable on the Company’s Consolidated Balance Sheet. Revenue from advisory services provided to WTT for the three months ended September 30, 2014 and 2013 was approximately $46,660 and $39,437, respectively, and for the nine months ended September 30, 2014 and 2013 was approximately $133,022 and $105,691, respectively.
Revenue from advisory fee services provided to BI for three months ended September 30, 2014 was approximately $282 and for the period from April 15, 2014 to September 30, 2014 was approximately $467.
9
Third Party Sharing Arrangements
Third party sharing arrangements expense consists of payments for marketing agreements with third parties.
Segment, Geographic and Customer Information
The Company operates as a single business segment as an ETP sponsor and asset manager providing investment advisory services. As of and for the three and nine months ended September 30, 2014, substantially all of the Company’s revenues, pretax income and assets are derived or located in the U.S. The Company maintains operations in Europe through its acquisition of Boost, now known as WisdomTree Europe (Note 10).
Recently Issued Accounting Pronouncements
In May 2014, the FASB issued Accounting Standards Update 2014-09 (ASU 2014-09) Revenue from Contracts with Customers, which is a new comprehensive revenue recognition standard on the financial reporting requirements for revenue from contracts entered into with customers. ASU 2014-09 is effective for interim and annual periods beginning after December 15, 2016. The Company is currently assessing the potential impact of the adoption of this guidance on its consolidated financial statements.
Business Combinations
The Company includes the results of operations of the businesses that it acquires from the respective dates of acquisition. The fair values of the purchase price of the acquisitions are allocated to the assets acquired and liabilities assumed based on their estimated fair values. The excess of the fair value of purchase price over the fair values of these identifiable assets and liabilities is recorded as goodwill.
Subsequent Events
The Company has evaluated subsequent events after the date of the consolidated financial statements to consider whether or not the impact of such events needed to be reflected or disclosed in the consolidated financial statements. Such evaluation was performed through the issuance date of the consolidated financial statements.
| 3. | Investments and Fair Value Measurements |
The following table summarizes the Company’s held-to-maturity investments:
| September 30, 2014 | December 31, 2013 | |||||||
| Federal agency debt instruments |
$ | 12,224 | $ | 11,748 | ||||
|
|
|
|
|
|||||
The following table summarizes unrealized gains, losses, and fair value of held-to-maturity investments:
| September 30, 2014 | December 31, 2013 | |||||||
| Cost/amortized cost |
$ | 12,224 | $ | 11,748 | ||||
| Gross unrealized gains |
80 | 20 | ||||||
| Gross unrealized losses |
(650 | ) | (1,459 | ) | ||||
|
|
|
|
|
|||||
| Fair value |
$ | 11,654 | $ | 10,309 | ||||
|
|
|
|
|
|||||
The following table sets forth the maturity profile of held-to-maturity investments; however, these investments may be called prior to their stated maturity date:
| September 30, 2014 | December 31, 2013 | |||||||
| Due within one year |
$ | — | $ | — | ||||
| Due one year through five years |
— | — | ||||||
| Due five years through ten years |
665 | 686 | ||||||
| Due over ten years |
11,559 | 11,062 | ||||||
|
|
|
|
|
|||||
| Total |
$ | 12,224 | $ | 11,748 | ||||
|
|
|
|
|
|||||
10
Fair Value Measurement
Under the accounting for fair value measurements and disclosures, fair value is defined as the price that would be received to sell an asset or paid to transfer a liability, or the exit price, in an orderly transaction between market participants at the measurement date. The accounting guidance establishes a hierarchy of valuation techniques based on whether the inputs to those valuation techniques are observable or unobservable. Observable inputs reflect market data obtained from independent sources, while unobservable inputs reflect the Company’s market assumptions.
These three types of inputs create the following fair value hierarchy:
Level 1—Quoted prices for identical instruments in active markets.
Level 2—Quoted prices for similar instruments in active markets; quoted prices for identical or similar instruments in markets that are not active; and model-derived valuations whose inputs are observable or whose significant value drivers are observable.
Level 3—Instruments whose significant value drivers are unobservable.
This hierarchy requires the use of observable market data when available. The Company’s held-to-maturity securities are categorized as Level 1. The Company does not intend to sell its held-to-maturity investments before the recovery of their amortized cost bases which may be at maturity. Some of our financial instruments are not measured at fair value on a recurring basis but are recorded at amounts that approximate fair value due to their liquid or short-term nature. Such financial assets and financial liabilities are categorized as Level 3.
| 4. | Fixed Assets |
The following table summarizes fixed assets:
| September 30, 2014 | December 31, 2013 | |||||||
| Equipment |
$ | 850 | $ | 518 | ||||
| Furniture and fixtures |
1,618 | 1,005 | ||||||
| Leasehold improvements |
8,546 | 4,880 | ||||||
| Less accumulated depreciation and amortization |
(751 | ) | (151 | ) | ||||
|
|
|
|
|
|||||
| Total |
$ | 10,263 | $ | 6,252 | ||||
|
|
|
|
|
|||||
| 5. | Commitments and Contingencies |
Contractual Obligations
The Company has entered into obligations under operating leases with initial non-cancelable terms in excess of one year for office space, telephone, and data services. Expenses recorded under these agreements for the three months ended September 30, 2014 and 2013 were approximately $778, and $582, respectively, and for the nine months ended September 30, 2014 and 2013 were approximately $2,372 and $1,312, respectively.
Future minimum lease payments with respect to non-cancelable operating leases at September 30, 2014 are approximately as follows:
| Remainder of 2014 |
$ | 809 | ||
| 2015 |
3,054 | |||
| 2016 |
2,840 | |||
| 2017 and thereafter |
35,126 | |||
|
|
|
|||
| Total |
$ | 41,829 | ||
|
|
|
The Company’s prior office lease expired in January 2014. In August 2013, the Company entered into a new 16 year lease agreement. Pursuant to the new lease agreement, the Company received lease incentives which include a deferred rent period and a leasehold improvement allowance equal to $3,223. The Company recorded a receivable of $3,223 due from the lessor of its new office space related to its leasehold improvement allowance, which was included in accounts receivable on the Company’s Consolidated Balance Sheet at December 31, 2013. The balance at September 30, 2014 was $509.
11
Letter of Credit
The Company collateralized its office lease through a standby letter of credit. At September 30, 2014 and December 31, 2013, the Company provided letters of credit totaling $1,384 and $1,803, respectively, which are included in investments on the Company’s Consolidated Balance Sheet.
Contingencies
The Company is subject to various routine reviews and inspections by regulatory authorities as well as legal proceedings arising in the ordinary course of business. The Company is not currently party to any litigation or other legal proceedings that are expected to have a material impact on its business, financial position or results of operations.
| 6. | Stock-Based Awards |
The Company grants equity awards to employees and directors. Options are issued generally for terms of ten years and vest between two to four years. Options are issued with an exercise price equal to the fair value of the Company on the date of grant. The Company estimated the fair value for options using the Black-Scholes option pricing model. All restricted stock and option awards require future service as a condition of vesting with certain awards subject to acceleration under certain conditions. Restricted stock awards generally vest over three years.
A summary of options and restricted stock activity is as follows:
| Options | Weighted Average Exercise Price of Options |
Restricted Stock Awards |
||||||||||
| Balance at January 1, 2014 |
7,844,691 | $ | 1.29 | 1,896,877 | ||||||||
| Granted |
— | $ | — | 623,088 | ||||||||
| Exercised/vested |
(1,042,422 | ) | $ | 0.33 | (946,385 | ) | ||||||
| Forfeitures |
— | $ | — | (3,662 | ) | |||||||
|
|
|
|
|
|
|
|||||||
| Balance at September 30, 2014 |
6,802,269 | $ | 1.44 | 1,569,918 | ||||||||
|
|
|
|
|
|
|
|||||||
A summary of stock-based compensation expense is as follows:
| Three Months Ended September 30, |
Nine Months Ended September 30, |
|||||||||||||
| 2014 | 2013 | 2014 | 2013 | |||||||||||
| $ | 2,077 | $ | 1,781 | $ | 6,122 | $ | 5,186 | |||||||
|
|
|
|
|
|
|
|
|
|||||||
| 7. | Employee Benefit Plans |
The Company has a 401(k) savings plan covering all eligible employees in which the Company can make discretionary contributions from its profits.
A summary of the Company made discretionary contributions is as follows:
| Three Months Ended September 30, |
Nine Months Ended September 30, |
|||||||||||||
| 2014 | 2013 | 2014 | 2013 | |||||||||||
| $ | 113 | $ | 128 | $ | 506 | $ | 391 | |||||||
|
|
|
|
|
|
|
|
|
|||||||
12
| 8. | Earnings Per Share |
The following is a reconciliation of the basic and diluted earnings per share computation:
| Three Months Ended September 30, |
Nine Months Ended September 30, |
|||||||||||||||
| 2014 | 2013 | 2014 | 2013 | |||||||||||||
| (shares in thousands) | (shares in thousands) | |||||||||||||||
| Net income |
$ | 10,623 | $ | 14,965 | $ | 51,429 | $ | 35,061 | ||||||||
|
|
|
|
|
|
|
|
|
|||||||||
| Shares of common stock and common stock equivalents: |
||||||||||||||||
| Weighted averages shares used in basic computation |
131,778 | 126,509 | 131,418 | 125,909 | ||||||||||||
| Dilutive effect of stock options and unvested restricted stock |
6,568 | 13,588 | 7,058 | 13,896 | ||||||||||||
|
|
|
|
|
|
|
|
|
|||||||||
| Weighted averages shares used in dilutive computation |
138,346 | 140,097 | 138,476 | 139,805 | ||||||||||||
|
|
|
|
|
|
|
|
|
|||||||||
| Basic earnings per share |
$ | 0.08 | $ | 0.12 | $ | 0.39 | $ | 0.28 | ||||||||
| Dilutive earnings per share |
$ | 0.08 | $ | 0.11 | $ | 0.37 | $ | 0.25 | ||||||||
Diluted earnings per share reflects the reduction in earnings per share assuming options or other contracts to issue common stock were exercised or converted into common stock under the treasury stock method. The dilutive effect of options to purchase shares of common stock and restricted shares were included in the diluted earnings per share in the three and nine months ended September 30, 2014 and 2013, respectively. 624,478 and 1,196,888 restricted shares were determined to be anti-dilutive and were not included in the calculation of diluted earnings per share for the three and nine months ended September 30, 2014, respectively. There were no anti-dilutive shares included in the calculation of diluted earnings per share for the three and nine months ended September 30, 2013.
| 9. | Income Taxes |
Net operating losses – U.S.
The Company generated net operating losses in the U.S. (“NOLs”) during periods prior to September 30, 2014. The following table summarizes the activity for NOLs for the nine months ended September 30, 2014:
| December 31, 2013 |
$ | (140,959 | ) | |
| U.S. GAAP pretax income |
59,142 | |||
| Income tax differences: |
||||
| Temporary |
627 | |||
| Permanent |
(20,507 | ) | ||
|
|
|
|||
| September 30, 2014 |
$ | (101,697 | ) | |
|
|
|
During the first quarter of 2014, management determined that although realization is not assured, it believed that it is more likely than not that its gross deferred tax asset would be realized. Therefore, it released the valuation allowance previously recorded resulting in an income tax benefit of $13,725 on the Company’s Consolidated Statements of Operations and Comprehensive Income in the three months ended March 31, 2014 and a corresponding deferred tax asset on the Company’s Consolidated Balance Sheet at March 31, 2014.
At September 30, 2014 and December 31, 2013, $98,210 and $111,635 of the NOLs were generated from stock-based compensation amounts recognized for tax purposes at the time options are exercised (at the intrinsic value) or restricted stock is vested (at fair value of the share price) in excess of amounts previously expensed at the date of grant for U.S. GAAP purposes. These amounts cannot be recognized as a deferred tax asset under U.S. GAAP. In addition, $3,487 of the NOLs are deemed worthless. Therefore, at September 30, 2014, the Company has no recognized deferred tax assets related to these NOLs.
During the three and nine months ended September 30, 2014, the Company recognized tax expense of $9,634 and $5,440. During the nine months ended September 30, 2014, the Company utilized $5,472 of its deferred tax asset and the Company recorded a credit to additional paid-in capital of $13,649 for the amount of NOLs from stock-based compensation utilized to reduce taxes payable during the period.
13
The Company completed a state tax study which resulted in a reduction of its current baseline operating tax rate in the U.S. from 45% to approximately 38%. The Company reduced the carrying value of its deferred tax asset which had previously been recorded using the higher rate.
A summary of the components of the gross and tax affected deferred tax asset as of September 30, 2014 is as follows:
| Stock-based compensation |
$ | 15,689 | ||
| Deferred rent liability |
5,703 | |||
| Other |
111 | |||
|
|
|
|||
| Total gross deferred tax asset |
21,503 | |||
| Income tax rate |
38.38 | % | ||
|
|
|
|||
| Tax affected |
$ | 8,253 | ||
|
|
|
Net operating losses – Non-U.S.
During the nine months ended September 30, 2014, the Company’s foreign subsidiaries generated $2,318 of NOLs. At September 30, 2014, a deferred tax asset related to these NOLs has been fully offset by a valuation allowance of $487.
| 10. | Acquisition and Goodwill |
On April 15, 2014, the Company completed its acquisition of Boost, a U.K. and Jersey based ETP sponsor, now known as WisdomTree Europe, as part of the Company’s strategy to expand internationally. Under the terms of the agreement, the Company owns 75% of WisdomTree Europe and the former Boost shareholders own 25%. The Company will acquire the remaining 25% ownership interest at the end of four years using a predefined formula based on European assets under management at the end of the four year period and will be tied to the Company’s enterprise value over global AUM at the time of payout, and affected by profitability of the European business. No consideration was transferred on the acquisition date. The ultimate payout will be made in cash over two years.
Two shareholders of Boost, who owned 88% of Boost prior to the acquisition, became co-CEOs of WisdomTree Europe and are guaranteed a minimum payment of $1,757 for their interest if they terminate their employment without good reason or they are terminated for cause. The Company determined that this minimum payment represents consideration transferred and was recognized and measured at acquisition-date fair value to determine the purchase price. Any future payments made to the co-CEOs in excess of the minimum payments is accounted for separately from the business combination as compensation expense for post-acquisition services.
Because the Company is required to redeem the shares from the former Boost shareholders at the end of four years under a predefined formula, under U.S. GAAP, the Company does not reflect the 25% interest held by the former Boost shareholders in WisdomTree Europe as non-controlling interest (“NCI”). The obligation to mandatorily redeem the NCI for cash was measured at fair value on the acquisition date and is re-measured at the amount of cash that would be paid under the conditions specified in the contract as if settlement occurred at the reporting date. Any change in the carrying amount of the liability will be recognized as an expense.
The Company recorded goodwill of $1,676 in connection with this acquisition. Goodwill represents the excess value of the purchase price over the $81 fair value of the net assets acquired, consisting primarily of accounts receivable, accounts payable and fixed assets. While the Company paid no consideration up front to the former Boost shareholders, under the terms of the acquisition agreement, $1,757 was deemed to represent the purchase price. Goodwill is not expected to be tax deductible.
The following table summarizes the goodwill activity for the nine months ended September 30, 2014:
| Balance at January 1, 2014 |
$ | — | ||
| Goodwill acquired during the period |
1,676 | |||
|
|
|
|||
| Balance at September 30, 2014 |
$ | 1,676 | ||
|
|
|
Transaction costs of $1,607 were incurred during the nine months ended September 30, 2014 in connection with this acquisition. Such expenses are recorded in professional and consulting fees, other and sales and business development in the Company’s Consolidated Statements of Operations and Comprehensive Income.
14
| 11. | Shares Repurchased |
During the nine months ended September 30, 2014 and 2013, the Company repurchased 392,346 and 118,156 shares of its common stock for an aggregate cost of $6,259 and $1,413, respectively, which were withheld pursuant to the terms of awards granted to employees to cover income tax withholding obligations.
| 12. | Subsequent Event |
On October 29, 2014, the Company’s Board of Directors declared a quarterly cash dividend of $0.08 per share of common stock. The first dividend will be paid on November 26, 2014 to stockholders of record as of the close of business on November 12, 2014. The Board also authorized the purchase of up to $100 million of the Company’s common stock over three years, including purchases to offset future equity grants made under the Company’s equity plans. Purchases under this program will be made in open market or privately negotiated transactions. This authority may be exercised from time to time and in such amounts as market conditions warrant, and subject to regulatory considerations. The timing and actual number of shares repurchased will depend on a variety of factors including price, corporate and regulatory requirements, market conditions, and other corporate liquidity requirements and priorities. The repurchase program may be suspended or terminated at any time without prior notice.
15
| ITEM 2. | MANAGEMENT’S DISCUSSION AND ANALYSIS OF FINANCIAL CONDITION AND RESULTS OF OPERATIONS |
The following discussion and analysis of our financial condition and results of operations should be read together with our consolidated financial statements and the related notes and the other financial information included elsewhere in this Report. In addition to historical consolidated financial information, the following discussion contains forward-looking statements that reflect our plans, estimates and beliefs. Our actual results could differ materially from those discussed in the forward-looking statements. Factors that could cause or contribute to these differences include those discussed below. For a more complete description of the risks noted above and other risks that could cause our actual results to materially differ from our current expectations, please see Item 1A “Risk Factors” in this Report and in our Annual Report on Form 10-K for the fiscal year ended December 31, 2013. We assume no obligation to update or revise publicly any forward-looking statements, whether as a result of new information, future events or otherwise, unless required by law.
Executive Summary
Introduction
We were the eighth largest ETP sponsor in the world based on assets under management (“AUM”), with AUM of $35.9 billion globally as of September 30, 2014. An ETP is a pooled investment vehicle that holds a basket of securities, financial instruments or other assets and generally seeks to track (index-based) or outperform (actively managed) the performance of a broad or specific equity, fixed income or alternatives market segment, commodity or currency (or an inverse or multiple thereof). ETPs are listed on an exchange with their shares traded in the secondary market at market prices, generally at approximately the same price as the net asset value of their underlying components. ETP is an umbrella term that includes ETFs, exchange-traded notes and exchange-traded commodities.
Through our operating subsidiaries, we provide investment advisory and other management services to the WisdomTree ETFs and Boost ETPs collectively offering ETPs covering equity, fixed income, currency, alternatives and commodity asset classes. In exchange for providing these services, we receive advisory fee revenues based on a percentage of the ETPs’ average daily AUM. Our expenses are predominantly related to selling, operating and marketing our ETPs. We have contracted with third parties to provide certain operational services for the ETPs. We distribute our ETPs through all major channels within the asset management industry, including brokerage firms, registered investment advisers, institutional investors, private wealth managers and discount brokers primarily through our sales force. Our sales efforts are not directed towards the retail segment but rather are directed towards financial or investment advisers that act as intermediaries between the end-client and us.
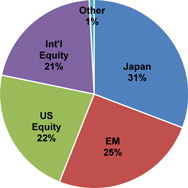
$35.8 billion of our AUM are from our U.S. listed WisdomTree ETFs. As of September 30, 2014, we were the fifth largest sponsor of ETFs in the United States based on AUM. As the pie chart below reflects, 31% of our U.S. AUM is concentrated in Japanese exposures, in particular, our Japanese equity fund which hedges the Yen, trading under the symbol DXJ. In addition, another 25% of our AUM is concentrated in emerging markets equity, fixed income and currency exposures. Negative sentiment towards these two markets, as well as the strengthening of the Yen versus the U.S. dollar, may have an adverse effect on our results.
16
Market Environment
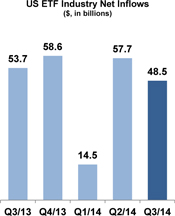
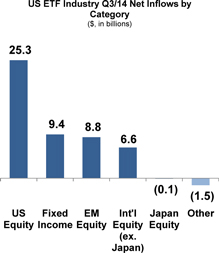
The following charts reflect the U.S. ETF industry flows in total and by broad category:
|
|
As the charts above reflect, industry flows declined 16% from the second quarter of 2014 and 10% from the third quarter of 2013. The U.S. equity category gathered the majority of the flows, of which approximately 40% went into a competitor’s S&P 500 fund trading under the symbol SPY. Fixed income, emerging markets and international equities, in particular European themed products, were also favored.
Industry Development
Recently, the SEC issued notice of its intent to grant Eaton Vance permission to offer a form of non-transparent actively managed exchange traded funds. In addition, the SEC issued notice of its intent to reject a proposal from Precidian and BlackRock to also offer a form of non-transparent actively managed funds. Industry observers believe that non-transparent funds may allow traditional actively managed mutual fund sponsors to compete more effectively against ETFs. We believe one of the benefits of the ETF structure is its daily full transparency, which these proposed non-transparent ETFs will not provide. We offer fully transparent actively managed ETFs as well as passive ETFs. We do not know what effect, if any, these non-transparent funds may have on our business.
Our Operating and Financial Results
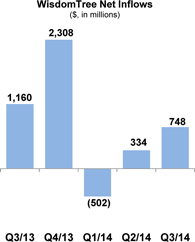
The following charts reflect the flows into our U.S. listed ETFs:
|
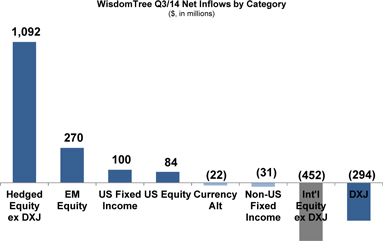
|
For the third quarter of 2014, we experienced $0.7 billion of net inflows. We had $1.5 billion of inflows primarily from $1.1 billion into our U.S. listed European themed fund, HEDJ, that hedges out the Euro currency exposure, and from our India ETF. Partly offsetting this was $800 million in outflows primarily in our unhedged U.S. listed European ETF and our Japanese hedged equity fund, DXJ. Our market share of U.S. industry net inflows was 1.5% for the third quarter of 2014.
17
Despite the challenging operating environment, we achieved solid financial results as reflected in the below chart:
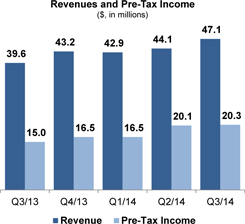
| • | Revenues – We recorded revenues of $47.1 million in the third quarter of 2014, an increase of 18.9% from $39.6 million in the third quarter of last year primarily due to higher average AUM. |
| • | Expenses – Total expenses increased 8.9% compared to the third quarter of last year primarily due to higher strategic corporate consulting costs and higher levels of advertising related activities to support our growth. Also included in the third quarter of 2014 were $1.8 million of expenses related to our European listed ETPs, which were acquired in April 2014. |
| • | Pre-tax income – Pre-tax income reached $20.3 million in the third quarter of 2014 as compared to $15.0 million in the comparable period last year. We believe pre-tax income is a better measure of comparing our results to prior periods as we did not record tax expense prior to the second quarter of 2014. See “Income Taxes” below for further discussion regarding our income tax expense. |
Income Taxes
In the third quarter of 2014, we completed a state tax study, which resulted in a reduction of our current baseline operating tax rate in the U.S. from 45% to approximately 38%. This rate may change in the future as our share of income attributable to the various states changes. We plan on performing this analysis on an annual basis in connection with the preparation of our U.S. tax return. We recorded a charge to tax expense to reduce the value of our deferred tax asset, which had previously been recorded using a 45% rate. In the first quarter of 2014, we recognized a deferred tax asset which previously had been reserved with a 100% valuation allowance. During the second quarter of 2014, we began to record income tax expense. In addition, in the third quarter of 2014, we took a tax charge to account for non-deductible expenses associated with our acquisition of Boost in April 2014. As a result of these items, we recorded a charge of $1.3 million to tax expense. However, we do not expect to pay cash income taxes in 2014 and for some time thereafter due to the size of our net operating losses attributable to excess stock option and restricted stock deductions. Such amounts will be applied to reduce income taxes payable with a corresponding increase to equity as recognized. We recorded an income tax expense of $9.6 million in the third quarter of 2014.
Capital Return Program
Due to our growing scale and cash generation, we have implemented a capital return program. On October 29, 2014, our Board of Directors declared a quarterly cash dividend of $0.08 per share of our common stock. The first dividend will be paid on November 26, 2014 to stockholders of record as of the close of business on November 12, 2014. Our Board also authorized the purchase of up to $100 million of our common stock over three years, including purchases to offset future equity grants made under our equity plans. Purchases under this program will be made in open market or privately negotiated transactions. This authority may be exercised from time to time and in such amounts as market conditions warrant, and subject to regulatory considerations. The timing and actual number of shares repurchased will depend on a variety of factors including price, corporate and regulatory requirements, market conditions, and other corporate liquidity requirements and priorities. The repurchase program may be suspended or terminated at any time without prior notice.
18
Non-GAAP Financial Measurements
Gross margin is a non-GAAP financial measurement which we believe provides useful and meaningful information as it is a financial measurement management reviews when evaluating the Company’s operating results. We define gross margin as total revenues less fund management and administration expenses and third-party sharing arrangements. We believe this financial measurement provides investors with a consistent way to analyze the amount we retain after paying third party service providers to operate our ETPs and third party marketing agents whose fees are associated with our AUM level. The following table reflects the calculation of our gross margin and gross margin percentage:
| Three Months Ended September 30, |
Nine Months Ended September 30, |
|||||||||||||||
| (in thousands) | 2014 | 2013 | 2014 | 2013 | ||||||||||||
| GAAP total revenue |
$ | 47,114 | $ | 39,630 | $ | 134,162 | $ | 106,302 | ||||||||
| Fund management and administration |
(8,465 | ) | (8,794 | ) | (25,451 | ) | (26,123 | ) | ||||||||
| Third party sharing arrangements |
(187 | ) | (374 | ) | (312 | ) | (913 | ) | ||||||||
| Gross margin |
$ | 38,462 | $ | 30,462 | $ | 108,399 | $ | 79,266 | ||||||||
|
|
|
|
|
|
|
|
|
|||||||||
| Gross margin percentage |
81.6 | % | 76.9 | % | 80.8 | % | 74.6 | % | ||||||||
|
|
|
|
|
|
|
|
|
|||||||||
19
Key Operating Statistics
The following table presents key operating statistics that serve as indicators for the performance of our business:
| Three Months Ended | Nine Months Ended | |||||||||||||||||||
| Sept. 30, 2014 |
Jun. 30, 2014 |
Sept. 30, 2013 |
Sept. 30, | |||||||||||||||||
| 2014 | 2013 | |||||||||||||||||||
| U.S. Listed ETFs |
||||||||||||||||||||
| Total ETFs (in millions) |
||||||||||||||||||||
| Beginning of period assets |
$ | 35,500 | $ | 33,884 | $ | 28,975 | $ | 34,884 | $ | 18,286 | ||||||||||
| Inflows/(outflows) |
748 | 334 | 1,160 | 580 | 12,015 | |||||||||||||||
| Market appreciation/(depreciation) |
(425 | ) | 1,282 | 1,217 | 359 | 1,051 | ||||||||||||||
|
|
|
|
|
|
|
|
|
|
|
|||||||||||
| End of period assets |
$ | 35,823 | $ | 35,500 | $ | 31,352 | $ | 35,823 | $ | 31,352 | ||||||||||
|
|
|
|
|
|
|
|
|
|
|
|||||||||||
| Average assets during the period |
$ | 35,554 | $ | 34,141 | $ | 30,473 | $ | 34,518 | $ | 26,932 | ||||||||||
| ETF Industry and Market Share (in billions) |
||||||||||||||||||||
| ETF industry net inflows |
$ | 48.5 | $ | 57.7 | $ | 53.7 | $ | 120.7 | $ | 121.3 | ||||||||||
| WisdomTree market share of industry inflows |
1.5 | % | 0.6 | % | 2.2 | % | 0.5 | % | 9.9 | % | ||||||||||
| International Hedged Equity ETFs (in millions) |
||||||||||||||||||||
| Beginning of period assets |
$ | 12,557 | $ | 12,612 | $ | 10,270 | $ | 13,348 | $ | 1,258 | ||||||||||
| Inflows/(outflows) |
799 | (502 | ) | 752 | 285 | 9,199 | ||||||||||||||
| Market appreciation/(depreciation) |
615 | 447 | 459 | 338 | 1,024 | |||||||||||||||
|
|
|
|
|
|
|
|
|
|
|
|||||||||||
| End of period assets |
$ | 13,971 | $ | 12,557 | $ | 11,481 | $ | 13,971 | $ | 11,481 | ||||||||||
|
|
|
|
|
|
|
|
|
|
|
|||||||||||
| Average assets during the period |
$ | 12,654 | $ | 12,189 | $ | 11,175 | $ | 12,631 | $ | 7,744 | ||||||||||
| U.S. Equity ETFs (in millions) |
||||||||||||||||||||
| Beginning of period assets |
$ | 8,052 | $ | 7,505 | $ | 5,777 | $ | 7,181 | $ | 4,371 | ||||||||||
| Inflows/(outflows) |
84 | 221 | 273 | 494 | 1,111 | |||||||||||||||
| Market appreciation/(depreciation) |
(197 | ) | 326 | 221 | 264 | 789 | ||||||||||||||
|
|
|
|
|
|
|
|
|
|
|
|||||||||||
| End of period assets |
$ | 7,939 | $ | 8,052 | $ | 6,271 | $ | 7,939 | $ | 6,271 | ||||||||||
|
|
|
|
|
|
|
|
|
|
|
|||||||||||
| Average assets during the period |
$ | 8,067 | $ | 7,721 | $ | 6,214 | $ | 7,655 | $ | 5,502 | ||||||||||
| Emerging Markets Equity ETFs (in millions) |
||||||||||||||||||||
| Beginning of period assets |
$ | 7,606 | $ | 6,753 | $ | 7,172 | $ | 7,448 | $ | 7,332 | ||||||||||
| Inflows/(outflows) |
270 | 388 | 286 | 26 | 1,111 | |||||||||||||||
| Market appreciation/(depreciation) |
(381 | ) | 465 | 245 | 21 | (740 | ) | |||||||||||||
|
|
|
|
|
|
|
|
|
|
|
|||||||||||
| End of period assets |
$ | 7,495 | $ | 7,606 | $ | 7,703 | $ | 7,495 | $ | 7,703 | ||||||||||
|
|
|
|
|
|
|
|
|
|
|
|||||||||||
| Average assets during the period |
$ | 7,878 | $ | 7,088 | $ | 7,289 | $ | 7,247 | $ | 7,719 | ||||||||||
| International Developed Equity ETFs (in millions) |
||||||||||||||||||||
| Beginning of period assets |
$ | 5,340 | $ | 4,830 | $ | 2,633 | $ | 3,864 | $ | 2,474 | ||||||||||
| Inflows/(outflows) |
(452 | ) | 518 | 205 | 878 | 401 | ||||||||||||||
| Market appreciation/(depreciation) |
(394 | ) | (8 | ) | 312 | (248 | ) | 275 | ||||||||||||
|
|
|
|
|
|
|
|
|
|
|
|||||||||||
| End of period assets |
$ | 4,494 | $ | 5,340 | $ | 3,150 | $ | 4,494 | $ | 3,150 | ||||||||||
|
|
|
|
|
|
|
|
|
|
|
|||||||||||
| Average assets during the period |
$ | 5,016 | $ | 5,135 | $ | 2,888 | $ | 4,833 | $ | 2,782 | ||||||||||
| Fixed Income ETFs (in millions) |
||||||||||||||||||||
| Beginning of period assets |
$ | 1,376 | $ | 1,610 | $ | 2,437 | $ | 1,906 | $ | 2,118 | ||||||||||
| Inflows/(outflows) |
69 | (278 | ) | (320 | ) | (515 | ) | 266 | ||||||||||||
| Market appreciation/(depreciation) |
(66 | ) | 44 | (22 | ) | (12 | ) | (289 | ) | |||||||||||
|
|
|
|
|
|
|
|
|
|
|
|||||||||||
| End of period assets |
$ | 1,379 | $ | 1,376 | $ | 2,095 | $ | 1,379 | $ | 2,095 | ||||||||||
|
|
|
|
|
|
|
|
|
|
|
|||||||||||
| Average assets during the period |
$ | 1,385 | $ | 1,435 | $ | 2,246 | $ | 1,522 | $ | 2,466 | ||||||||||
| Currency ETFs (in millions) |
||||||||||||||||||||
| Beginning of period asset |
$ | 406 | $ | 422 | $ | 547 | $ | 979 | $ | 611 | ||||||||||
| Inflows/(outflows) |
(35 | ) | (21 | ) | (48 | ) | (605 | ) | (98 | ) | ||||||||||
| Market appreciation/(depreciation) |
(9 | ) | 5 | 3 | (12 | ) | (11 | ) | ||||||||||||
|
|
|
|
|
|
|
|
|
|
|
|||||||||||
| End of period assets |
$ | 362 | $ | 406 | $ | 502 | $ | 362 | $ | 502 | ||||||||||
|
|
|
|
|
|
|
|
|
|
|
|||||||||||
| Average assets during the period |
$ | 380 | $ | 413 | $ | 515 | $ | 468 | $ | 586 | ||||||||||
20
| Three Months Ended | Nine Months Ended | |||||||||||||||||||
| Sept. 30, 2014 |
Jun. 30, 2014 |
Sept. 30, 2013 |
Sept. 30, | |||||||||||||||||
| 2014 | 2013 | |||||||||||||||||||
| Alternative Strategy ETFs (in millions) |
||||||||||||||||||||
| Beginning of period assets |
$ | 163 | $ | 152 | $ | 139 | $ | 158 | $ | 122 | ||||||||||
| Inflows/(outflows) |
13 | 8 | 12 | 17 | 25 | |||||||||||||||
| Market appreciation/(depreciation) |
7 | 3 | (1 | ) | 8 | 3 | ||||||||||||||
|
|
|
|
|
|
|
|
|
|
|
|||||||||||
| End of period assets |
$ | 183 | $ | 163 | $ | 150 | $ | 183 | $ | 150 | ||||||||||
|
|
|
|
|
|
|
|
|
|
|
|||||||||||
| Average assets during the period |
$ | 174 | $ | 160 | $ | 146 | $ | 162 | $ | 133 | ||||||||||
| Average ETF assets during the period |
||||||||||||||||||||
| International hedged equity ETFs |
36 | % | 36 | % | 37 | % | 37 | % | 29 | % | ||||||||||
| U.S. equity ETFs |
23 | % | 23 | % | 20 | % | 22 | % | 20 | % | ||||||||||
| Emerging markets equity ETFs |
22 | % | 21 | % | 24 | % | 21 | % | 29 | % | ||||||||||
| International developed equity ETFs |
14 | % | 15 | % | 9 | % | 14 | % | 10 | % | ||||||||||
| Fixed income ETFs |
4 | % | 4 | % | 7 | % | 4 | % | 9 | % | ||||||||||
| Currency ETFs |
1 | % | 1 | % | 2 | % | 1 | % | 2 | % | ||||||||||
| Alternative strategy ETFs |
0 | % | 0 | % | 1 | % | 1 | % | 1 | % | ||||||||||
|
|
|
|
|
|
|
|
|
|
|
|||||||||||
| Total |
100 | % | 100 | % | 100 | % | 100 | % | 100 | % | ||||||||||
|
|
|
|
|
|
|
|
|
|
|
|||||||||||
| Average ETF advisory fee during the period |
||||||||||||||||||||
| Alternative strategy ETFs |
0.94 | % | 0.94 | % | 0.94 | % | 0.94 | % | 0.94 | % | ||||||||||
| Emerging markets equity ETFs |
0.68 | % | 0.67 | % | 0.66 | % | 0.67 | % | 0.66 | % | ||||||||||
| International developed equity ETFs |
0.56 | % | 0.57 | % | 0.56 | % | 0.56 | % | 0.56 | % | ||||||||||
| Fixed income ETFs |
0.55 | % | 0.55 | % | 0.55 | % | 0.55 | % | 0.55 | % | ||||||||||
| International hedged equity ETFs |
0.50 | % | 0.50 | % | 0.49 | % | 0.50 | % | 0.49 | % | ||||||||||
| Currency ETFs |
0.49 | % | 0.49 | % | 0.50 | % | 0.49 | % | 0.50 | % | ||||||||||
| U.S. equity ETFs |
0.35 | % | 0.35 | % | 0.35 | % | 0.35 | % | 0.35 | % | ||||||||||
|
|
|
|
|
|
|
|
|
|
|
|||||||||||
| Blended total |
0.52 | % | 0.51 | % | 0.51 | % | 0.52 | % | 0.52 | % | ||||||||||
|
|
|
|
|
|
|
|
|
|
|
|||||||||||
| Number of ETFs—end of the period |
||||||||||||||||||||
| International developed equity ETFs |
17 | 17 | 16 | 17 | 16 | |||||||||||||||
| U.S. equity ETFs |
13 | 13 | 13 | 13 | 13 | |||||||||||||||
| Fixed income ETFs |
12 | 12 | 6 | 12 | 6 | |||||||||||||||
| International hedged equity ETFs |
12 | 12 | 4 | 12 | 4 | |||||||||||||||
| Emerging markets equity ETFs |
7 | 7 | 7 | 7 | 7 | |||||||||||||||
| Currency ETFs |
6 | 6 | 5 | 6 | 5 | |||||||||||||||
| Alternative strategy ETFs |
2 | 2 | 2 | 2 | 2 | |||||||||||||||
|
|
|
|
|
|
|
|
|
|
|
|||||||||||
| Total |
69 | 69 | 53 | 69 | 53 | |||||||||||||||
|
|
|
|
|
|
|
|
|
|
|
|||||||||||
| European Listed ETPs |
||||||||||||||||||||
| Total ETPs (in thousands) |
||||||||||||||||||||
| Beginning of period assets |
$ | 113,244 | $ | 96,817 | $ | 96,817 | ||||||||||||||
| Inflows/(outflows) |
19,192 | 17,658 | 36,850 | |||||||||||||||||
| Market appreciation/(depreciation) |
(9,226 | ) | (1,231 | ) | (10,457 | ) | ||||||||||||||
|
|
|
|
|
|
|
|||||||||||||||
| End of period assets |
$ | 123,210 | $ | 113,244 | $ | 123,210 | ||||||||||||||
|
|
|
|
|
|
|
|||||||||||||||
| Average ETP advisory fee during the period |
0.79 | % | 0.82 | % | 0.80 | % | ||||||||||||||
| Number of ETPs—end of period |
42 | 38 | 42 | |||||||||||||||||
| Global Headcount |
114 | 103 | 84 | 114 | 84 | |||||||||||||||
Note: Previously issued statistics may be restated due to trade adjustments.
Source: Investment Company Institute, Bloomberg, WisdomTree
21
Three Months Ended September 30, 2014 Compared to September 30, 2013
Revenues
| Three Months Ended September 30, |
Change | Percent Change |
||||||||||||||
| 2014 | 2013 | |||||||||||||||
| Average assets under management (in millions) |
$ | 35,554 | $ | 30,473 | $ | 5,081 | 16.7 | % | ||||||||
| Average ETP advisory fee |
0.52 | % | 0.51 | % | 0.01 | |||||||||||
| Advisory fees (in thousands) |
$ | 46,942 | $ | 39,437 | $ | 7,505 | 19.0 | % | ||||||||
| Other income (in thousands) |
172 | 193 | (21 | ) | (10.9 | %) | ||||||||||
|
|
|
|
|
|
|
|||||||||||
| Total revenues (in thousands) |
$ | 47,114 | $ | 39,630 | $ | 7,484 | 18.9 | % | ||||||||
|
|
|
|
|
|
|
|||||||||||
Advisory fees
Advisory fees revenue increased 19.0% from $39.4 million in the three months ended September 30, 2013 to $46.9 million in the comparable period in 2014. This increase was primarily due to higher average AUM and average fee capture. Included in the third quarter of 2014 was $0.3 million in advisory fees revenue from our European listed ETPs, which were acquired in April 2014. Our average advisory fee for our U.S. listed ETFs was 0.52% as compared to 0.51% for the same period last year.
Other income
Other income decreased 10.9% from $0.19 million in the three months ended September 30, 2013 to $0.17 million in the comparable period in 2014 primarily due to currency losses.
Expenses
| Three Months Ended September 30, |
Change | Percent Change |
||||||||||||||
| (in thousands) | 2014 | 2013 | ||||||||||||||
| Compensation and benefits |
$ | 9,990 | $ | 9,648 | $ | 342 | 3.5 | % | ||||||||
| Fund management and administration |
8,465 | 8,794 | (329 | ) | (3.7 | %) | ||||||||||
| Marketing and advertising |
3,341 | 2,031 | 1,310 | 64.5 | % | |||||||||||
| Sales and business development |
1,279 | 1,305 | (26 | ) | (2.0 | )% | ||||||||||
| Professional and consulting fees |
1,383 | 542 | 841 | 155.2 | % | |||||||||||
| Occupancy, communications and equipment |
882 | 723 | 159 | 22.0 | % | |||||||||||
| Depreciation and amortization |
207 | 84 | 123 | 146.4 | % | |||||||||||
| Third-party sharing arrangements |
187 | 374 | (187 | ) | (50 | %) | ||||||||||
| Other |
1,123 | 1,164 | (41 | ) | (3.5 | %) | ||||||||||
|
|
|
|
|
|
|
|
|
|||||||||
| Total expenses |
$ | 26,857 | $ | 24,665 | $ | 2,192 | 8.9 | % | ||||||||
|
|
|
|
|
|
|
|
|
|||||||||
| Three Months Ended September 30, |
||||||||
| As a Percent of Revenues: |
2014 | 2013 | ||||||
| Compensation and benefits |
21.2 | % | 24.3 | % | ||||
| Fund management and administration |
18.0 | % | 22.2 | % | ||||
| Marketing and advertising |
7.1 | % | 5.1 | % | ||||
| Sales and business development |
2.7 | % | 3.3 | % | ||||
| Professional and consulting fees |
2.9 | % | 1.4 | % | ||||
| Occupancy, communications and equipment |
1.9 | % | 1.8 | % | ||||
| Depreciation and amortization |
0.4 | % | 0.2 | % | ||||
| Third-party sharing arrangements |
0.4 | % | 1.0 | % | ||||
| Other |
2.4 | % | 2.9 | % | ||||
|
|
|
|
|
|||||
| Total expenses |
57.0 | % | 62.2 | % | ||||
|
|
|
|
|
|||||
22
Compensation and benefits
Compensation and benefits expense increased 3.5% from $9.6 million in the three months ended September 30, 2013 to $10.0 million in the comparable period in 2014. This increase was primarily due to higher headcount related expenses to support our growth offset by lower accrued incentive compensation due to our level of net inflows. In addition, we incurred higher compensation costs due to our acquisition of Boost in April 2014. Our global headcount at September 30, 2014 was 114 compared to 84 at September 30, 2013.
Fund management and administration
Fund management and administration expense decreased 3.7% from $8.8 million in the three months ended September 30, 2013 to $8.5 million in the comparable period in 2014. This decrease was primarily due to savings from the transfer of our U.S. ETF fund accounting, administration and custody services from BNY Mellon to State Street, partially offset by higher costs associated with higher average AUM. Partly offsetting this decrease was $0.3 million of expenses for our European listed ETPs. We had 69 U.S. listed ETFs and 42 European listed ETPs at September 30, 2014 compared to 53 U.S. listed ETFs at September 30, 2013.
Marketing and advertising
Marketing and advertising expense increased 64.5% from $2.0 million in the three months ended September 30, 2013 to $3.3 million in the comparable period in 2014 primarily due to higher levels of print and television advertising.
Sales and business development
Sales and business development expense decreased 2.0% from the three months ended September 30, 2013 to the comparable period in 2014 primarily due to lower spending for product development initiatives.
Professional and consulting fees
Professional and consulting fees increased by $0.9 million from $0.5 million in the three months ended September 30, 2013 to $1.4 million in the comparable period in 2014 primarily due to higher strategic corporate consulting costs.
Occupancy, communications and equipment
Occupancy, communications and equipment expense increased 22.0% from $0.7 million in the three months ended September 30, 2013 to $0.9 million in the comparable period in 2014. This increase was primarily due to costs for new office space we began occupying in 2014.
Depreciation and amortization
Depreciation and amortization expense increased by $0.1 million from $0.1 million in the three months ended September 30, 2013 to $0.2 million in the comparable period in 2014 primarily due to amortization of leasehold improvements for our new office facility.
Third-party sharing arrangements
Third-party sharing arrangements decreased 50.0% from $0.4 million in the three months ended September 30, 2013 to $0.2 million in the comparable period in 2014 primarily due to lower fees to our third party marketing agent in Latin America.
Other
Other expenses decreased 3.5% from $1.2 million in the three months ended September 30, 2013 to $1.1 million in the comparable period in 2014 primarily due to lower general and administrative expenses.
23
Nine Months Ended September 30, 2014 Compared to September 30, 2013
Revenues
| Nine Months Ended September 30, |
Change | Percent Change |
||||||||||||||
| 2014 | 2013 | |||||||||||||||
| Average assets under management (in millions) |
$ | 34,518 | $ | 26,932 | $ | 7,586 | 28.2 | % | ||||||||
| Average ETP advisory fee |
0.52 | % | 0.52 | % | — | — | ||||||||||
| Advisory fees (in thousands) |
$ | 133,489 | $ | 105,691 | $ | 27,798 | 26.3 | % | ||||||||
| Other income (in thousands) |
673 | 611 | 62 | 10.1 | % | |||||||||||
|
|
|
|
|
|
|
|||||||||||
| Total revenues (in thousands) |
$ | 134,162 | $ | 106,302 | $ | 27,860 | 26.2 | % | ||||||||
|
|
|
|
|
|
|
|||||||||||
Advisory fees
Advisory fees revenue increased 26.3% from $105.7 million in the nine months ended September 30, 2013 to $133.5 million in the comparable period in 2014. This increase was primarily due to higher average AUM. Our average advisory fee remained flat at 0.52% over the same period.
Other income
Other income increased 10.1% from $0.6 million in the nine months ended September 30, 2013 to $0.7 million in the comparable period in 2014. This was primarily due to realized gains on our currency holdings and higher interest income from larger available cash balances partly offset by lower index licensing revenue.
Expenses
| Nine Months Ended September 30, |
Change | Percent Change |
||||||||||||||
| (in thousands) | 2014 | 2013 | ||||||||||||||
| Compensation and benefits |
$ | 26,896 | $ | 26,577 | $ | 319 | 1.2 | % | ||||||||
| Fund management and administration |
25,451 | 26,123 | (672 | ) | (2.6 | %) | ||||||||||
| Marketing and advertising |
8,645 | 6,164 | 2,481 | 40.2 | % | |||||||||||
| Sales and business development |
4,307 | 4,626 | (319 | ) | (6.9 | %) | ||||||||||
| Professional and consulting fees |
5,018 | 1,812 | 3,206 | 176.9 | % | |||||||||||
| Occupancy, communications and equipment |
2,635 | 1,691 | 944 | 55.8 | % | |||||||||||
| Depreciation and amortization |
600 | 249 | 351 | 141.0 | % | |||||||||||
| Third-party sharing arrangements |
312 | 913 | (601 | ) | (65.8 | %) | ||||||||||
| Other |
3,429 | 3,086 | 343 | 11.1 | % | |||||||||||
|
|
|
|
|
|
|
|
|
|||||||||
| Total expenses |
$ | 77,293 | $ | 71,241 | $ | 6,052 | 8.5 | % | ||||||||
|
|
|
|
|
|
|
|
|
|||||||||
| Nine Months Ended September 30, |
||||||||
| As a Percent of Revenues: |
2014 | 2013 | ||||||
| Compensation and benefits |
20.0 | % | 25.0 | % | ||||
| Fund management and administration |
19.0 | % | 24.5 | % | ||||
| Marketing and advertising |
6.5 | % | 5.8 | % | ||||
| Sales and business development |
3.2 | % | 4.4 | % | ||||
| Professional and consulting fees |
3.7 | % | 1.7 | % | ||||
| Occupancy, communications and equipment |
2.0 | % | 1.6 | % | ||||
| Depreciation and amortization |
0.4 | % | 0.2 | % | ||||
| Third-party sharing arrangements |
0.2 | % | 0.9 | % | ||||
| Other |
2.6 | % | 2.9 | % | ||||
|
|
|
|
|
|||||
| Total expenses |
57.6 | % | 67.0 | % | ||||
|
|
|
|
|
|||||
24
Compensation and benefits
Compensation and benefits expense increased 1.2% from $26.6 million in the nine months ended September 30, 2013 to $26.9 million in the comparable period in 2014 as higher headcount related expenses to support our growth; payroll taxes due to bonus payments for 2013 compensation; and higher stock based compensation due to the recognition of expense for equity awards granted to our employees as part of 2013 year-end compensation were offset by lower accrued incentive compensation as a result of low inflow levels in 2014.
Fund management and administration
Fund management and administration expense decreased 2.6% from $26.1 million in the nine months ended September 30, 2013 to $25.5 million in the comparable period in 2014 as savings from the transfer of our U.S. ETF fund accounting, administration and custody services was partly offset by higher costs associated with new fund launches and higher average AUM.
Marketing and advertising
Marketing and advertising expense increased 40.2% from $6.2 million in the nine months ended September 30, 2013 to $8.6 million in the comparable period in 2014 primarily due to higher levels of online, print and television advertising.
Sales and business development
Sales and business development expense decreased 6.9% from $4.6 million in the nine months ended September 30, 2013 to $4.3 million in the comparable period in 2014 primarily due to lower levels of spending for new product development costs.
Professional and consulting fees
Professional and consulting fees increased by $3.2 million from $1.8 million in the nine months ended September 30, 2013 to $5.0 million in the comparable period in 2014. We incurred $1.5 million in costs related to our acquisition of Boost as well as higher corporate legal, accounting and strategic consulting related fees.
Occupancy, communications and equipment
Occupancy, communications and equipment expense increased 55.8% from $1.7 million in the nine months ended September 30, 2013 to $2.6 million in the comparable period in 2014. This increase was primarily due to costs for new office space we began occupying in 2014.
Depreciation and amortization
Depreciation and amortization expense increased by $0.4 million from $0.2 million in the nine months ended September 30, 2013 to $0.6 million in the comparable period in 2014 primarily due to amortization of leasehold improvements for our new office facility.
Third-party sharing arrangements
Third-party sharing arrangements decreased 65.8% from $0.9 million in the nine months ended September 30, 2013 to $0.3 million in the comparable period in 2014 primarily due to lower fees to our third party marketing agent in Latin America.
Other
Other expenses increased 11.1% from $3.1 million in the nine months ended September 30, 2013 to $3.4 million in the comparable period in 2014 primarily due to higher independent director fees partly offset by lower general and administrative expenses.
25
Liquidity and Capital Resources
The following table summarizes key data regarding our liquidity, capital resources and use of capital to fund our operations:
| September 30, 2014 |
December 31, 2013 |
|||||||
| Balance Sheet Data (in thousands): |
||||||||
| Cash and cash equivalents |
$ | 151,287 | $ | 104,316 | ||||
| Investments |
$ | 12,224 | $ | 11,748 | ||||
| Accounts receivable |
$ | 16,268 | $ | 18,100 | ||||
| Total liabilities |
$ | 27,934 | $ | 32,762 | ||||
| Nine Months Ended September 30, |
||||||||
| 2014 | 2013 | |||||||
| Cash Flow Data (in thousands): |
||||||||
| Operating cash flows |
$ | 56,650 | $ | 47,715 | ||||
| Investing cash flows |
(3,747 | ) | (1,783 | ) | ||||
| Financing cash flows |
(5,918 | ) | (64 | ) | ||||
| Foreign exchange rate effect |
(14 | ) | — | |||||
|
|
|
|
|
|||||
| Increase in cash and cash equivalents |
$ | 46,971 | $ | 45,868 | ||||
|
|
|
|
|
|||||
Liquidity
We consider our available liquidity to be our liquid assets less our liabilities. Liquid assets consist of cash and cash equivalents, accounts receivable and investments. We account for investments as held to maturity securities and have the intention and ability to hold to maturity. However, if needed, such investments could be redeemed for liquidity. Cash and cash equivalents include cash on hand and non-interest-bearing and interest-bearing deposits with financial institutions. Accounts receivable primarily represents advisory fees we earn from our ETPs. Investments represent debt instruments of U.S. government and agency securities. Our liabilities consist primarily of payments owed to vendors and third parties in the normal course of business as well as accrued year end incentive compensation for employees.
Cash and cash equivalents increased by $47.0 million in the first nine months of 2014 to $151.3 million at September 30, 2014 primarily due to $56.7 million of cash flow from operations due to our business results, $1.3 million acquired from Boost and $0.9 million from our investments, partly offset by $6.3 million used to repurchase shares of our common stock pursuant to the terms of awards granted to employees to cover income tax withholding obligations, $4.6 million used to purchase leasehold improvements for our new office space and $1.4 million used to purchase investments.
Cash and cash equivalents increased by $45.9 million in the first nine months of 2013 to $87.1 million at September 30, 2013 primarily due to $47.7 million of cash flow from operations due to our business results, $1.3 million received from employee stock option exercises, $2.7 million of cash received from the redemption of investments, partly offset by $3.4 million used to purchase new investments, $1.4 million used to repurchase shares of our common stock pursuant to the terms of awards granted to employees to cover income tax withholding obligations, and $1.1 million used to purchase leasehold improvements for our new office space.
Capital Resources
Currently, our principal source of financing is our operating cash flows, though historically, our principal source of financing was through the private placement of our common stock. We believe that current cash flows generated by our operating activities should be sufficient for us to fund our operations for at least the next 12 months.
Use of Capital
Our business does not require us to maintain a significant cash position. As a result, we expect that our main uses of cash will be to fund the ongoing operations of our business, invest in strategic growth initiatives and expand our business through strategic acquisitions. In addition, we recently announced a capital return program which includes a $0.08 per share quarterly cash dividend and authority to purchase up to $100 million of our common stock over three years, including purchases to offset future equity grants made under our equity plans. During the nine months ended September 30, 2014, we repurchased 392,346 shares from employees at then current market prices at a cost of $6.3 million to cover income tax withholding obligations upon vesting of restricted stock.
26
Contractual Obligations
The following table summarizes our quantifiable future cash payments associated with contractual obligations as of September 30, 2014.
| Payments Due by Period | ||||||||||||||||||||
| (in thousands) | ||||||||||||||||||||
| Total | Less than 1 year |
1 to 3 years | 3 to 5 years | More than 5 years |
||||||||||||||||
| Operating leases |
$ | 41,829 | $ | 809 | $ | 5,894 | $ | 8,319 | $ | 26,807 | ||||||||||
In addition, the Company is required to redeem the remaining 25% non-controlling interest held by the former Boost shareholders in WisdomTree Europe in 2018. The ultimate price for the remaining interest will be determined by a predefined formula based on European AUM at the time of redemption and will be tied to our enterprise value over global AUM at the time of payout, and affected by profitability of the European business. The payout will be in cash over two years.
Off-Balance Sheet Arrangements
Other than operating leases, which are included in the table above, we do not have any off-balance sheet financing or other arrangements. We have neither created nor are party to any special-purpose or off-balance sheet entities for the purpose of raising capital, incurring debt or operating our business.
Critical Accounting Policies
Stock-Based Compensation
Stock-based compensation expense reflects the fair value of stock-based awards measured at grant date and is recognized over the relevant service period. The fair value of each option award is estimated on the date of grant using the Black-Scholes option valuation model. The Black-Scholes option valuation model includes the input of certain variables that are dependent on future expectations, including the expected lives of our options from grant date to exercise date, the volatility of our underlying common shares in the market over that time period, the rate of dividends that we may pay during that time and an appropriate risk-free interest rate. Many of these assumptions require management’s judgment. If actual experience differs significantly from these estimates, stock-based compensation expense and our results of operations could be materially affected.
Revenue Recognition
The Company earns investment advisory fees for ETPs as well as licensing fees from third parties. ETP advisory fees are based on a percentage of the ETPs’ average daily net assets and recognized over the period the related service is provided. Fees for separately managed accounts and licensing are based on a percentage of the average monthly net assets and recognized over the period the related service is provided.
Recently Issued Accounting Pronouncements
In May 2014, the FASB issued Accounting Standards Update 2014-09 (ASU 2014-09) Revenue from Contracts with Customers, which is a new comprehensive revenue recognition standard on the financial reporting requirements for revenue from contracts entered into with customers. ASU 2014-09 is effective for interim and annual periods beginning after December 15, 2016. The Company is currently assessing the potential impact of the adoption of this guidance on its consolidated financial statements.
27
| ITEM 3. | QUANTITATIVE AND QUALITATIVE DISCLOSURES ABOUT MARKET RISK |
The following information, together with information included in other parts of this Management’s Discussion and Analysis of Financial Condition and Results of Operations, describes key aspects of the market risk to the Company.
Market Risk
Market risk to us generally represents the risk of changes in the value of financial instruments held in the portfolios of the WisdomTree ETPs that generally results from fluctuations in equity prices, foreign currency exchange rates against the U.S. dollar, and interest rates. Nearly all of our revenue is derived from advisory agreements for the WisdomTree ETFs. Under these agreements, the advisory fee we receive is based on the market value of the assets in the WisdomTree ETF portfolios we manage.
Fluctuations in the value of these securities are common and are generated by numerous factors such as market volatility, the overall economy, inflation, changes in investor strategies, availability of alternative investment vehicles, government regulations and others. Accordingly changes in any one or a combination of these factors may reduce the value of investment securities and, in turn, the underlying assets under management on which our revenues are earned. These declines may cause investors to withdraw funds from our ETPs in favor of investments that they perceive as offering greater opportunity or lower risk, thereby compounding the impact on our revenues. We believe challenging and volatile market conditions will continue to be present in the foreseeable future.
Interest Rate Risk
In order to maximize yields, we invest our corporate cash in short-term interest earning assets, primarily money market instruments at a commercial bank and U.S. government and agency debt instruments which totaled $163.5 million and $116.1 million as of September 30, 2014 and December 31, 2013, respectively. We do not anticipate that changes in interest rates will have a material impact on our financial condition, operating results or cash flows.
Exchange Rate Risk
As a result of our acquisition of Boost, we now operate globally and are subject to currency translation exposure on the results of our non-U.S. operations. Foreign currency translation risk is the risk that exchange rate gains or losses arise from translating foreign entities’ statements of earnings and balance sheets from functional currency to our reporting currency (the U.S. Dollar) for consolidation purposes. We generate the vast majority of our revenue and expenses in the U.S. dollar and expect to do so for some time. We do not anticipate that changes in exchange rates, predominantly the British pound or Euro, will have a material impact on our financial condition, operating results or cash flows. Currently, we do not enter into derivative financial instruments aimed at offsetting certain exposures in the statement of operations or the balance sheet but may look to do so in the future.
| ITEM 4. | CONTROLS AND PROCEDURES |
Evaluation of Disclosure Controls and Procedures
As of September 30, 2014, our management, with the participation of our Chief Executive Officer and our Chief Financial Officer, evaluated the effectiveness of our disclosure controls and procedures pursuant to Rule 13a-15(b) promulgated under the Securities Exchange Act of 1934, as amended, or the “Exchange Act.” Based upon that evaluation, our Chief Executive Officer and our Chief Financial Officer concluded that, as of September 30, 2014, our disclosure controls and procedures were effective at a reasonable assurance level in ensuring that material information required to be disclosed by us in the reports that we file or submit under the Exchange Act is recorded, processed, summarized and reported within the time periods specified in the rules, regulations and forms of the SEC, including ensuring that such material information is accumulated by and communicated to our management, including our Chief Executive Officer and our Chief Financial Officer, as appropriate to allow timely decisions regarding required disclosure.
Changes in Internal Control over Financial Reporting
During the quarter ended September 30, 2014, there were no changes in our internal control over financial reporting that have materially affected, or are reasonably likely to materially affect, our internal control over financial reporting.
28
| ITEM 1. | LEGAL PROCEEDINGS |
None.
| ITEM 1A. | RISK FACTORS |
In addition to the risk factors and other information set forth below and elsewhere in this Report, you should carefully consider the information set forth in Part 1, Item 1A. “Risk Factors” in our Annual Report on Form 10-K for the fiscal year ended December 31, 2013.
The payment of dividends to our stockholders is subject to the discretion of our Board of Directors and may be limited by our financial condition, and any applicable laws.
We recently announced a quarterly cash dividend and intend to continue to pay regular dividends to our stockholders. Our Board of Directors may, in its discretion, increase or decrease the level of dividends. Further, our Board of Directors has the discretion to discontinue the payment of dividends entirely. Any determination as to the payment of dividends, as well as the level of such dividends, will depend on, among other things, general economic and business conditions, our level of AUM, our strategic plans, our financial results and condition, and any applicable laws. If, as a consequence of these various limitations and restrictions, we are unable to generate sufficient income from our business, we may need to reduce or eliminate the payment of dividends on our common stock. Any change in the level of our dividends or the suspension of the payment thereof could adversely affect our stock price.
| ITEM 2. | UNREGISTERED SALES OF EQUITY SECURITIES AND USE OF PROCEEDS |
Recent sales of Unregistered Securities
None.
Use of Proceeds
Not applicable.
Purchase of Equity Securities by the Issuer and Affiliated Purchasers
The following table provides information with respect to purchases made by or on behalf of the Company or any “affiliated purchaser” of shares of the Company’s common stock.
| Period |
Total Number of Shares Purchased(1) |
Average Price Paid Per Share(1) |
Total Number of Shares Purchased as Part of Publicly Announced Plans or Programs |
Approximate Dollar Value of Shares that May Yet Be Purchased Under the Plans or Programs |
||||||||||||
| July 1, 2014 to July 31, 2014 |
80,340 | $ | 10.38 | — | $ | — | ||||||||||
| August 1, 2014 to August 31, 2014 |
— | $ | — | — | $ | — | ||||||||||
| September 1, 2014 to September 30, 2014 |
— | $ | — | — | $ | — | ||||||||||
|
|
|
|
|
|||||||||||||
| Total |
80,340 | $ | 10.38 | — | $ | — | ||||||||||
|
|
|
|
|
|||||||||||||
| (1) | The identified shares reflect restricted shares withheld pursuant to the terms of awards granted to employees to offset tax withholding obligations that occur upon vesting and release of the restricted shares. The value of the shares withheld is based upon the volume weighted average price of the common stock on the date of vesting. During the three months ended September 30, 2014, we repurchased 80,340 restricted shares of our common stock withheld pursuant to the terms of awards granted to employees to offset tax withholding obligations for an aggregate price of $833,800 with an average price per share of $10.38. |
29
| ITEM 3. | DEFAULTS UPON SENIOR SECURITIES |
None.
| ITEM 4. | MINE SAFETY DISCLOSURES |
Not applicable.
| ITEM 5. | OTHER INFORMATION |
None.
30
| ITEM 6. | EXHIBITS |
| Exhibit No. |
Description |
Reference |
||||
| 3.1 (1) | Form of Amended and Restated Certificate of Incorporation. | 3.1 | ||||
| 3.2 (1) | Amended and Restated Bylaws. | 3.2 | ||||
| 4.1 (1) | Specimen Common Stock Certificate. | 4.1 | ||||
| 4.2 (1) | Amended and Restated Stockholders Agreement among Registrant and certain investors dated December 21, 2006. | 4.2 | ||||
| 4.3 (1) | Securities Purchase Agreement among Registrant and certain investors dated December 21, 2006. | 4.3 | ||||
| 4.4 (1) | Securities Purchase Agreement among Registrant and certain investors dated October 15, 2009. | 4.4 | ||||
| 4.5 (1) | Third Amended and Restated Registration Rights Agreement dated October 15, 2009. | 4.5 | ||||
| 31.1 (2) | Certification of Chief Executive Officer and Principal Executive Officer pursuant to Rule 13a-14 of the Exchange Act. | |||||
| 31.2 (2) | Certification of Chief Financial Officer and Principal Accounting Officer pursuant to Rule 13a-14 of the Exchange Act. | |||||
| 32 (2) | Section 1350 Certification. | |||||
| 101 (2) | Financial Statements from the Quarterly Report on Form 10-Q of the Company for the quarter ended September 30, 2014, formatted in XBRL: (i) Consolidated Balance Sheets; (ii) Consolidated Statements of Operations and Comprehensive Income (Unaudited); (iii) Consolidated Statements of Cash Flows (Unaudited); and (iv) Notes to Consolidated Financial Statements, as blocks of text and in detail. | |||||
| 101.INS (2) | XBRL Instance Document | |||||
| 101.SCH (2) | XBRL Taxonomy Extension Schema Document | |||||
| 101.CAL (2) | XBRL Taxonomy Extension Calculation Linkbase Document | |||||
| 101.DEF (2) | XBRL Taxonomy Extension Definition Linkbase Document | |||||
| 101.LAB (2) | XBRL Taxonomy Extension Label Linkbase Document | |||||
| 101.PRE (2) | XBRL Taxonomy Extension Presentation Linkbase Document | |||||
| (1) | Incorporated by reference from the Registrant’s Registration Statement on Form 10, filed with the SEC on June 30, 2011. |
| (2) | Filed herewith. |
31
SIGNATURE
Pursuant to the requirements of the Securities Exchange Act of 1934, the registrant has duly caused this Report to be signed on its behalf by the undersigned thereunto duly authorized on this 7th day of November 2014.
| WISDOMTREE INVESTMENTS, INC. | ||
| By: | /s/ Jonathan Steinberg | |
| Jonathan Steinberg | ||
| Chief Executive Officer and President | ||
| (Authorized Officer and Principal Executive Officer) | ||
| WISDOMTREE INVESTMENTS, INC. | ||
| By: | /s/ Amit Muni | |
| Amit Muni | ||
| Executive Vice President—Finance and Chief Financial Officer (Authorized Officer and Principal Financial and Accounting Officer) | ||
32