UNITED STATES
SECURITIES AND EXCHANGE COMMISSION
Washington, D.C. 20549
Form 10-K
(Mark One)
| ☒ | ANNUAL REPORT PURSUANT TO SECTION 13 OR 15(d) OF THE SECURITIES EXCHANGE ACT OF 1934 |
For fiscal year ended December 31, 2017
or
| ☐ | TRANSITION REPORT PURSUANT TO SECTION 13 OR 15(d) OF THE SECURITIES EXCHANGE ACT OF 1934 |
For the transition period from to .
Commission File Number 001-10932
WisdomTree Investments, Inc.
(Exact name of registrant as specified in its charter)
| Delaware | 13-3487784 | |
| (State or other jurisdiction of incorporation or organization) |
(IRS Employer Identification No.) | |
| 245 Park Avenue, 35th Floor New York, New York |
10167 | |
| (Address of principal executive offices) | (Zip Code) | |
212-801-2080
(Registrant’s Telephone Number, Including Area Code)
Securities registered pursuant to Section 12(b) of the Act:
| Title of each class: |
Name of each exchange on which registered: | |
| Common Stock, $0.01 par value | The NASDAQ Stock Market LLC |
Securities registered pursuant to Section 12(g) of the Act:
None
Indicate by check mark if the registrant is a well-known seasoned issuer, as defined in Rule 405 of the Securities Act. ☒ Yes ☐ No
Indicate by check mark if the registrant is not required to file reports pursuant to Section 13 or Section 15(d) of the Act. ☐ Yes ☒ No
Indicate by check mark whether the registrant (1) has filed all reports required to be filed by Section 13 or 15(d) of the Securities Exchange Act of 1934 during the preceding 12 months (or for such shorter period that the registrant was required to file such reports), and (2) has been subject to such filing requirements for the past 90 days. ☒ Yes ☐ No
Indicate by check mark whether the registrant has submitted electronically and posted on its corporate Web site, if any, every Interactive Data File required to be submitted and posted pursuant to Rule 405 of Regulation S-T (§232.405 of this chapter) during the preceding 12 months (or for such shorter period that the registrant was required to submit and post such files). ☒ Yes ☐ No
Indicate by check mark if disclosure of delinquent filers pursuant to Item 405 of Regulation S-K (§229.405 of this chapter) is not contained herein, and will not be contained, to the best of the registrant’s knowledge, in definitive proxy or information statements incorporated by reference in Part III of this Form 10-K or any amendment to this Form 10-K. ☐
Indicate by check mark whether the registrant is a large accelerated filer, an accelerated filer, a non-accelerated filer, a smaller reporting company, or emerging growth company. See definitions of “large accelerated filer,” “accelerated filer,” “smaller reporting company” and “emerging growth company” in Rule 12b-2 of the Exchange Act.
| Large accelerated filer | ☒ | Accelerated filer | ☐ | |||
| Non-accelerated filer | ☐ (Do not check if a smaller reporting company) | Smaller reporting company | ☐ | |||
| Emerging growth company | ☐ | |||||
If an emerging growth company, indicate by check mark if the registrant has elected not to use the extended transition period for complying with any new or revised financial accounting standards provided pursuant to Section 13(a) of the Exchange Act ☐
Indicate by check mark whether the registrant is a shell company (as defined in Rule 12b-2 of the Exchange Act). Yes ☐ No ☒
At June 30, 2017, the aggregate market value of the registrant’s Common Stock held by non-affiliates (computed by reference to the closing sale price of such shares on the NASDAQ Global Select Market on June 30, 2017) was $1,163,237,847. At February 16, 2018, there were 137,731,285 shares of the registrant’s Common Stock outstanding.
DOCUMENTS INCORPORATED BY REFERENCE
The information required by Part III of this Report, to the extent not set forth herein, is incorporated herein by reference from the registrant’s definitive proxy statement relating to the Annual Meeting of Stockholders to be held in 2018, which definitive proxy statement shall be filed with the Securities and Exchange Commission within 120 days after the end of the fiscal year to which this Report relates.
WISDOMTREE INVESTMENTS, INC.
Form 10-K
For the Fiscal Year Ended December 31, 2017
i
CAUTIONARY NOTE REGARDING FORWARD-LOOKING STATEMENTS
This Annual Report on Form 10-K, or Report, contains forward-looking statements that are based on our management’s beliefs and assumptions and on information currently available to our management. Although we believe that the expectations reflected in these forward-looking statements are reasonable, these statements relate to future events or our future financial performance, and involve known and unknown risks, uncertainties and other factors that may cause our actual results, levels of activity, performance or achievements to be materially different from any future results, levels of activity, performance or achievements expressed or implied by these forward-looking statements.
In some cases, you can identify forward-looking statements by terminology such as “may,” “will,” “should,” “expects,” “intends,” “plans,” “anticipates,” “believes,” “estimates,” “predicts,” “potential,” “continue” or the negative of these terms or other comparable terminology. These statements are only predictions. You should not place undue reliance on forward-looking statements because they involve known and unknown risks, uncertainties and other factors, which are, in some cases, beyond our control and which could materially affect our results. Factors that may cause actual results to differ materially from current expectations include, among other things, those listed in the section entitled “Risk Factors” and elsewhere in this Report. If one or more of these or other risks or uncertainties occur, or if our underlying assumptions prove to be incorrect, actual events or results may vary significantly from those implied or projected by the forward-looking statements. No forward-looking statement is a guarantee of future performance. You should read this Report and the documents that we reference in this Report and have filed with the Securities and Exchange Commission, or the SEC, as exhibits to this Report, completely and with the understanding that our actual future results may be materially different from any future results expressed or implied by these forward-looking statements.
In particular, forward-looking statements in this Report may include statements about:
| • | anticipated trends, conditions and investor sentiment in the global markets and exchange traded products, or ETPs; |
| • | anticipated levels of inflows into and outflows out of our ETPs; |
| • | our ability to deliver favorable rates of return to investors; |
| • | our ability to develop new products and services; |
| • | our ability to maintain current vendors or find new vendors to provide services to us at favorable costs; |
| • | our ability to successfully expand our business into non-U.S. markets; |
| • | competition in our business; and |
| • | the effect of laws and regulations that apply to our business. |
The forward-looking statements in this Report represent our views as of the date of this Report. We anticipate that subsequent events and developments may cause our views to change. However, while we may elect to update these forward-looking statements at some point in the future, we have no current intention of doing so except to the extent required by applicable law. Therefore, these forward-looking statements do not represent our views as of any date other than the date of this Report.
1
| ITEM 1. | BUSINESS |
Our Company
We are the only publicly-traded asset management company that focuses exclusively on ETPs, and are one of the leading ETP sponsors in the world based on assets under management, or AUM, with AUM of $48.9 billion globally as of December 31, 2017. An ETP is a pooled investment vehicle that holds a basket of securities, financial instruments or other assets and generally seeks to track (index-based) or outperform (actively managed) the performance of a broad or specific equity, fixed income or alternatives market segment, commodity or currency (or an inverse or multiple thereof). ETPs are listed on an exchange with their shares traded in the secondary market at market prices, generally at approximately the same price as the net asset value of their underlying components. ETP is an umbrella term that includes exchange-traded funds, or ETFs, exchange-traded notes and exchange-traded commodities.
Our U.S. listed ETFs make up the vast majority of our global AUM. As of December 31, 2017, we were the seventh largest ETF sponsor in the U.S. by AUM. Our family of ETFs includes funds that track our own indexes, funds that track third-party indexes and actively managed funds. We distribute our ETFs through all major channels within the asset management industry, including brokerage firms, registered investment advisers and institutional investors.
We focus on creating ETFs for investors that offer thoughtful innovation, smart engineering and redefined investing. Most of our index-based funds employ a fundamentally weighted investment methodology, which weights securities on the basis of factors such as dividends or earnings, whereas most other ETF industry indexes use a capitalization weighted methodology. As of December 31, 2017, 27 of our U.S. listed ETFs had at least a 10-year track record, all of which employed a fundamentally weighted investment methodology and most of which outperformed their comparable benchmarks. We also offer actively managed ETFs, which are ETFs that are not based on a particular index but rather are actively managed with complete transparency into the ETF’s portfolio on a daily basis. Our broad regulatory exemptive relief enables us to use our own indexes for certain of our ETFs and actively manage other ETFs.
Pending Acquisition of ETFS
On November 13, 2017, we entered into a Share Sale Agreement with ETF Securities Limited (“ETF Securities”), pursuant to which we agreed to acquire ETF Securities’ European exchange-traded commodity, currency and short-and-leveraged business (“ETFS”) by purchasing the entire issued share capital of a subsidiary into which ETF Securities will have transferred ETFS prior to completion of the acquisition. ETFS had $17.8 billion of AUM as of December 31, 2017. The acquisition, which is expected to close late in the first quarter of 2018 (subject to regulatory approval and other customary closing conditions), will provide us immediate scale in Europe, an industry leading position in European-listed gold and commodity products, greater AUM diversification globally and profitability within our International Business segment.
Pursuant to the Share Sale Agreement, we will acquire ETFS for a purchase price, subject to customary adjustments for working capital, consisting of $253.0 million in cash (including $53.0 million from cash on hand), 15,250,000 shares of our common stock and 14,750 shares of a new class of Series A Non-Voting Convertible Preferred Stock that is convertible, subject to certain restrictions, into an aggregate of 14,750,000 shares of our common stock.
We have secured commitments for a three-year senior secured debt financing of $250.0 million from Credit Suisse Securities (USA) LLC in support of the acquisition, which will be comprised of a $50.0 million revolving credit facility and a $200.0 million term loan facility. Entering into the credit agreement is subject to customary closing conditions, including, among others, completion of the acquisition.
Completion of the acquisition is subject to customary closing conditions, including, among others, obtaining regulatory approvals and we and ETF Securities entering into an Investor Rights Agreement, pursuant to which, among other things, ETF Securities will be subject to lock-up, standstill and voting restrictions, and will receive certain registration rights with respect to the common stock, including the common stock issuable upon conversion of the Series A Non-Voting Convertible Preferred Stock, it will receive in the transaction. The Share Sale Agreement will terminate if the conditions to complete the acquisition are not satisfied on or prior to May 13, 2018, unless the parties agree to extend such date.
Historical financial statements of ETFS and pro forma financial information will be made publicly available no later than 75 calendar days from completion of the transaction.
2
Business Segments
We operate as an ETP sponsor and asset manager providing investment advisory services in the U.S., Europe, Canada and Japan. These activities are reported in our U.S. Business and International Business segments, as follows:
| • | U.S. Business segment: Our U.S. business and Japan sales office, which primarily engages in selling our U.S. listed ETFs to Japanese institutional clients; and |
| • | International Business segment: Our European business, which commenced in April 2014 in connection with our acquisition of U.K. based ETP sponsor Boost ETP, LLP, and our Canadian business, which launched its first six ETFs in July 2016. This segment will also include ETFS if the acquisition is completed. |
Our Operating and Financial Results
U.S. Business Segment
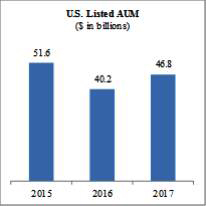
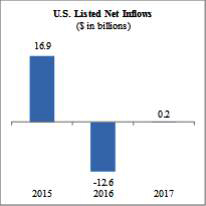
Our U.S. listed ETFs’ AUM increased from $40.2 billion as of December 31, 2016 to $46.8 billion as of December 31, 2017 primarily due to market appreciation and net inflows into certain of our U.S. listed ETFs (including within our international equity, emerging markets, U.S. equity, fixed income and alternative strategy ETFs). These increases were partly offset by outflows primarily in our two largest ETFs, the WisdomTree Europe Hedged Equity Fund (HEDJ) and the WisdomTree Japan Hedged Equity Fund (DXJ).
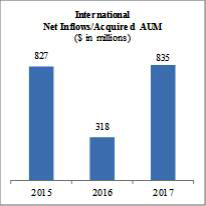
International Business Segment
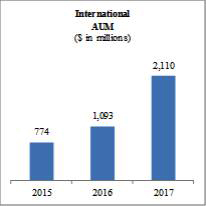
Our international ETFs had net inflows of $834.9 million during the year ended December 31, 2017, including $77.4 million of AUM we acquired from Questrade, Inc. This was a result of inflows of $290.4 million into our European listed ETPs, $340.1 million into our UCITS ETFs and $204.4 million (including $77.4 million of acquired AUM) into our Canadian listed ETFs. Our international AUM increased from $1.1 billion as of December 31, 2016 to $2.1 billion as of December 31, 2017 primarily due to net inflows, and to a lesser extent market appreciation.
3
Consolidated Operating Results
Our revenues, expenses and net income are as follows:
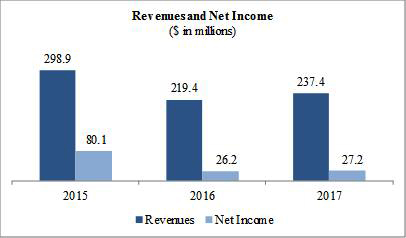
| • | Revenues – We recorded revenues of $237.4 million during the year ended December 31, 2017, up 8.2% from the year ended December 31, 2016 primarily due to a settlement gain of $6.9 million, higher advisory fees due to higher average global AUM and higher interest earned on our investments. |
| • | Expenses – Total expenses increased 9.3% from the year ended December 31, 2016 to $179.2 million primarily due to higher compensation expense partly offset by an acquisition payment expense of $6.7 million and a goodwill impairment charge of $1.7 million recorded in the prior year. |
| • | Net income – Net income increased 4.0% from the year ended December 31, 2016 to $27.2 million. |
4
Assets Under Management
WisdomTree U.S. Listed ETFs
The following charts reflect the distribution and asset mix of our U.S. listed ETFs, which make up the vast majority of our global AUM as of December 31, 2017:
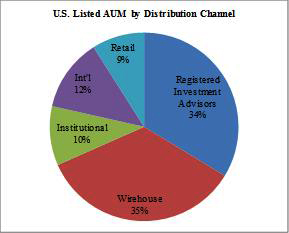
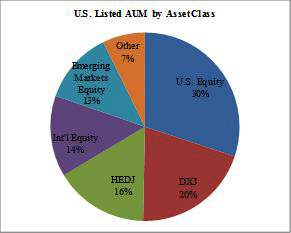
A significant portion of our AUM is held in ETFs that invest in foreign securities. Therefore, our AUM and revenues are affected by movements in global capital market levels and the strengthening or weakening of the U.S. dollar against other currencies. As the chart above reflects, as of December 31, 2017, approximately 36% of our U.S. AUM was concentrated in two products with similar strategies – HEDJ, our European equity ETF which hedges exposure to the Euro, and DXJ, our Japanese equity ETF which hedges exposure to the Yen. The strengthening of the Euro or Yen against the U.S. dollar, or the decline in European or Japanese equity markets, may have an adverse effect on our results.
5
WisdomTree ETPs, including AUM of ETFS (Pro Forma)
The following charts compare the asset mix of our WisdomTree ETPs as of December 31, 2017 with the pro forma asset mix of our WisdomTree ETPs assuming the completion of the acquisition of ETFS at December 31, 2017.


As the charts above reflect, the addition of the AUM of ETFS would improve both fund and investment theme concentrations, resulting in a well-diversified mix with immediate scale in commodities and an industry leading position in European-listed gold products. Our concentrations in HEDJ and DXJ would be reduced by an aggregate of approximately 10 percentage points to 11% and 14%, respectively, and our client base would be further diversified with increased exposure to European domiciled investors, commodity focused investors and new-to-firm clients. In addition, our average global ETP advisory fees of approximately 0.50% are anticipated to decline by approximately 0.01% to 0.49% based upon the pro forma asset mix.
As mentioned above, a substantial portion of the AUM of ETFS are in products backed by gold. These products historically have been negatively correlated with our two largest ETFs, HEDJ and DXJ, and therefore we may experience improved stability of AUM and lower overall AUM volatility if the acquisition of ETFS is completed. However, we can provide no assurance that the negative historical correlation between the AUM of ETFS and the AUM of our two largest ETFs will continue in the future.
Our Industry
An ETF is an investment fund that holds securities such as equities or bonds and/or other assets such as derivatives or commodities, and generally trades at approximately the same price as the net asset value of its underlying components over the course of the trading day. ETFs offer exposure to a wide variety of asset classes and investment themes, including domestic, international and global equities, and fixed income securities, as well as securities in specific industries and countries. There are also ETFs that track certain specific investments, such as commodities, real estate or currencies.
6
We believe ETPs, the vast majority of which are comprised of ETFs, have been one of the most innovative investment products to emerge in the last two decades in the asset management industry. As of December 31, 2017, there were approximately 2,100 ETPs in the U.S. with aggregate AUM of $3.4 trillion.
The chart below reflects the AUM of the global ETP industry since 2002:
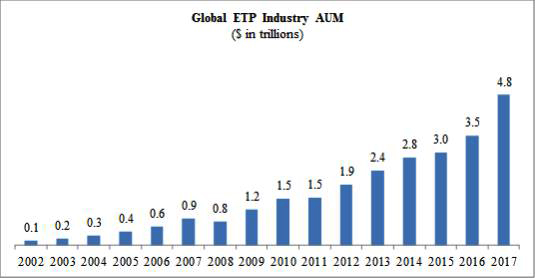
Source: BlackRock
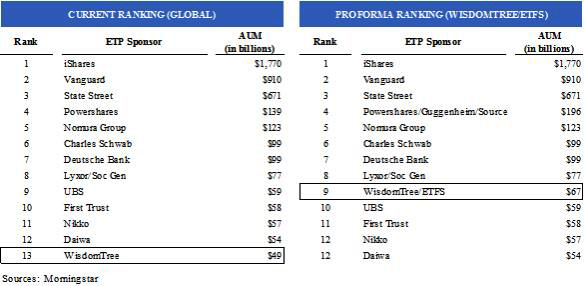
As of December 31, 2017, we were the seventh largest ETF sponsor in the U.S. and the thirteenth largest ETP sponsor globally based on AUM. We estimate that we capture approximately 3% of total U.S. listed advisory fees. If we complete the acquisition of ETFS, we will become the ninth largest ETP sponsor globally and the largest global independent ETP provider based on AUM with significant scale and presence in the U.S. and Europe, the two largest ETP markets.
ETFs have become more popular among a broad range of investors as they come to understand the benefits of ETFs and use them for a variety of purposes and strategies, including low cost index investing and asset allocation, access to specific asset classes, protective hedging, income generation, arbitrage opportunities and diversification.
7
While ETFs are similar to mutual funds in many respects, they have some important differences as well:
| • | Transparency. ETFs disclose the composition of their underlying portfolios on a daily basis, unlike mutual funds, which typically disclose their holdings every 90 days. |
| • | Intraday trading, hedging strategies and complex orders. Like stocks, ETFs can be bought and sold on exchanges throughout the trading day at market prices. ETFs update the indicative values of their underlying portfolios every 15 seconds. As publicly-traded securities, ETF shares can be purchased on margin and sold short, enabling the use of hedging strategies, and traded using limit orders, allowing investors to specify the price points at which they are willing to trade. |
| • | Tax efficiency. In the U.S., whenever a mutual fund or ETF realizes a capital gain that is not balanced by a realized loss, it must distribute the capital gain to its shareholders. These gains are taxable to all shareholders, even those who reinvest the gain distributions in additional shares of the fund. However, most ETFs typically redeem their shares through “in-kind” redemptions in which low-cost securities are transferred out of the ETF in exchange for fund shares in a non-taxable transaction. By using this process, ETFs avoid the transaction fees and tax impact incurred by mutual funds that sell securities to generate cash to pay out redemptions. |
| • | Uniform pricing. From a cost perspective, ETFs are one of the most equitable investment products on the market. Investors in U.S. listed ETFs, regardless of their size, structure or sophistication, pay identical advisory fees. Unlike mutual funds, U.S. listed ETFs generally do not have different share classes or different expense structures for retail and institutional clients and ETFs typically are not sold with sales loads or 12b-1 fees. In many cases, ETFs offer lower expense ratios than comparable mutual funds. |
ETFs are used in various ways by a range of investors, from conservative to speculative uses including:
| • | Low cost index investing. ETFs provide exposure to a variety of broad-based indexes across equities, fixed income, commodities and other asset classes and strategies, and can be used as both long-term portfolio holdings or short-term trading tools. ETFs offer an efficient and less costly method by which to gain exposure to indexes as compared to individual stock ownership. |
| • | Improved access to specific asset classes. Investors often use ETFs to gain access to specific market sectors or regions around the world by investing in an ETF that holds a portfolio of securities in that region or segment rather than buying individual securities. |
| • | Asset allocation. Investors seeking to invest in various asset classes to develop an asset allocation model in a cost-effective manner can do so easily with ETFs, which offer broad exposure to various asset classes in a single security. |
| • | Protective hedging. Investors seeking to protect their portfolios may use ETFs as a hedge against unexpected declines in prices of securities arising from market movements and changes in currency and interest rates. |
| • | Income generation. Investors seeking to obtain income from their portfolios may buy fixed income ETFs that typically distribute monthly income or dividend-paying ETFs that encompass a basket of dividend-paying stocks rather than buying individual stocks. |
| • | Speculative investing. Investors with a specific directional opinion about a market sector may choose to buy or sell (long or short) an ETF covering or leveraging that market sector. |
| • | Arbitrage. Sophisticated investors may use ETFs to exploit perceived value differences between the ETF and the value of the ETF’s underlying portfolio of securities. |
| • | Diversification. By definition, ETFs represent a basket of securities and each fund may contain hundreds or even thousands of different individual securities. The “instant diversification” of ETFs provides investors with broad exposure to an asset class, market sector or geography. |
ETFs are one of the fastest growing sectors of the asset management industry. According to the Investment Company Institute, from January 1, 2015 through December 31, 2017, equity ETFs have generated positive inflows of approximately $709 billion while long-term equity mutual funds have experienced outflows of approximately $492 billion. In addition, ETF fixed income flows are accelerating as a broader range of investors gravitate toward fixed income products in the ETF structure. We believe this trend is due to the inherent benefits of ETFs, that is: transparency, liquidity and tax efficiency.
We believe our growth, and the growth of the ETF industry in general, will continue to be driven by the following factors:
| • | Education and greater investor awareness. Over the last several years, ETFs have been taking a greater share of inflows and AUM from mutual funds. We believe investors have become more aware of some of the deficiencies of mutual funds and other financial products and are increasing their focus on important characteristics of their traditional investments—namely transparency, tradability, liquidity, tax efficiency and fees. Their attention and education focused on these important investment characteristics may be one of the drivers of the shift in inflows from traditional mutual funds to |
8
| ETFs. We believe as investors continue to become more aware and educated about ETFs and their benefits, ETFs will continue to take market share from traditional mutual funds and other financial products or structures such as hedge funds, separate accounts and individual stocks. |
| • | Move to fee-based models. In April 2016, the Department of Labor, or DOL, published its final rule to address conflicts of interest in retirement advice, commonly referred to as the Fiduciary Rule, and full compliance with the rule is required by July 1, 2019. In response to the Fiduciary Rule, many financial advisors over the last several years have changed the revenue model that they charge clients from one that is “transaction-based,” that is, based on commissions for trades or receiving sales loads, to a “fee-based” approach, where an overall fee is charged based on the value of AUM. This fee-based approach lends itself to the adviser selecting no-load, lower-fee financial products, and in our opinion, better aligns advisers with the interests of their clients. Since ETFs generally charge lower fees than mutual funds, we believe this model shift will benefit the ETF industry. As major brokerage firms and asset managers encourage their advisers to move towards fee-based models, we believe overall usage of ETFs likely will increase. |
| • | Innovative product offerings. Historically, ETFs tracked traditional equity indexes, but the volume of ETF growth has led to significant innovation and product development. As demand has increased, the number of ETFs also has increased and today, ETFs are available for virtually every asset class including fixed income, commodities, alternative strategies, leveraged/inverse, real estate and currencies. However, we believe that there remain substantial areas for ETF sponsors to continue to innovate, including alternative- and investment theme-based strategies, hard and soft commodities, and actively managed strategies. We also believe the further expansion of ETFs will fuel additional growth and investments from investors who typically access these products through hedge funds, separate accounts, stock investments or the futures and commodity markets. |
| • | New distribution channels. Online retail discount brokers now offer free trading and promotion of select ETFs. We believe the promotion of ETF trading by discount brokers and their marketing of ETFs and model portfolios to a wider retail channel, will contribute to the growth of ETFs. Additionally, digital wealth management is evolving and online tools and robo-advisors are gaining wider acceptance with retail investors to assist with investment decisions. These advisors are increasingly utilizing model portfolios, which we believe will also contribute to the growth of ETFs. Institutional investors such as pensions, endowments and even mutual funds are also increasing their use of ETFs as trading tools as well as core holdings. |
| • | Changing demographics. As the “baby boomer” generation continues to mature and retire, we expect that there will be a greater demand for a broad range of investment solutions, with an emphasis on income generation and principal protection, and that more of these investors will seek advice from professional financial advisors. We believe these financial advisors will migrate more of their clients’ portfolios to ETFs due to their lower fees, better fit within fee-based models, and their ability to provide access to more diverse market sectors, improve multi-asset class allocation, and be used for different investment strategies, including income generation. Overall, we believe ETFs are well-suited to meet the needs of this large and important group of investors. In addition, since many younger investors and financial advisors have demonstrated a preference for the ETF structure over traditional product structures, we believe that wealth transfers from one generation to another will also have a positive effect on ETF industry growth. |
| • | International Markets. We believe the growth of ETFs is a global phenomenon. While the U.S. currently represents the vast majority of global ETF assets, Europe, Canada, Asia and Latin America are growing. Many of the same growth drivers powering the U.S. ETF industry are taking hold in global markets. Additionally, there is an increasing trend of non-U.S. institutional investors investing in U.S.-listed ETFs. |
| • | U.S. Regulation. In response to the Fiduciary Rule, which requires full compliance by July 1, 2019, the shift from commission- to fee-based advisory models has accelerated as several large asset management firms have announced and implemented changes to their platforms and policies that favor fee based account structures. Also, in response to the Fiduciary Rule, several fund sponsors have implemented further fee reductions which have occurred primarily in commoditized exposures based upon third-party indexes. We believe that ETFs’ competitiveness generally will increase as a result of the Fiduciary Rule due to the inherent benefits of ETFs – transparency and liquidity; and while we are not immune to fee pressure, we believe our proprietary approach and self-indexing differentiates us from the competition. |
Additionally, while the shift toward fee-based models continues to take hold in the U.S. market as described above, regulatory initiatives in international markets are accelerating this trend in new markets. We believe regulations that discourage a commission model and mandate transparency of fees are conducive for ETF growth.
Our Competitive Strengths
| • | Well-positioned in large and growing markets. We believe that ETFs are well positioned to grow significantly faster than the asset management industry as a whole, making our focus on ETFs a significant advantage versus other traditional asset management firms. At December 31, 2017, we were the seventh largest ETF sponsor in the U.S. by AUM. In the ETF |
9
| industry, being a first mover, or one of the first providers of ETFs in a particular asset class, can be a significant advantage. We believe that our early leadership in a number of asset classes positions us well to maintain a leadership position. |
| • | Strong performance. We create our own indexes, most of which weight companies in our equity ETFs by a measure of fundamental value and are rebalanced annually. By contrast, traditional indexes are market capitalization weighted and tend to track the momentum of the market. In addition, we also offer actively managed ETFs, as well as ETFs based on third-party indexes. In evaluating the performance of our U.S. listed equity, fixed income and alternative ETFs against actively managed and index based mutual funds and ETFs, 91.6% of the $46.0 billion invested in our ETFs and 68.7% (46 of 67) of our ETFs covered by Morningstar as of December 31, 2017 outperformed their comparable Morningstar average since inception. |
| • | Differentiated product set, powered by innovation. We have a broad and diverse product set. Our products span a variety of traditional and high growth asset classes, including equities, fixed income, currencies and alternatives, and include both passive and actively managed funds. Our innovations include launching the industry’s first emerging markets small-cap equity ETF, the first actively managed currency ETFs, one of the first international local currency denominated fixed income ETFs, the first managed futures strategy ETF, the first currency hedged international equity ETFs in the U.S. and the first smart beta corporate bond suite. |
Our product development strategy utilizes:
| • | Self-indexing. The majority of our ETFs are based on proprietary WisdomTree indexes which we believe gives us several advantages. First, it minimizes our third-party index licensing fees, which increases our profitability. Second, because we develop our own intellectual property, we are intimately familiar with our strategies and able to effectively communicate their value proposition in the market with research content and support. Third, it can enhance our speed to market and first mover advantage. Fourth, because these indexes are proprietary to WisdomTree, we may face similar competition, but we never face exact competition. |
| • | Broad regulatory relief. Our broad exemptive relief also allows us to bring unique products to markets, including actively managed funds. |
We believe that our expertise in product development combined with our self-indexing capabilities and regulatory exemptive relief provides a strategic advantage, enabling us to launch innovative ETFs.
| • | Extensive marketing, research and sales efforts. We have invested significant resources to establish the WisdomTree brand through targeted television, print and online advertising, social media, as well as through our public relations efforts. Close to half of our employees are dedicated to marketing, research and sales. Our sales professionals are the primary points of contact for financial advisors, independent advisory firms and institutional investors who use our ETFs. Their efforts are enhanced through value-added services provided by our research and marketing efforts. We have strong relationships with financial advisors at leading national brokerage firms, registered investment advisers and high net worth advisers. We believe that by strategically aligning these adviser relationships and marketing campaigns with targeted research and sales initiatives and products that align with market sentiment, we differentiate ourselves from our competitors. |
| • | Efficient business model with lower risk profile. We have invested heavily in the internal development of our core competencies with respect to product development, marketing, research and sales of ETFs. We outsource to third parties those services that are not our core competencies or may be resource or risk intensive, such as the portfolio management responsibilities and fund accounting operations of our ETFs. In addition, since we create our own indexes for most of our ETFs, we usually do not incur many licensing costs. |
| • | Strong, seasoned and creative management team. We have built a strong and dedicated senior leadership team. Most of our leadership team has significant ETF or financial services industry experience in fund operations, regulatory and compliance oversight, product development and management or marketing and communications. We believe our team, by developing an ETF sponsor from the ground up despite significant competitive, regulatory and operational barriers, has demonstrated an ability to innovate as well as recognize and respond to market opportunities and effectively execute our strategy. |
10
Our Growth Strategies
Our goal is to become one of the top five ETF sponsors in the world. We believe our continued execution will enable us to increase trading volumes and build longer performance track records, which should allow us to attract additional investors and, in turn, further grow our AUM. We will seek to increase our market share and build additional scale by continuing to implement the following growth strategies:
| • | Foster deeper relationships through technology-driven solutions. We believe that the asset management industry is undergoing rapid change and technology is altering the way financial advisors conduct business. In October 2017, we launched our Advisor Solutions program, which is focused on providing technology-enabled solutions to help financial advisors address technology challenges and grow and scale their businesses. |
The Advisor Solutions program includes:
| • | wealth investment research and ETF education; |
| • | portfolio construction services such as the Digital Portfolio Developer, or DPD, an enhanced portfolio construction tool that assists financial advisors in analyzing an existing investment portfolio by analyzing the data and providing alternative portfolio approaches to consider in seeking to improve outcomes based on different measures; |
| • | access to ETF model portfolios, which are currently available on several platforms. Our model portfolios are a natural extension of our research capabilities and provide advisors access to an open-architecture approach, a tenured team and a firm dedicated to innovation and value creation; |
| • | practice management resources, including access to thought leaders in retirement planning, leadership and behavioral finance; and |
| • | wealth management technology through AdvisorEngine Inc., a customizable end-to-end platform for financial advisors. AdvisorEngine offers an array of distinct product offerings that provide advisors with new client prospecting tools, online client onboarding, institutional grade analytics, trading, performance reporting and billing. Its technology is distinctive in that it provides these features from an advisor-centric point of view, allowing advisors to deepen their engagement with clients and demonstrate the value of the advisory relationship. |
| • | Increase penetration within existing distribution channels and expand into new distribution channels. We believe there is an opportunity to increase our market share by further penetrating existing distribution channels, expanding into new distribution channels and cross-selling additional WisdomTree ETFs. We are working to achieve these objectives as follows: |
| • | Enter into new distribution and other commercial arrangements. In October 2017, 72 of our U.S. listed ETFs were added to TD Ameritrade’s expanded and enhanced commission-free ETF program, which allows for investors using the TD Ameritrade platform to purchase these ETFs without incurring the costs of trading commission fees. This commission-free access spans asset classes including equities, fixed income and alternatives, and includes a variety of investment categories in which we are a smart beta ETF provider. In January 2018, our commission-free ETF model portfolios became available on the TD Ameritrade Institutional Model Market Center, which offers financial advisors the ability to subscribe to third-party models and personalize portfolios according to their clients’ unique needs. We plan to continue to enter into new distribution and other commercial arrangements to deepen and broaden our distribution capabilities. |
| • | Leverage data to serve and expand investor base and improve sales and marketing effectiveness. During June 2017, we collaborated with IBM’s Advanced Analytics practice and global consulting agency Bluewolf, an IBM Company, to develop a cognitive customer-focused lead prioritization system leveraging IBM Watson to enhance our distribution efforts. The system evaluates data across structured and unstructured sources such as historical investment data, market data and investor activity history, extracting behavioral insights, and is designed to enable our sales and marketing teams to optimize outreach to our current and potential investor base. |
| • | Grow our international business. Our proposed acquisition of ETFS, which includes $17.8 billion of AUM as of December 31, 2017, will provide us with immediate scale in Europe, an industry leading position in European-listed gold and commodity products, greater AUM diversification globally, and profitability within our International Business segment. In addition, we have taken the following steps over the past few years to broaden our reach around the world: |
| • | Europe. In April 2014, we acquired a majority stake in our European business and accelerated the buyout of the remaining minority interest in May 2016. Through this platform, we currently have listed 70 European listed ETPs and 17 WisdomTree branded UCITS ETFs, and for some have created additional currency-hedged share classes, on the London Stock Exchange, Borsa Italiana, Deutsche Börse and SIX Swiss Exchange, and we continue to manage and grow the Boost lineup of ETPs under the Boost brand. |
11
| • | Canada. The completion of our transaction with Questrade in November 2017 represented another milestone for the growth of our business in this key market and reflects our strong commitment to Canada. We first established an office in Toronto in April 2016 and began distributing a select range of locally listed ETFs in July 2016. We currently have listed 12 WisdomTree branded Canadian ETFs. |
| • | Latin America. We have cross-listed many of our ETFs on the Mexican stock exchange, targeting institutional investors trading foreign securities in Mexico. A total of 42 WisdomTree strategies are currently listed on the Bolsa Mexicana de Valores, including 32 U.S. listed ETFs and 10 UCITS ETFs. We are also party to a marketing arrangement with the Compass Group to market WisdomTree ETFs in Latin America. |
| • | Israel. In 2015, we entered into a marketing arrangement to market our U.S. listed ETFs in Israel. |
| • | Japan. In February 2017, Monex Securities, a leading Japanese online securities firm, began providing WisdomTree ETFs through Japan’s first commission-free program offered to individual investors. In February 2016, we began selling our U.S. listed ETFs to the institutional market through our sales office in Japan. Moreover, we have made regulatory filings in Japan which permit 30 of our U.S. listed ETFs to be marketed to retail investors in Japan. In addition, key personnel from our Japan office travel globally to market our Japan themed ETFs to institutional investors outside of Japan. |
| • | China. In July 2016, we entered into a global product partnership with ICBC Credit Suisse Asset Management (International) Company Limited to launch, market and distribute ETFs that track the S&P China 500 Index. A Luxembourg UCITS ETF listed in Europe in July 2016 marked the first product in this collaboration. |
| • | Asian countries, excluding Japan. In February 2018, we entered into an agreement with Premia Partners Company Limited in which Premia Partners will support us with respect to our U.S. listed ETFs on promotional, marketing, product consulting and general education activities in specific Asian countries, excluding Japan. |
As ETFs are increasingly traded globally, we believe that international expansion of our marketing, communication and sales strategies will provide significant growth avenues to participate in new regional markets as well as increasing cross-border investments by non-U.S. institutional investors.
| • | Launch innovative new products that diversify our product offerings and revenues. We believe our track record demonstrates that we can create and sell innovative ETFs that meet market demand. For example, we have established a platform for offering collective investment funds under the WisdomTree Collective Investment Trust, or CIT, to target the retirement sector. The CIT is exempt from registration with the SEC as a bank-maintained collective investment fund established for employee benefit trusts. We believe that continued launches of new products will strengthen our business by allowing us to realize new inflows, maintain and grow our AUM and generate revenues across different market cycles as particular investment strategies move in and out of favor. |
| • | Selectively pursue acquisitions or other strategic transactions. We may pursue acquisitions or other strategic transactions that will enable us to strengthen our current business, expand and diversify our product offering, increase our AUM or enter into new markets. We believe pursuing acquisitions or other strategic transactions is a cost-effective means of growing our business and AUM. For example, in November 2017, we agreed to acquire ETFS, which includes $17.8 billion of AUM as of December 31, 2017. Also, in November 2017, we acquired a suite of eight Canadian listed ETFs from Questrade, which represented approximately $77.4 million in AUM at closing. As part of the transaction, our Canadian subsidiary became a premier provider of ETFs available for purchase on a commission-free basis on Questrade’s self-directed platform, including all of our Canadian listed ETFs. |
Regulatory Framework of the ETF Industry
Not all ETPs are ETFs. ETFs are a distinct type of security with features that are different than other ETPs. ETFs are open-end investment companies or unit investment trusts regulated in the U.S. by the Investment Company Act of 1940, or the Investment Company Act. This regulatory structure is designed to provide investor protection within a pooled investment product. For example, the Investment Company Act requires that at least 40% of the Trustees for each ETF must not be affiliated persons of the fund’s investment manager, or Independent Trustees. If the ETF seeks to rely on certain rules under the Investment Company Act, a majority of the Trustees for that ETF must be Independent Trustees. In addition, as discussed below, ETFs have received orders from the staff of the SEC which exempt them from certain provisions of the Investment Company Act; however, ETFs generally operate under regulations that prohibit affiliated transactions, are subject to standard pricing and valuation rules and have mandated compliance programs. ETPs can take a number of forms in addition to ETFs, including exchange traded notes, grantor trusts or limited partnerships. In the U.S. market, a key factor differentiating ETFs, grantor trusts and limited partnerships from exchange traded notes is that the former hold assets underlying the ETP. Exchange traded notes, on the other hand, are debt instruments issued by the exchange traded note sponsor. Also, each of these structures has implications for taxes, liquidity, tracking error and credit risk.
12
Because ETFs do not fit into the regulatory provisions governing mutual funds, ETF sponsors need to obtain “exemptive relief” from the SEC from certain provisions of the Investment Company Act in order to operate ETFs. This exemptive relief allows the ETF sponsor to bring to market the specific products or structures for which the relief was requested and obtained. Applying for exemptive relief can be costly and take several months to several years depending on the type of exemptive relief sought. See “Business—Regulation” below.
Our U.S. Listed Products
As of December 31, 2017, we offered a comprehensive family of 89 ETFs.
International Hedged Equity ETFs
In June 2006, we launched DXJ, the U.S. industry’s first currency hedged equity ETF, and in December 2009 we launched HEDJ, our second currency hedged ETF, which together represent our two largest ETFs. We currently have 20 such ETFs in the market. These ETFs provide exposure to a specified international equity market while hedging the currency exposure of that market relative to the U.S. dollar. In 2016, we launched dynamic currency hedged ETFs, including the Dynamic Currency Hedged International Equity ETF (DDWM), which was the most successful ETF launched in the U.S. in 2016 based on total AUM. Our international hedged equity ETFs are sub-advised by Mellon Capital, a subsidiary of The Bank of New York Mellon Corporation, or BNY Mellon.
Equity ETFs
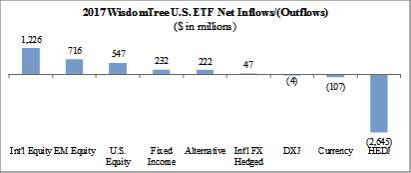
We offer equity ETFs that provide access to the securities of large, mid and small-cap companies located in the U.S., international developed markets and emerging markets, as well as particular market sectors and styles. Our equity ETFs track our own indexes, the majority of which are fundamentally weighted as opposed to market capitalization weighted indexes, which assign more weight to stocks with the highest market capitalizations. These fundamentally weighted indexes focus on securities of companies that pay regular cash dividends or on securities of companies that have generated positive cumulative earnings over a certain period. We believe weighting equity markets by dividends and income, rather than by market capitalization, can provide investors with better risk-adjusted returns over longer term periods in core equity exposures. Our equity ETFs are sub-advised by Mellon Capital. In 2016, we experienced a record year of net inflows of $1.9 billion into our U.S. equity ETFs and had $547.0 million of additional inflows in 2017. In addition, inflows into our international equity and emerging markets ETFs were $1.2 billion and $716.2 million, respectively.
Fixed Income ETFs
In 2010, we began launching international fixed income ETFs. Currently, these ETFs invest in emerging market countries, Asia Pacific ex-Japan countries or Australia and New Zealand. These ETFs are denominated in either local or U.S. currencies. We intend to launch additional fixed income bond funds and broaden our product offerings in this category. In December 2013, we launched a suite of rising rate bond ETFs based on leading fixed income benchmarks we license from third parties. In July 2015, we launched an ETF that seeks to track a yield-enhanced index of U.S. investment grade bonds and in 2016 we launched the industry’s first smart beta corporate bond suite. Our fixed income ETFs are sub-advised by either Mellon Capital or Voya Investment Management, a subsidiary of Voya Financial Inc.
Currency ETFs
We launched the industry’s first currency ETFs in May 2008 using our regulatory exemption for actively managed funds. We offer currency ETFs that provide investors with exposure to developed and emerging markets currencies, including the Chinese Yuan and the Brazilian Real. In December 2013, we launched a U.S. Dollar Bullish Fund licensing a new Bloomberg index. Currency ETFs invest in U.S. money market securities, forward currency contracts and swaps and seek to achieve the total returns reflective of both money market rates in selected countries available to foreign investors and changes to the value of these currencies relative to the U.S. dollar. Our currency ETFs are sub-advised by Mellon Capital.
Alternative Strategy ETFs
In 2011, we launched the industry’s first managed futures strategy ETF and a global real return ETF. In 2015, we launched a dynamic long/short U.S. equity ETF and a dynamic bearish U.S. equity ETF. In 2016, we launched a collateralized put write strategy ETF on the S&P 500 index. We also intend to explore additional alternative strategy products in the future. Our managed futures strategy ETF and dynamic long/short and bearish U.S. equity ETFs are sub-advised by Mellon Capital.
13
Commodity ETFs
In January 2016, we acquired the managing owner of the GreenHaven Continuous Commodity Index Fund, which has been renamed the WisdomTree Continuous Commodity Index Fund (NYSE Arca: GCC).
Our International Listed Products
WisdomTree UCITS ETFs
In connection with the acquisition of our current European business in April 2014 and its subsequent build out, we have launched 17 UCITS ETFs, and for some have created additional currency-hedged share classes, on the London Stock Exchange, Borsa Italiana, Deutsche Börse and SIX Swiss Exchange, providing exposure to large and small-cap U.S., European and emerging markets equities, as well as a diversified commodities strategy.
Boost ETPs
As part of the acquisition of our current European business in April 2014, we acquired Boost’s equity, commodity, fixed income and currency ETPs, which are listed in Europe. As of December 31, 2017, there were 70 ETPs on the European platform.
Canadian ETFs
In April 2016, we established an office in Toronto and in July 2016 began distributing a select range of locally listed ETFs. In November 2017, we acquired a suite of eight Canadian listed ETFs from Questrade which represented approximately $77.4 million in AUM at closing. Most of these ETFs were merged into our existing Canadian listed ETFs. We currently have listed 12 WisdomTree branded Canadian ETFs.
ETFS Products
If we complete the acquisition of ETFS, we will have acquired a suite of European exchange-traded commodity, currency and short-and-leveraged products with AUM of $17.8 billion as of December 31, 2017.
Sales, Marketing and Research
We distribute our ETFs through all major channels within the asset management industry, including brokerage firms, registered investment advisers and institutional investors. Our primary sales efforts are not directed towards the retail segment but rather are directed towards the financial or investment adviser who acts as the intermediary between the end-client and us. We do not pay commissions nor do we offer 12b-1 fees to financial advisors to use or recommend the use of our ETFs.
We have developed an extensive network and relationships with financial advisors and we believe our ETFs and related research are well structured to meet their needs and those of their clients. We have taken steps to enhance and form new relationships through our Advisor Solutions program which focuses on providing technology-enabled solutions to help financial advisors grow and scale their businesses. Our sales professionals act in a consultative role to provide financial advisors with value-added services. We seek to consistently grow our network of financial advisors and we opportunistically seek to introduce new products and services that best deliver our investment strategies to investors through these distribution channels. We have our own team of approximately 74 sales professionals globally as of December 31, 2017. If we complete the acquisition of ETFS, we estimate that the number of our sales professionals globally will be 77 when taking into consideration the realization of synergies. We have restructured our U.S. sales force to enhance our interactions with financial advisors and plan to continue to invest in sales-related resources over the course of 2018 to further penetrate existing sales channels, and to better service new emerging distribution channels.
In addition, we have agreements with third parties to serve as the external marketing agents for the WisdomTree ETFs in Latin America, Australia, New Zealand, Israel and specific Asian countries, excluding Japan, as well as with certain brokerage firms to allow certain of our ETFs to trade commission free on their brokerage platforms in exchange for a percentage of our advisory fee revenues from certain AUM. We believe these arrangements expand our distribution capabilities in a cost-effective manner and we may continue to enter into such arrangements in the future.
Our marketing efforts are focused on three objectives: generating new clients and inflows to our ETFs; retaining existing clients, with a focus on cross-selling additional WisdomTree ETFs; and building brand awareness. We pursue these objectives through a multi-faceted marketing strategy targeted at financial advisors. We utilize the following strategies:
| • | Targeted advertising. We create highly targeted multi-media advertising campaigns limited to established core financial media. For example, our television advertising runs exclusively on the cable networks CNBC, Fox Business and Bloomberg Television; online advertising runs on investing or ETF-specific web sites, such as www.seekingalpha.com and www.etfdatabase.com; and advertising runs in core financial publications, including Barron’s, Pensions & Investments and Investor’s Business Daily. |
| • | Media relations. We have a full time public relations team who has established relationships with the major financial media outlets including: The Wall Street Journal, Barron’s, Financial Times, Bloomberg, Reuters, New York Times and USA Today. We utilize these relationships to help create awareness of the WisdomTree ETFs and the ETF industry in general. Several members of our management team and multiple members of our research team are frequent market commentators and conference panelists. |
14
| • | Direct marketing. We have a database of financial advisors to which we regularly market through targeted and segmented communications, such as on-demand research presentations, ETF-specific or educational events and presentations, quarterly newsletters and market commentary from our senior investment strategy adviser, Professor Jeremy Siegel. |
| • | Social media. We have implemented a social media strategy that allows us to connect directly with financial advisors and investors by offering timely access to our research material and more general market commentary. Our social media strategy allows us to continue to enhance our brand reputation of expertise and thought leadership in the ETF industry. For example, we have an established presence on LinkedIn, Twitter and YouTube, and our blog content is syndicated across multiple business-oriented websites. |
| • | Sales support. We create comprehensive materials to support our sales process including whitepapers, research reports, webinars, blogs, podcasts, videos and performance data for our ETFs. |
We will continue to evolve our marketing and communication efforts in response to changes in the ETF industry, market conditions and marketing trends.
Our research team has three core functions: index development and oversight, investment research and sales support. In its index development and oversight role, the research group is responsible for creating the investment methodologies and overseeing the maintenance of our indexes that the WisdomTree ETFs are designed to track. The team also provides a variety of investment research around these indexes and market segments. Our research is typically academic-type research to support our products, including white papers on the strategies underlying our indexes and ETFs, investment insights on current market trends, and types of investment strategies that drive long-term performance. We distribute our research through our sales professionals, online through our website and blog, targeted emails to financial advisors, or through financial media outlets. On some occasions, our research has been included in “op-ed” articles appearing in The Wall Street Journal. Shorter research notes are also developed to promote our ideas, which are distributed online through social media channels. Finally, the research team supports our sales professionals in meetings as market experts and through custom analysis on client portfolio holdings. In addition, we consult with our senior investment strategy adviser, Professor Jeremy Siegel, on product development ideas and market commentaries.
Product Development
We are focused on driving continued growth through innovative product development. Due to our broad based regulatory exemptive relief, proprietary index development capabilities and a strategic focus on product development at the senior management level, we have demonstrated an ability to launch innovative and differentiated ETFs. When developing new funds, we seek to introduce product that can be first to market, offer improvement in structure or strategy relative to an incumbent product or offer some other key distinction relative to an incumbent product. In short, we want to add choice in the market and seek to introduce thoughtful investment solutions by avoiding commoditized products. Lastly, when launching new products, we seek to expand and diversify our overall product line.
Competition
The asset management industry is highly competitive and we face substantial competition in virtually all aspects of our business. Factors affecting our business include fees for our products, investment performance, brand recognition, business reputation, quality of service and the continuity of our financial advisor relationships. We compete directly with other ETF sponsors and mutual fund companies and indirectly against other investment management firms, insurance companies, banks, brokerage firms and other financial institutions that offer products that have similar features and investment objectives to those offered by us. The vast majority of the firms we compete with are subsidiaries of large diversified financial companies and many others are much larger in terms of AUM, years in operations and revenues and, accordingly, have much larger sales organizations and budgets. In addition, these larger competitors may attract business through means that are not available to us, including retail bank offices, investment banking, insurance agencies and broker-dealers.
The ETF industry is becoming significantly more competitive. There has been increased price competition in not only commoditized product categories such as traditional, market capitalization weighted index exposures, but also in fundamental or other non-market cap weighted or factor-based exposures. Certain ETF sponsors have been reducing fees, which has been a trend over the last few years that accelerated meaningfully in 2017. Funds are being offered with fees of 20 bps or less, which attracted approximately 70% of the net flows into U.S. listed ETFs during the year ended December 31, 2017. In addition, existing players have broadened their suite of products offering strategies that are, in some cases, similar to ours. Large traditional asset managers are also launching ETFs, some with similar strategies as well.
15
While low cost ETFs have accumulated a significant amount of AUM recently, these same funds have captured only 34% of the revenues associated with the net flows into U.S. listed ETFs during 2017. In addition, in the ETF industry, being a first mover, or one of the first providers of ETFs in a particular asset class, can also be a significant advantage, as the first ETF in a category to attract scale in AUM and trading liquidity is generally viewed as the most attractive ETF. We believe that our early launch of ETFs in a number of asset classes or strategies, including fundamental weighting and currency hedging, positions us well to maintain our position as one of the leaders of the ETF industry. Additionally, we believe our affiliated indexing or “self-indexing” model enables us to launch proprietary products which do not have exact competition.
We believe our ability to successfully compete will depend largely on our competitive product offerings and our ability to offer exposure to compelling investment strategies, develop distribution relationships, create new investment products, build trading volume, AUM and outperforming track records in existing funds, offer a diverse platform of investment choices, build upon our brand and attract and retain talented sales professionals and other employees.
U.S. Regulation
The investment management industry is subject to extensive regulation and virtually all aspects of our business are subject to various federal and state laws and regulations. These laws and regulations are primarily intended to protect investment advisory clients and shareholders of registered investment companies. These laws generally grant supervisory agencies broad administrative powers, including the power to limit or restrict the conduct of our business and to impose sanctions for failure to comply with these laws and regulations. Further, such laws and regulations may provide the basis for examination, inquiry, investigation, enforcement action and/or litigation that may also result in significant costs to us.
We are primarily subject to the following laws and regulations, among others. The costs of complying with such laws and regulations have increased and will continue to contribute to the costs of doing business:
| • | The Investment Advisers Act of 1940 (Investment Advisers Act). The SEC is the federal agency generally responsible for administering the U.S. federal securities laws. WisdomTree Asset Management, Inc., or WTAM, one of our subsidiaries, is registered as an investment adviser under the Investment Advisers Act and, as such, is regulated by the SEC. The Investment Advisers Act requires registered investment advisers to comply with numerous and broad obligations, including, among others, recordkeeping requirements, operational procedures, registration and reporting and disclosure obligations. |
| • | The Investment Company Act of 1940 (ICA). Nearly all of our WisdomTree ETFs are registered with the SEC pursuant to the Investment Company Act. These WisdomTree ETFs must comply with the requirements of the Investment Company Act and other regulations related to publicly offering and listing shares, as well as conditions imposed in the exemptive orders received by the ETFs, including, among others, requirements relating to operations, fees charged, sales, accounting, recordkeeping, disclosure and governance. In addition, the SEC has proposed, and is expected to continue to propose, new and/or revised provisions under the ICA that may impact current and future ETF investments and/or operations. |
| • | Broker-Dealer Regulations. Although we are not registered with the SEC as a broker-dealer under the Securities Exchange Act of 1934, as amended, or Exchange Act, nor are we a member firm of the Financial Industry Regulatory Authority, or FINRA, many of our employees, including all of our salespersons, are licensed with FINRA and are registered as associated persons of the distributor of the WisdomTree ETFs and, as such, are subject to the regulations of FINRA that relate to licensing, continuing education requirements and sales practices. FINRA also regulates the content of our marketing and sales material. |
| • | Internal Revenue Code. The WisdomTree Trust generally has obligations with respect to the qualification of the registered investment company for pass-through tax treatment under the Internal Revenue Code. |
| • | U.S. Commodity Futures Trading Commission (CFTC) and National Futures Association (NFA). In 2012, the CFTC adopted regulations that have required us to become a member of the NFA and register as a commodity pool operator for a select number of our ETFs. In addition, in January 2016, we acquired the ownership interest in two commodity pool operators (one of which has since been dissolved) to ETFs that are not registered under the ICA and are thereby subject to additional requirements imposed by the CFTC and NFA. Each commodity pool operator is required to comply with numerous CFTC and NFA requirements. |
| • | Dodd-Frank Wall Street Reform and Consumer Protection Act of 2010. This comprehensive overhaul of the financial services regulatory environment requires federal agencies to implement numerous new rules, which, as they are adopted, may impose additional regulatory burdens and expenses on our business, and also may negatively impact WisdomTree ETFs. |
| • | Employee Retirement Income Security Act of 1974 (ERISA). As investment adviser to the CIT, WTAM will be subject to the fiduciary responsibility standards and prohibited transaction restrictions of ERISA and will be required to comply with certain requirements under ERISA to satisfy those standards and avoid liability. Further, the DOL issued its Fiduciary Rule in 2016, which expanded the “investment advice fiduciary” definition under ERISA and could subject WTAM to certain aspects of this rule. |
16
With respect to ETFs registered under the ICA, because such ETFs do not fit into the regulatory provisions governing mutual funds, ETF sponsors need to obtain from the SEC exemptive relief from certain provisions of the ICA in order to operate ETFs. This exemptive relief allows the ETF sponsor to bring products to market for the specific products or structures for which the relief was requested and obtained. Applying for exemptive relief can be costly and take several months to several years depending on the type of exemptive relief sought. In addition, each WisdomTree ETF is listed on a secondary market, (each, an Exchange) and any new WisdomTree ETF will seek listing on an Exchange. While the SEC has already approved rules for Exchanges to allow index-based ETFs and active ETFs to list that meet prescribed requirements (e.g., minimum number, market value and trading volume of securities in the new ETF’s benchmark index or in its portfolio, as applicable), these rules do not allow ETFs that do not meet the prescribed requirements without specific SEC approval. The SEC approval process has historically taken months to complete and, in some cases, years. The SEC may ultimately determine not to allow such potential new WisdomTree ETFs or may require strategy modifications prior to approval.
FINRA rules and guidance may affect how WisdomTree ETFs are sold by member firms. Although we currently do not offer so-called leveraged ETFs in the U.S., which may include within their holdings derivative instruments such as options, futures or swaps to obtain leveraged exposures, recent FINRA guidance on margin requirements and suitability determinations with respect to customers trading in leveraged ETFs may influence how member firms effect sales of certain WisdomTree ETFs, such as our currency ETFs, which also use some forms of derivatives, including forward currency contracts and swaps, our international hedged equity ETFs, which use currency forwards, and our rising rates bond ETFs and alternative strategy ETFs, which use futures or options. In September 2015, FINRA issued an investor alert to help investors better understand “smart beta” products, or products that are linked to and seek to track the performance of alternatively weighted indices. FINRA also recently requested comment on potential changes to a rule related to payments to market makers and the potential consequences with respect to any changes to such rule are unclear.
Finally, our common stock is traded on the NASDAQ Global Select Market and we are therefore also subject to its rules including corporate governance listing standards, as well as federal and state securities laws. In addition, the WisdomTree ETFs are listed on NYSE Arca, the NASDAQ Market and the BATS Exchange, and accordingly are subject to the listing requirements of those exchanges.
International Regulation
Our operations outside the U.S. are subject to the laws and regulations of various non-U.S. jurisdictions and non-U.S. regulatory agencies and bodies. As we have expanded our international presence, a number of our subsidiaries and international operations have become subject to regulatory systems, in various jurisdictions, comparable to those covering our operations in the U.S. Regulators in these non-U.S. jurisdictions may have broad authority with respect to the regulation of financial services including, among other things, the authority to grant or cancel required licenses or registrations.
European Regulation
We are subject to European regulation of our WisdomTree UCITS and Boost ETPs. If we complete the ETFS acquisition, we will also be subject to Jersey and European regulation of ETFS. The applicable regulations are described as follows:
WisdomTree UCITS ETFs
The investment management industry in Ireland is subject to both Irish domestic law and European Union law. The Central Bank of Ireland, or the Central Bank, is responsible for the authorization and supervision of collective investment schemes, or CIS, in Ireland. CIS’s are also commonly known as funds/schemes. There are two main categories of funds authorized by the Central Bank, Undertakings for Collective Investment in Transferable Securities (UCITS) and funds that are not UCITS known as alternative investment funds. ETFs form part of the Irish and European regulatory frameworks that govern UCITS, with ETFs having been the subject of specific consideration at the European level, which is then repeated and/or interpreted by the Central Bank in guidance notes issued by the Central Bank.
One of our subsidiaries, WisdomTree Management Limited, is an Ireland based management company providing investment and other management services to WTI and WisdomTree UCITS ETFs. The WisdomTree UCITS ETFs are issued by WTI. WTI, a non-consolidated third-party, is a public limited company organized in Ireland and is authorized as a UCITS by the Central Bank. All UCITS have their basis in EU legislation and once authorized in one European Economic Area, or EEA, Member State, may be marketed throughout the EU, without further authorization. This is described as an EU passport.
WTI is established and operated as a public limited company with segregated liability between its sub-funds. The sub-funds are segregated portfolios, each with their own investment objective and policies and assets. Each sub-fund has a separate authorization from the Central Bank, and each is authorized as an ETF. Each sub-fund tracks a different index. The index must comply with regulatory criteria that govern, among others, the eligibility and diversification of its constituents, and the availability of information
17
on the index such as the frequency of calculation of the index, the index’s transparency, its methodology and frequency of calculation. Each sub-fund is listed on the Irish Stock Exchange and has shares admitted to trading on the London Stock Exchange and, typically, on various European stock exchanges and, accordingly, is subject to the listing requirements of those exchanges.
WTI is primarily subject to the following legislation and regulatory requirements:
| • | European Communities (Undertakings for Collective Investment in Transferable Securities) Regulations 2011 (as amended) (“UCITS Regulations”). The UCITS Regulations, which transpose Council Directive 2009/65/EC, Commission Directive 2010/43/EC and Commission Directive 2010/44/EC into Irish law, are effective from July 1, 2011. UCITS established in Ireland are authorized under the UCITS Regulations. |
| • | Central Bank (Supervision and Enforcement) Act 2013 (Section 48(1)) (Undertakings for Collective Investment in Transferable Securities) Regulations 2015 (“Central Bank UCITS Regulations”) (as amended) (“Central Bank Acts”). The Central Bank UCITS Regulations were adopted in November 2015 and, together with the UCITS Regulations, any guidance notes produced by the Central Bank, and the Central Bank forms, form the basis for all the requirements that the Central Bank imposes on UCITS, UCITS management companies and depositaries of UCITS. |
| • | Central Bank Guidance Notes. The Central Bank has also produced guidance notes which provide direction on issues relating to the funds industry, certain of which set forth conditions not contained in the UCITS Regulations or the Central Bank Acts with which UCITS must conform. |
| • | The Companies Acts 2014 (“Companies Act”). WTI is incorporated as a public limited company under the Companies Act. Therefore, WTI is required to comply with various obligations under the Companies Act such as, but not limited to, convening general meetings and keeping proper books and records. The segregation of liability between sub-funds means there cannot be, as a matter of Irish law, cross-contamination of liability as between sub-funds so that the insolvency of one sub-fund affects another sub-fund. |
| • | Regulation (EU) No 648/2012 of the European Parliament and of the Council of 4 July 2012 on OTC derivatives, central counterparties and trade repositories, known as the European Market Infrastructure Regulation (“EMIR”). EMIR, which became effective on August 16, 2012, provides for certain over-the-counter, or OTC, derivative contracts to be submitted to central clearing and imposes, inter alia, margin posting and other risk mitigation techniques, reporting and record keeping requirements. WTI uses OTC derivatives instruments to hedge the currency risk of some of its sub-funds, which are subject to EMIR. WTI has adhered to the 2013 EMIR Portfolio Reconciliation, Dispute Resolution and Disclosure Protocol published by the International Swaps and Derivatives Association, Inc. The Central Bank has been designated as the competent authority for EMIR. |
| • | Regulation (EU) 2016/1011 of the European Parliament and of the Council of 8 June 2016 on indices used as benchmarks in financial instruments and financial contracts or to measure the performance of investment funds and amending Directives 2008/48/EC and 2014/17/EU and Regulation (EU) No 596/2014 (“BMR”). The BMR was published on June 30, 2016 and the majority of its provisions became effective on January 1, 2018. It is directly applicable law across the EU and applies to certain “administrators,” “contributors” and “users” of benchmarks with the aim of reducing the risk of benchmark manipulation and promoting confidence in their integrity and that of the financial markets which they support. Since WTI issues financial instruments that reference a benchmark, it will be required to comply with applicable obligations as set out under the BMR. In addition, non-EU administrators of benchmarks are required to satisfy a number of requirements to enable the benchmarks they provide to be used in the EU. To ensure investor protection, the BMR provides equivalence, recognition and endorsement conditions under which third country benchmarks may be used by supervised entities in the EU. Since we control the provision of benchmarks, we are required to comply with applicable obligations within the timeframes set out under the BMR. |
Boost ETPs
One of our subsidiaries, Boost Management Limited, is a Jersey based management company providing investment and other management services to Boost Issuer PLC, or BI, and the Boost ETPs. The Boost ETPs are issued by BI. BI, a non-consolidated third-party, is a public limited company incorporated in the laws of Ireland. It was established as a special purpose vehicle for the purposes of issuing collateralized exchange traded securities, or ETP Securities, under the Collateralized ETP Securities Programme described in its Base Prospectus. BI is a ‘qualifying company’ within the meaning of section 110 of the Taxes Consolidation Act 1997 (as amended), of Ireland. BI is not authorized or regulated by the Central Bank by virtue of issuing Boost ETPs.
The Central Bank, as competent authority under Directive 2003/71/EC (as amended by Directive 2010/73/EU), or the Prospectus Directive, has approved the Base Prospectus as meeting the requirements imposed under Irish and EU law pursuant to the Prospectus Directive. Such approval relates only to ETP Securities which are to be admitted to trading on a regulated market for the purpose of the Markets in Financial Instruments Directive (recast)—Directive 2014/65/EU of the European Parliament and of the Council (“MiFID II”) and/or which are to be offered to the public in any EEA Member State.
18
The Central Bank has, at the request of BI, notified the approval of the Base Prospectus in accordance with Article 18 of the Prospectus Directive to the U.K. Listing Authority, or UKLA (the United Kingdom financial supervisory authority), the Commissione Nazionale per la Societá e la Borsa (the Italian financial supervisory authority), the Bundesanstalt für Finanzdienstleistungsaufsicht (the German Federal financial supervisory authority) and the Financial Market Authority of Austria, by providing them, inter alia, with certificates of approval attesting that the Base Prospectus has been prepared in accordance with the Prospectus Directive. BI may request the Central Bank to provide competent authorities in other EEA Member States with such certificates whether for the purposes of making a public offer in such Member States or for admission to trading of all or any ETP Securities on a regulated market therein or both.
BI is primarily subject to the following legislation and regulatory requirements:
| • | The Companies Act. BI is incorporated as a public limited liability company under the Companies Act. Therefore, BI is required to comply with various obligations under the Companies Act such as, but not limited to, convening general meetings, keeping proper books and records and filing financial statements. |
| • | The Prospectus Directive. The Base Prospectus has been drafted, and any offer of ETP Securities in any EEA Member State that has implemented the Prospectus Directive is made in compliance with the Prospectus Directive and any relevant implementing measure in such Member States. |
| • | EMIR. BI hedges its payment obligations in respect of the ETP Securities by entering into swap transactions with swap providers, which are subject to EMIR. The Central Bank has been designated as the competent authority for EMIR and, to assess compliance with EMIR, requests that BI submits annually an EMIR Regulatory Return. |
| • | BMR. Since BI issues financial instruments that reference a benchmark, it also will be required to comply with applicable obligations under the BMR. |
| • | Regulation (EU) No 596/2014 of the European Parliament and of the Council on market abuse (the “Regulation”) and Directive 2014/57/EU of the European Parliament and of the Council on criminal sanctions for market abuse (the “Directive” and, together with the Regulation, “MAD”). MAD, which became effective on July 3, 2016 as a regulation under EU law, has a direct effect in Ireland and strengthens the legal framework underpinning the function of detecting, sanctioning and deterring market abuse. Broadly, MAD applies to any financial instrument admitted to, or for which a request for admission has been made to, trading on a regulated market in at least one member state of the EU or in an EEA Member State. Obligations imposed on BI under MAD include the requirement to publish inside information in a public and timely manner, to draw up and maintain a list of insiders and to refrain from market manipulation. |
ETFS
ETFS is comprised of Jersey-domiciled issuers of exchange-traded commodities, or ETC issuers, each of which were established as a special purpose vehicle to issue exchange traded securities. All ETCs other than those issued by Swiss Commodity Securities Limited (“SCSL”) are listed and marketed across the EU under the Prospectus Directive. The UKLA approves all ETC Base Prospectuses as meeting the requirements imposed under U.K. and EU law pursuant to the Prospectus Directive. Such approval relates only to those securities to be admitted to trading on a regulated market for the purpose of MiFID II and/or which are to be offered to the public in any EEA Member State. Each prospectus is prepared, and a copy of it is sent to the Jersey Financial Services Commission, in accordance with the Collective Investment Funds (Certified Funds – Prospectuses) (Jersey) Order 2010. Each ETC issuer has obtained a certificate under the Collective Investment Funds (Jersey) Law 1988, as amended, to enable it to undertake its functions in relation to the ETCs. The UKLA has, at the request of the relevant ETC issuer, notified the approval of the Base Prospectus in accordance with Article 18 of the Prospectus Directive to other EU listing authorities, including Austria, Belgium, Denmark, Finland, France, Germany, Ireland, Italy, the Netherlands, Norway, Spain, Sweden and the U.K., by providing them with certificates of approval attesting that the Base Prospectus has been prepared in accordance with the Prospectus Directive. Each issuer may request the UKLA to provide competent authorities in other EEA Member States with such certificates for the purposes of making a public offer in such Member States and/or for admission to trading of all or any securities on a regulated market.
The ETCs issued by SCSL are only offered and admitted to trading within Switzerland. A copy of the base prospectus of SCSL is delivered to the Registrar of Companies in Jersey in accordance with Article 5 of the Companies (General Provisions) (Jersey) Order 2002.
The ETC issuers are primarily subject to the following legislation and regulatory requirements:
| • | The Prospectus Directive. The Base Prospectus of each ETC issuer other than SCSL has been drafted, and any offer of ETCs in any EEA Member State that has implemented the Prospectus Directive is made in compliance with the Prospectus Directive and any relevant implementing measure in such Member States. |
| • | EMIR. EMIR provides for certain over-the-counter derivative contracts to be submitted to central clearing and imposes margin posting and other risk mitigation techniques, reporting and record keeping requirements. The clearing obligations under EMIR are still under discussion, and currently there are no mandatory clearing obligations in relation to equity, FX |
19
| or commodity derivatives. The clearing obligation only applies to EU-based financial counterparties (defined as those authorized under MiFID, CRR, AIFMD, UCITS or insurance regulations) or those non-financial entities that have a rolling three-month notional exposure above a certain amount (between €1 and €3 billion, depending on asset class), which means that the ETC issuers are not directly subject to these obligations, but could indirectly be subject to them by virtue of their interaction with EU-based financial counterparties. In terms of reporting obligations, being non-EU entities, the ETC issuers are only indirectly subject to such obligations when they interact with their EU-based financial counter-parties. Each ETC issuer has adhered to the 2013 EMIR Portfolio Reconciliation, Dispute Resolution and Disclosure Protocol published by the International Swaps and Derivatives Association, Inc. |
| • | MAD. Obligations imposed on the relevant ETC issuer and distributor under MAD include the requirement to publish inside information in a public and timely manner, to prepare and maintain a list of insiders and to refrain from market manipulation. |
| • | BMR. Supervised EU entities which issue financial instruments that reference a benchmark are required to comply with applicable obligations as set out under the BMR. The ETC issuers are non-EU entities and as a result, BMR application is very limited, although in some limited circumstances few residual obligations could be deemed to be applicable by virtue of the fact that the ETCs are marketed across Europe. |
| • | Regulation (EU) No 1286/2014 of the European Parliament and of the Council of 26 November 2014 on key information documents for packaged retail and insurance-based investment products (“PRIIPS”). PRIIPs became effective on January 1, 2018 and applies to investment product manufacturers and distributors. Under PRIIPs, manufacturers need to provide a key information document (KIDs) to investors. The intention of KIDs is to improve transparency for investors on the products and enhance investor protection. The product manufacturer is responsible for drafting the KID and for its content. All ETCs are currently subject to PRIIPs and KIDs have been produced since January 1, 2018. |
| • | MIFID II. MIFID II covers a wide range of areas that affect the relevant issuer and distributor, such as product governance, a new definition of complex products (which captures all physical and synthetic ETCs) and the production of a new document called an EMT to facilitate the dissemination of relevant information to the markets and distributors in relation to each financial product. |
| • | Regulation (EU) 2015/2365 of the European Parliament and of the Council of 25 November 2015 on transparency of securities financing transactions and of reuse and amending Regulation (EU) No 648/2012. (“SFTR”). Counterparties to securities financing transactions must report the transaction to trade repositories. The SFTR introduces a reporting requirement for transactions, and a disclosure requirement to investors with a requirement for prior consent. It also designates that financial instruments used for re-hypothecation are transferred to an account in the name of the other counterparty. Since the ETC issuers are based in non-EU jurisdictions, obligations are only indirectly applicable to them, but a certain level of interaction with EU counterparties is required to comply with some of these requirements. |
| • | The Foreign Account Tax Compliance Act (FATCA), which was passed as part of the Hiring Incentives to Restore Employment (HIRE) Act, generally requires that foreign financial institutions and certain other non-financial foreign entities report on the foreign assets held by their U.S. account holders or be subject to withholding on withholdable payments. The HIRE Act also contained legislation requiring U.S. persons to report, depending on the value, their foreign financial accounts and foreign assets. ETCs benefit from the so called “listing exemption” and Jersey local authorities have determined that for companies which can benefit from such exemption the filing of a nil report is optional. |
| • | The Common Reporting Standards, or CRS, were developed by the Organization for Economic Cooperation and Development, and is a global reporting standard for the automatic exchange of information. The ETC issuers will need to conduct FATCA style due diligence and annual local reporting in relation to financial accounts held directly and indirectly by residents of those jurisdictions with which the Foreign Financial Institutions (FFIs) jurisdiction of residence has signed an Intergovernmental Agreement (IGA) to implement the CRS. Unlike FATCA, there is no clear listing exemption available under the CRS so the ETC issuers are required to conduct full due diligence to identify such accounts and report on them on an annual basis to their local tax authorities, at least in respect of the certificated interests and primary market issuances. However, Jersey tax authorities have applied less onerous reporting obligations to interests such as ETCs that are regularly traded on an established securities market and are held through CREST, the U.K. based central securities depository. |
Japanese Regulation
In February 2016, our Tokyo, Japan-based subsidiary, WisdomTree Japan Inc., or WTJ, became registered as a Type 1 Financial Instruments Business with the Kanto Local Finance Bureau (a part of Japan’s Ministry of Finance under authority delegated by the Financial Services Agency of Japan, or FSA). WTJ also is a member of the Japan Securities Dealers Association and the Japan Investor Protection Fund, and is required to comply with the various rules and regulations of each, as applicable. Although WTJ does not currently sponsor any locally listed ETFs in the Japanese market, it assists in the marketing of our U.S. listed ETFs to investors in Japan and, as such, is subject to local regulation within the parameters of its Type 1 Financial Instruments Business registration.
20
WTJ is primarily subject to the following legislation and regulatory requirements:
| • | The Companies Act. WTJ is incorporated as a “Kabushiki Kaisha”, or KK, under the Companies Act of Japan. KKs are similar to U.S. C corporations. WTJ is required to comply with various obligations under the Companies Act such as, but not limited to, convening general meetings, appointing a statutory auditor and maintaining proper books and records. |
| • | The Financial Instruments and Exchange Law. WTJ is subject to the Financial Instruments and Exchange Law, or FIEL, which is administered and enforced by the FSA. The FSA establishes standards for compliance, including capital adequacy and financial soundness requirements, customer protection requirements and conduct of business rules. The FSA is empowered to conduct administrative proceedings that can result in censure, fines, the issuance of cease and desist orders or the suspension or revocation of registrations and licenses granted under the FIEL. |
Canadian Regulation
Our Toronto, Canada based subsidiary, WisdomTree Asset Management Canada, Inc., or WTAMC, is registered as an investment fund manager and exempt market dealer (a restricted broker/dealer license for the exempt market) in certain Canadian jurisdictions where such registration is required. WTAMC’s registration as an investment fund manager enables it to act as fund manager to investment funds, including our Canadian ETFs, in Canada. WTAMC is a corporation incorporated under the Business Corporations Act (Ontario) and must comply with various obligations under that Act including with respect to the appointment of directors and officers, the conduct of meetings of directors and shareholders and the maintaining of books and records. As a registered investment fund manager and exempt market dealer, WTAMC is subject to the requirements of applicable securities laws including National Instrument 31-103 – Registration Requirements, Exemptions and Ongoing Registrant Obligations of the Canadian Securities Administrators, which prescribes registration requirements including proficiency requirements for certain individuals required to be registered on behalf of the firm, firm capital and reporting requirements, firm insurance coverage requirements and the requirement to establish and maintain policies and procedures to ensure compliance by the firm and individuals acting on its behalf with applicable securities legislation.
Our Canadian ETFs are public investment funds whose units are listed on the Toronto Stock Exchange. Our Canadian ETFs are in continuous distribution of their units and have filed prospectuses with the Canadian Securities Administrators in order to offer their units, which are required to be renewed annually. Our Canadian ETFs are subject to National Instrument 81-102 – Investment Funds of the Canadian Securities Administrators, which sets out requirements relating to the investments and limitations on certain investment strategies that may be undertaken by public investment funds as well as requiring fund portfolio assets to be held by independent qualified financial institutions and prescribing that certain fundamental fund changes necessitate obtaining approval of unitholders. Our Canadian ETFs are also subject to National Instrument 81-106 – Investment Fund Continuous Disclosure, which mandates the preparation and filing of annual audited and semi-annual unaudited financial statements for each fund as well as management reports of fund performance for the same periods which are required to be sent to unitholders of the fund. In addition, each of our Canadian ETFs also must prepare quarterly portfolio disclosure and annually prepare and make available its proxy voting disclosure, which is a record of how the fund voted the various portfolio securities held by it. Finally, National Instrument 81-107 – Independent Review Committee for Investment Funds, requires public investment funds to have an independent review committee, or IRC, consisting of at least three members, each of whom must be independent of the fund manager, to review and approve or make a recommendation relating to conflict of interest matters referred to the IRC by the fund manager for consideration that may arise in the course of managing the operations of a fund.
Intellectual Property
We regard our name, WisdomTree, as material to our business and have registered WisdomTree® as a service mark with the U.S. Patent and Trademark Office and in various foreign jurisdictions.
Our index-based equity ETFs are based on our own indexes and we do not license them from, nor do we pay licensing fees to, third parties for these indexes. We do, however, license third-party indexes for certain of our fixed income, currency and alternative ETFs.
On March 6, 2012, the U.S. Patent and Trademark Office issued to us our patent on Financial Instrument Selection and Weighting System and Method, which is embodied in our dividend weighted equity indexes. We also have two patent applications pending with the U.S. Patent and Trademark office that relate to the operation of our ETFs and our index methodology. There is no assurance that patents will be issued from these applications and we currently do not rely upon our recently issued or future patents for a competitive advantage.
21
Employees
As of December 31, 2017, we had 204 full-time employees, of which 162 were in our U.S. Business segment and 42 were in our International Business segment. None of our employees are covered by a collective bargaining agreement and we consider our relations with employees to be good.
Assuming that the acquisition of ETFS was completed as of December 31, 2017 and that we were able to realize certain synergies which may ultimately not be achievable, we would have approximately 241 full-time employees of which 162 would be in our U.S. Business segment and 79 would be in our International Business segment.
Available Information
Company Website and Public Filings
Our website is located at www.wisdomtree.com, and our investor relations website is located at http://ir.wisdomtree.com. We make available, free of charge through our investor relations website, our Annual Reports on Form 10-K, Quarterly Reports on Form 10-Q and Current Reports on Form 8-K, and amendments to those reports, filed or furnished pursuant to Sections 13(a) or Section 15(d) of the Exchange Act as soon as reasonably practicable after they have been electronically filed with, or furnished to, the SEC. The public may read and copy any materials filed by us with the SEC at the SEC’s Public Reference Room at 100 F Street, NE, Washington, D.C. 20549. The public may obtain information on the operation of the Public Reference Room by calling the SEC at 1-800-SEC-0330. The SEC maintains a website that contains reports, proxy and information statements, and other information regarding the Company at www.sec.gov.
We webcast our earnings calls and certain events we participate in or host with members of the investment community on our investor relations website. Additionally, we provide notifications of news or announcements regarding our financial performance, including SEC filings, investor events, press and earnings releases as part of our investor relations website. Further corporate governance information, including board committee charters and code of conduct, is also available on our investor relations website under the heading “Corporate Governance.” The contents of our websites are not incorporated by reference into this Annual Report on Form 10-K or in any other report or document we file with the SEC, and any references to our websites are intended to be inactive textual references only.
22
| ITEM 1A. | RISK FACTORS |
Any investment in our common stock involves a high degree of risk. You should consider carefully the specific risk factors described below in addition to the other information contained in this Report before making a decision to invest in our common stock. If any of these risks actually occur, our business, operating results, financial condition and prospects could be harmed. This could cause the trading price of our common stock to decline and a loss of all or part of your investment. Certain statements below are forward-looking statements. See the section entitled “Cautionary Note Regarding Forward-Looking Statements.”
Risks Related to the Acquisition of ETFS
Failure to complete the acquisition of ETFS could negatively impact us.
In November 2017, we agreed to acquire ETFS. Completion of the acquisition is subject to the satisfaction or waiver of a number of conditions. These conditions include, among others, (i) the receipt of required regulatory approvals, (ii) approval of the listing on Nasdaq of the shares to be issued to ETFS, (iii) we and ETF Securities entering into an Investor Rights Agreement, pursuant to which, among other things, ETFS will be subject to lock-up, standstill and voting restrictions, and will receive certain registration rights with respect to the common stock, including the common stock issuable upon conversion of the Series A Non-Voting Convertible Preferred Stock, it will receive in the transaction and (iv) obtaining various additional third party consents. These conditions to completion may not be fulfilled and, accordingly, the acquisition may not be completed. If the acquisition is not completed by May 13, 2018, either we or ETFS may choose not to proceed with the acquisition. The parties also can mutually decide to terminate the Share Sale Agreement at any time prior to completion. In addition, either we or ETFS may elect to terminate the Share Sale Agreement in certain other circumstances.
If the Share Sale Agreement is terminated and the acquisition is not completed, we may be adversely affected by, among other things, the failure to pursue other beneficial opportunities during the pendency of the acquisition, the failure to obtain the anticipated benefits of completing the acquisition, and the focus of our management on the acquisition rather than on normal business operations or opportunities. The market price of our common stock might decline as a result of any such failures to the extent that the current market price reflects a market assumption that the acquisition will be completed. Additionally, even if the acquisition is not completed, we will be responsible for certain transaction costs associated with the acquisition including financial advisory, legal, accounting, consulting and other advisory fees and expenses, which may be significant. Any of these factors, among others, could have a material impact on our business, prospects, financial condition and results of operations.
Over the last few years, we have expanded our business into Europe, Japan and Canada, and recently agreed to further expand our European operations through the acquisition of ETFS. This expansion subjects us to increased operational, regulatory, financial and other risks.
Assuming we complete the acquisition of ETFS, we will face increased operational, regulatory, financial, compliance, reputational and foreign exchange rate risks. The failure of our compliance and internal control systems to properly mitigate such additional risks, or of our operating infrastructure to support such expansion, could result in operational failures and regulatory fines or sanctions. If our international products and operations experience any negative consequences or are perceived negatively in non-U.S. markets, it may also harm our reputation in other markets, including the U.S. market.
The expansion of our European business through the acquisition of ETFS will require us to incur up-front expenses associated with completing the acquisition, as well as additional ongoing expenses, including those associated with leases, the employment of additional support staff and regulatory compliance, which may be higher than expected. To the extent that our revenues do not increase to the same degree our expenses increase, our profitability could be adversely affected. The expansion of our European business also may place significant demands on our existing infrastructure and employees.
The proposed acquisition of ETFS is significant in size relative to our assets and operations and may result in significant changes in our business. Our failure to integrate and manage ETFS successfully could materially and adversely affect our business, results of operations and financial condition.
The acquisition of ETFS will be significant for us. If the acquisition is completed, we will face numerous risks, including, among others:
| • | failure to achieve financial, operating or business objectives and synergies; |
| • | failure to integrate successfully and in a timely manner any operations, products, services or technology; |
| • | diversion of the attention of management and other personnel; |
| • | failure to obtain regulatory or other approvals; |
23
| • | failure to retain personnel; |
| • | unforeseen liabilities or expenses; |
| • | failure of counterparties to indemnify us against liabilities arising from the transaction; |
| • | potential loss of, or harm to, our relationship with our and the counterparties’ employees, customers and suppliers due to integration of a new business; |
| • | accounting charges; |
| • | unfavorable market conditions and foreign exchange risks that could negatively impact the acquired or combined businesses; and |
| • | legal proceedings which may result in expenses and/or have a material adverse effect on our business. |
We could be prevented from, or significantly delayed in, achieving our strategic goals if we are unable to successfully integrate ETFS. Our International Business segment had pre-tax losses of $9.1 million, $19.2 million and $12.3 million for the years ended December 31, 2015, 2016 and 2017, respectively. While we expect the acquisition of ETFS to immediately add scale to our International Business segment, we cannot provide any assurance that this will occur. Our failure to integrate and manage ETFS successfully could materially and adversely affect our business, results of operations and financial condition.
Risks Related to Our Business and Our Industry
Net outflows in our two largest ETFs have had, and in the future could continue to have, a negative impact on our revenues.
At December 31, 2017, approximately 36% of our U.S. listed ETF AUM was concentrated in two of our WisdomTree ETFs, with 16% in WisdomTree Europe Hedged Equity Fund (HEDJ) and 20% in WisdomTree Japan Hedged Equity Fund (DXJ). These two ETFs also accounted for approximately 40% of our revenues in 2017. As a result, our operating results are particularly exposed to the performance of these ETFs and our ability to maintain the AUM of these ETFs, as well as investor sentiment toward investing in the ETFs’ strategies. We are also subject to political, economic and market risks in either of these markets and to a weakening of the U.S. dollar relative to the Euro or Yen. During 2017, DXJ flows were essentially flat while HEDJ experienced net outflows $2.6 billion. In 2016, HEDJ and DXJ experienced net outflows of $7.8 billion and $5.7 billion, respectively, and through February 16, 2018, these same funds have experienced outflows of $0.7 billion and $1.3 billion, respectively. If HEDJ and DXJ were to continue to experience net outflows, our revenues would be adversely affected.
Declining prices of securities can adversely affect our business by reducing the market value of the assets we manage or causing WisdomTree ETF shareholders to sell their fund shares and trigger redemptions.
We are subject to risks arising from declining prices of securities, which may result in a decrease in demand for investment products, a higher redemption rate and/or a decline in AUM. The securities markets are highly volatile and securities prices may increase or decrease for many reasons, including general economic conditions, the strengthening or weakening of the U.S. dollar, political events, acts of terrorism and other matters beyond our control. Substantially all our revenues are determined by AUM in equity securities, in both the international and U.S. markets. As a result, our business can be expected to generate lower revenues in declining equity market environments or general economic downturns. A decline in the prices of securities held by the WisdomTree ETFs may cause our revenues to decline by either causing the value of our AUM to decrease, which would result in lower advisory fees, or causing investors in the WisdomTree ETFs to sell their shares in favor of investments they perceive to offer greater opportunity or lower risk, thus triggering redemptions that would also result in decreased AUM and lower fees.
In addition, a substantial portion of AUM of ETFS are in products backed by gold. These products historically have been negatively correlated with our two largest ETFs, HEDJ and DXJ, and therefore we may experience improved stability of AUM and lower overall AUM volatility if the acquisition of ETFS is completed. However, we can provide no assurance that the negative historical correlation between the AUM of ETFS and the AUM of our two largest ETFs will continue in the future.
Fluctuations in the amount and mix of our AUM may negatively impact revenues and operating margins.
The level of our revenues depends on the amount and mix of our AUM. Our revenues are derived primarily from advisory fees based on a percentage of the value of our AUM and vary with the nature of the ETFs, which have different fee levels. Fluctuations in the amount and mix of our AUM may be attributable in part to market conditions outside of our control that have had, and in the future could have, a negative impact on our revenues and operating margins.
24
Withdrawals or broad changes in investments in our ETFs by investors with significant positions may negatively impact revenues and operating margins.
We have had in the past, and may have in the future, investors who maintain significant positions in one or more of our ETFs. If such an investor were to broadly change or withdraw its investments in our ETFs because of a change to its investment strategy, market conditions or any other reason, it may significantly change the amount and mix of our AUM, which may negatively affect our revenues and operating margins.
We derive a substantial portion of our revenues from a limited number of products and, as a result, our operating results are particularly exposed to the performance of these funds and our ability to maintain the AUM of these funds, as well as investor sentiment toward investing in the funds’ strategies.
At December 31, 2017, approximately 72% of our U.S. listed ETF AUM was concentrated in ten of our WisdomTree ETFs (with approximately 16% in HEDJ and 20% in DXJ). As a result, our operating results are particularly exposed to the performance of these funds and our ability to maintain the AUM of these funds, as well as investor sentiment toward investing in the funds’ strategies. If the AUM in these funds were to decline, either because of declining market values or net outflows from these funds, our revenues would be adversely affected.
Much of our AUM is held in ETFs that invest in foreign securities and we therefore have substantial exposure to foreign market conditions and are subject to currency exchange rate risks.
Many of our ETFs invest in securities of companies, governments and other organizations located outside the U.S. and at December 31, 2017, approximately 67% of our AUM was comprised of such investments. Therefore, the success of our business is closely tied to market conditions in foreign markets. Investments in non-U.S. issuers are affected by political, social and economic uncertainty affecting a country or region in which we are invested. In addition, fluctuations in foreign currency exchange rates could reduce the revenues we earn from certain foreign invested ETFs. This occurs because an increase in the value of the U.S. dollar relative to non-U.S. currencies may result in a decrease in the dollar value of the AUM in these ETFs, which, in turn, would result in lower revenues. Furthermore, investors are likely to believe certain foreign invested ETFs, as well as certain of our currency and fixed income ETFs, are a less attractive investment opportunity when the value of the U.S. dollar rises relative to non-U.S. currencies, which could have the effect of reducing investments in these ETFs, thus reducing revenues. Conversely, a weakening U.S. dollar may make less attractive our international hedged equity ETFs, as unhedged alternatives would benefit from the appreciation of the foreign currency or currencies while our hedged ETFs would not, which could result in redemptions in our funds. Since a substantial portion of our AUM at December 31, 2017 was held in our international hedged equity ETFs, a weakening of the U.S. dollar relative to the Euro or Yen may adversely affect our AUM and revenues.
Many of our WisdomTree ETFs have a limited track record and poor investment performance could cause our revenues to decline.
Many of our ETFs have a limited track record upon which an evaluation of their investment performance can be made. At December 31, 2017, of our total 89 U.S. listed ETFs, 59 had at least a three-year track record, 39 had at least a five-year track record and 27 had at least a ten-year track record. Certain investors limit their investments to ETFs with track records of ten years or more. Furthermore, as part of our strategy, we continuously evaluate our product offerings to ensure that all our funds are useful, compelling and differentiated investment offerings, to more competitively align our overall product line in the current ETF landscape and to reallocate our attention and resources to areas of greater client interest. As a result, we may further adjust our product offerings, which may result in the closing of some of our ETFs, changing their investment objective or offering of new funds. The investment performance of our funds is important to our success. While strong investment performance could stimulate sales of our ETFs, poor investment performance, on an absolute basis or as compared to third-party benchmarks or competitive products, could lead to a decrease in sales or stimulate redemptions, thereby lowering the AUM and reducing our revenues. Our fundamentally-weighted equity ETFs are designed to provide the potential for better risk-adjusted investment returns over full market cycles and are best suited for investors with a longer-term investment horizon. However, the investment approach of our equity ETFs may not perform well during certain shorter periods of time during different points in the economic cycle.
We could lose our entire investment in AdvisorEngine if it is unable to execute its business plan and successfully grow its business, which would have a material impact on our financial condition and results of operations.
We currently have various financial interests in AdvisorEngine valued at $47.0 million, including an aggregate of $25.0 million invested in AdvisorEngine for equity ownership of approximately 47% (or 41% on a fully-diluted basis), $22.0 million advanced in the form of an unsecured note receivable and an option to purchase the remaining equity interests in AdvisorEngine. We also have a commitment to provide an additional $8.0 million of working capital in 2018. As described in Notes 6 and 7 of our Consolidated Financial Statements, our financial interests in AdvisorEngine have been valued and are assessed for impairment quarterly. If AdvisorEngine is unable to execute its business plan and successfully grow its business, we may be required to reduce the value of our financial interests in AdvisorEngine on our financial statements, which would adversely impact our financial results. Furthermore, we could lose our entire financial interest in AdvisorEngine if it is unable to satisfy its obligations as they become due and ceases its operations, which would have a material impact on our financial condition and results of operations and may cause a decline in the price of our common stock.
25
We currently depend on State Street Bank and Trust Company to provide us with critical administrative services to operate our business and the WisdomTree ETFs. The failure of State Street to adequately provide such services could materially affect our operating business and harm WisdomTree ETF shareholders.
We currently depend upon State Street Bank and Trust Company, or State Street, to provide the WisdomTree Trust with custody services, fund accounting, administration, transfer agency and securities lending services. The failure of State Street to successfully provide us and the WisdomTree ETFs with these services could result in financial loss to us and WisdomTree ETF shareholders. In addition, because State Street provides a multitude of important services to us, changing this vendor relationship would be challenging. It might require us to devote a significant portion of management’s time to negotiate a similar relationship with another vendor or have these services provided by multiple vendors, which would require us to coordinate the transfer of these functions to another vendor or vendors.
We primarily depend on BNY Mellon and Voya Investment Management to provide portfolio management services and other third parties to provide many critical services to operate our business and the WisdomTree ETFs. The failure of key vendors to adequately provide such services could materially affect our operating business and harm WisdomTree ETF shareholders.
We depend on third-party vendors to provide us with many services that are critical to operating our business, including BNY Mellon and Voya Investment Management as sub-advisers that provide us with portfolio management services, third-party providers of index calculation services for our indexes, a distributor of the WisdomTree ETFs and a third-party provider of indicative values of the portfolios of the WisdomTree ETFs. The failure of any of these key vendors to provide us and the WisdomTree ETFs with these services could lead to operational issues and result in financial loss to us and WisdomTree ETF shareholders.
The asset management business is intensely competitive. Many of our competitors have greater market share, offer a broader range of products, charge lower fees and have greater financial resources than we do. As a result, we may experience pressures on our pricing and market share.
Our business operates in intensely competitive industry segments. We compete directly with other ETF sponsors and mutual fund companies and indirectly against other investment management firms, insurance companies, banks, brokerage firms and other financial institutions that offer products that have similar features and investment objectives to those offered by us. We compete based on a number of factors, including name recognition, service, investment performance, product features, breadth of product choices and fees. Several ETF sponsors with whom we directly compete are seeking to obtain market share based on low fees. Many of our competitors have greater market share, offer a broader range of products and have greater financial resources than we do. Some financial institutions operate in a more favorable regulatory environment and/or have proprietary products and distribution channels, which may provide certain competitive advantages to them and their investment products. Our competitors may also adopt products, services or strategies similar to ours, including the use of fundamentally-weighted indexes. In addition, over time certain sectors of the financial services industry have become considerably more concentrated, as financial institutions involved in a broad range of financial services have been acquired by or merged into other firms. This convergence could result in our competitors gaining greater resources and we may experience pressures on our pricing and market share as a result of these factors and as some of our competitors seek to increase market share by reducing prices. We believe that competition within the ETF industry will continue to increase as more traditional asset management companies become ETF sponsors.
Competitive pressures could reduce revenues and profit margins.
The ETF industry is becoming significantly more competitive as existing players broaden their suite of products to offer different strategies that are, in some cases, similar to ours. Although the ETF industry currently has a higher barrier to entry as a result of the need for ETF sponsors to obtain exemptive relief from the SEC in order to operate ETFs, traditional asset managers, many of whom are much larger than us, have either already entered or started to enter the ETF space, and some competitors have launched ETFs using either third-party or proprietary fundamentally weighted or factor-based indexes or currency hedged ETFs with fees that are generally equivalent to, and in some instances lower than, our ETFs. We expect that additional companies, both new and traditional asset managers, will continue to enter the ETF space.
There also has been increased price competition in not only commoditized product categories such as traditional, market capitalization weighted index exposures, but also in fundamental or other non-market cap weighted or factor-based exposures. Certain ETF sponsors have been reducing fees, which has been a trend over the last few years that accelerated meaningfully in 2017. Funds are being offered with fees of 20 bps or less, which attracted approximately 70% of the net flows into U.S. listed ETFs during the year ended December 31, 2017. In addition, existing players have broadened their suite of products offering strategies that are, in some cases, similar to ours. Large traditional asset managers are also launching ETFs, some with similar strategies as well.
26
In addition, in 2008, the SEC proposed a rule that, if adopted, would eliminate the need to obtain exemptive relief, thereby lowering the barrier to entry. This proposed rule was never adopted, but the SEC staff has recently indicated that the SEC may propose one or more rules in 2018 to streamline and harmonize certain aspects of the exemptive relief process and the SEC is otherwise reviewing the ETF ecosystem of rules, including those related to listing. Any new rules, changes to rules or changes to the current exemptive relief and/or listing processes could create fewer barriers to entry for competitors and/or could impose additional burdens or less flexibility for the WisdomTree ETFs. ETFs that do not meet generic exchange listing standards, which historically included actively managed ETFs, have had to undergo a lengthy exchange listing process, which sometimes takes in excess of a year. However, in 2016, generic listing standards for active ETFs were approved, thereby reducing a barrier to entry for active ETFs that meet the new generic listing standards.
In addition, in December 2014, the SEC granted Eaton Vance and related parties an exemption from certain provisions of the Investment Company Act to permit the offering of a form of non-transparent exchange traded managed funds, and other unaffiliated fund complexes have signed up to launch such funds, with the first funds launching in 2016. In addition, the SEC rejected proposals from Precidian, BlackRock and other large investment management firms to also offer a form of non-transparent exchange traded product. Subsequently, many of these firms have refiled their applications with changes intended to address the SEC’s concerns and other fund managers also have filed with the SEC for approval of other types of non-transparent exchange traded products, which could obtain approval in 2018. The launch of non-transparent exchange traded products may allow traditional actively managed mutual fund sponsors to compete more effectively against ETFs, which could reduce our revenues and profit margins.
Our revenues could be adversely affected if the WisdomTree Trust determines that the advisory fees we receive from the WisdomTree ETFs should be reduced.
Our advisory agreements with the WisdomTree Trust and the fees we collect from the WisdomTree ETFs are subject to review and approval by the Independent Trustees of the WisdomTree Trust. The advisory agreements are subject to initial review and approval. After the initial two-year term of the agreement for each ETF, the continuation of such agreement must be reviewed and approved at least annually by a majority of the Independent Trustees. In determining whether to approve the agreements, the Independent Trustees consider factors such as the nature and quality of the services provided by us, the fees charged by us and the costs and profits realized by us in connection with such services, as well as any ancillary or “fall-out” benefits from such services, the extent to which economies of scale are shared with the WisdomTree ETFs, and the level of fees paid by other similar funds. If the Independent Trustees determine that the advisory fees we charge to any particular fund are too high, we will need to reduce our fees, which could adversely affect our revenues.
Our risk management policies and procedures, and those of our third-party vendors upon which we rely, may not be fully effective in identifying or mitigating risk exposure, including employee misconduct. If our policies and procedures do not adequately protect us from exposure to these risks, we may incur losses that would adversely affect our financial condition, reputation and market share.
We have developed risk management policies and procedures and we continue to refine them as we conduct our business. Many of our procedures involve oversight of third-party vendors that provide us with critical services such as portfolio management, custody and fund accounting and administration, and index calculation services. Our policies and procedures to identify, monitor and manage risks may not be fully effective in mitigating our risk exposure. Moreover, we are subject to the risks of errors and misconduct by our employees, including fraud and non-compliance with policies. These risks are difficult to detect in advance and deter, and could harm our business, results of operations or financial condition. Although we maintain insurance and use other traditional risk-shifting tools, such as third-party indemnification, to manage certain exposures, they are subject to terms such as deductibles, coinsurance, limits and policy exclusions, as well as risk of counterparty denial of coverage, default or insolvency. If our policies and procedures do not adequately protect us from exposure and our exposure is not adequately covered by insurance or other risk-shifting tools, we may incur losses that would adversely affect our financial condition and could cause a reduction in our revenues as WisdomTree ETF shareholders shift their investments to the products of our competitors.
Compliance with extensive, complex and changing regulation imposes significant financial and strategic costs on our business, and non-compliance could result in fines and penalties.
Our business is subject to extensive regulation of our business and operations. Our U.S. subsidiary, WTAM, is a registered investment adviser and is subject to oversight by the SEC pursuant to its regulatory authority under the Investment Advisers Act. We also must comply with certain requirements under the Investment Company Act, with respect to the WisdomTree ETFs for which WTAM acts as investment adviser. WTAM is also a member of the NFA and registered as a commodity pool operator for certain of our ETFs. In addition, one of our other subsidiaries, WisdomTree Commodity Services, LLC, is also a member of the NFA and registered as a commodity pool operator for a commodity ETF that is not registered under the Investment Company Act. As a commodity pool operator, we are subject to oversight by the NFA and the CFTC pursuant to regulatory authority under the Commodity Exchange Act. In addition, the content and use of our marketing and sales materials and of our sales force in the U.S. regarding our U.S. listed ETFs is subject to the regulatory authority of FINRA. We are also subject to foreign laws and regulatory
27
authorities with respect to operational aspects of our ETFs that invest in securities of issuers in foreign countries, in the marketing, offer and/or sales of our ETFs in foreign jurisdictions and in our offering of investment products domiciled outside of the U.S., such as our UCITS ETFs, Boost ETPs and Canadian ETFs. Each of the regulatory bodies with jurisdiction over us has regulatory powers dealing with many aspects of our business, including the authority to grant, and, in specific circumstances to cancel, permissions to carry on particular businesses. Our failure to comply with applicable laws or regulations could result in fines, censure, suspensions of personnel or other sanctions, including revocation of our registration as an investment adviser. Even if a sanction imposed against us or our personnel is small in monetary amount, the adverse publicity arising from the imposition of sanctions against us by regulators could harm our reputation and thus result in redemptions from our ETFs and impede our ability to retain WisdomTree ETF shareholders and develop new WisdomTree ETF shareholders, all of which may reduce our revenues.
We face the risk of significant intervention by regulatory authorities, including extended investigation activity, adoption of costly or restrictive new regulations and judicial or administrative proceedings that may result in substantial penalties. Among other things, we could be fined or be prohibited from engaging in some of our business activities. The requirements imposed by our regulators are designed to ensure the integrity of the financial markets and to protect WisdomTree ETF shareholders and our advisory clients, and are not designed to protect our stockholders. Consequently, these regulations often serve to limit our activities, including through WisdomTree ETF shareholder protection and market conduct requirements.
The regulatory environment in which we operate also is subject to modifications and further regulation. Recently, concerns have been raised about ETFs’ possible contribution to market volatility as well as the disclosure requirements applicable to certain types of more complex ETFs. In addition, the SEC recently approved a broad set of reforms regarding data reporting and fund liquidity, which will impose additional expense and require additional administrative services and requirements, among other matters, in seeking to comply with the new rules. In addition, the SEC proposed a broad set of reforms regarding derivatives usage and business continuity that would apply to all registered funds, including ETFs, which may have a negative impact on our existing ETFs (including their operations and/or their performance) and our ability to launch new and innovative ETFs. New laws or regulations, or changes in the enforcement of existing laws or regulations, applicable to us or investors in the ETFs also may adversely affect our business, and our ability to function in this environment will depend on our ability to constantly monitor and react to these changes. Regulatory uncertainty continues to surround the Dodd-Frank Wall Street Reform and Consumer Protection Act of 2010, which represented a comprehensive overhaul of the financial services regulatory environment and requires federal agencies to implement numerous new rules, which, if adopted, may impose additional regulatory burdens and expenses on our business. Compliance with new laws and regulations may result in increased compliance costs and expenses.
Specific regulatory changes also may have a direct impact on our revenues. In addition to regulatory scrutiny and potential fines and sanctions, regulators continue to examine different aspects of the asset management industry. New regulation, revised regulatory or judicial interpretations, revised viewpoints, outcomes of lawsuits against other fund complexes or growth in our ETF assets and/or profitability related to the annual approval process for investment advisory agreements may result in the reduction of fees under these agreements, which would mean a reduction in our revenues.
Our operations outside the U.S. are subject to the laws and regulations of various non-U.S. jurisdictions and non-U.S. regulatory agencies and bodies. As we have expanded our international presence, a number of our subsidiaries and international operations have become subject to regulatory systems, in various jurisdictions, comparable to those covering our operations in the U.S. Regulators in these non-U.S. jurisdictions may have broad authority with respect to the regulation of financial services including, among other things, the authority to grant or cancel required licenses or registrations.
Damage to our reputation could adversely affect our business.
We believe we have developed a strong brand and a reputation for innovative, thoughtful products, favorable long-term investment performance and excellent client services. The WisdomTree name and brand is a valuable asset and any damage to it could hamper our ability to maintain and grow our AUM and attract and retain employees, thereby having a material adverse effect on our revenues. Risks to our reputation may range from regulatory issues to unsubstantiated accusations. Managing such matters may be expensive, time-consuming and difficult.
Abnormally wide bid/ask spreads and market disruptions that halt or disrupt trading or create extreme volatility could undermine investor confidence in the ETF investment structure and limit investor acceptance of ETFs.
The shares of the WisdomTree ETFs, like the shares of all ETFs, trade on exchanges in market transactions that generally approximate the value of the underlying portfolio of securities held by the particular ETF. Trading involves risks including the potential lack of an active market for fund shares, abnormally wide bid/ask spreads (the difference between the prices at which shares of an ETF can be bought and sold) that can exist for a variety of reasons and losses from trading. These risks can be exacerbated during periods when there is low demand for an ETF, when the markets in the underlying investments are closed, when markets conditions are extremely volatile or when trading is disrupted. This could result in limited growth or a reduction in the overall ETF market and result in our revenues not growing as rapidly as it has in the recent past or even in a reduction of revenues.
28
We have agreed to acquire ETFS and expect to continue to consider strategic transactions in the future. Any strategic transactions that we are a party to will result in increased demands on our management and other resources, may be significant in size relative to our assets and operations, result in significant changes in our business and materially and adversely affect our stock price. If we were unable to manage our strategic growth initiatives it could have a material adverse effect on our business.
We recently agreed to acquire ETFS and expect to continue to consider strategic transactions that we believe may enable us to strengthen our business, expand and diversify our product offering, increase our AUM or enter into new markets. These developments have placed increased demands on our management and other resources and will continue to do so in the future. We may not be able to manage our operations effectively or achieve planned growth on a timely or profitable basis. To do so will require, among other things:
| • | continuing to retain, motivate and manage our existing employees and attract and integrate new employees; |
| • | developing, implementing and improving our operational, financial, accounting, reporting and other internal systems and controls on a timely basis; and |
| • | maintaining and developing our various support functions including human resources, information technology, legal and corporate communications. |
If we are unable to manage these developments effectively, there could be a material adverse effect on our ability to maintain or increase revenues and profitability.
Managing strategic growth initiatives will require continued investment in personnel, information technology infrastructure and marketing activities, as well as further development and implementation of financial, operational and compliance systems and controls. We may not be successful in implementing all of the processes that are necessary. Unless such initiatives result in an increase in our revenues that is at least proportionate to the increase in the costs associated with implementing them, our future profitability will be adversely affected.
In addition, any future strategic transactions may result in the issuance of a significant amount of our common stock or other security that could be dilutive to our stockholders, make substantial borrowings and/or changes in our board composition and/or management team, that constitute a change of control of our Company, lead to significant changes in our product offering, business operations and earning and risk profiles, and/or result in a decline in the price of our common stock.
Our ability to complete future strategic transactions depends upon a number of factors that are not entirely within our control, including our ability to identify suitable merger or acquisition candidates, negotiate acceptable terms, conclude satisfactory agreements and secure financing. Our failure to complete strategic transactions or to integrate and manage acquired or combined businesses successfully could materially and adversely affect our business, results of operations and financial conditions.
The uncertainty regarding the potential U.K. exit from the European Union could adversely affect our business.
The referendum held in the U.K. on June 23, 2016 resulted in a determination that the U.K. should exit the European Union, referred to as the “Brexit.” Such an exit from the European Union would be unprecedented and it is unclear how the U.K.’s access to the EU Single Market (and vice versa), and the wider trading, legal and regulatory environment in which we operate, would be impacted and how this would affect our business and the global macroeconomic environment. The uncertainty surrounding the terms of the Brexit and its consequences could adversely impact the manner in which we conduct our operations in Europe, investor confidence and result in additional market volatility. It also could adversely affect our business, including our revenues, from either a decrease in the value of our AUM, which would result in lower advisory fees, or from investors in the WisdomTree ETFs selling their shares in favor of investments they perceive as less exposed to the Brexit risks, thus triggering redemptions that would also result in decreased AUM and lower fees.
Our ability to operate effectively could be impaired if we fail to retain or recruit key personnel.
The success of our business, the implementation of our growth strategy and the integration of ETFS if the acquisition is completed, are highly dependent on our ability to attract, retain and motivate highly skilled, and sometimes highly specialized, employees, including in particular, operations, product development, research and sales personnel. Our U.S. employees generally may voluntarily terminate their employment at any time. The market for these individuals is extremely competitive and is likely to become more so as additional investment management firms enter the ETF industry. Our compensation methods may not enable us to recruit and retain required personnel. For example, price volatility in our common stock may impact our ability to effectively use equity grants as an employee compensation incentive. Also, we may need to increase compensation levels, which would decrease our net income or increase our losses. If we are unable to retain and attract key personnel, it could have an adverse effect on our business, our ability to effectively integrate ETFS, if the acquisition is completed, and our results of operations and financial condition.
29
Changes in U.S. federal income tax law could make some of our products less attractive to investors.
Many of the WisdomTree ETFs seek to obtain the investment return achieved by our proprietary indexes that weigh index components based upon dividends. Even with the increase a few years ago in income tax rates applicable to dividends, corporate dividends continue to enjoy favorable tax treatment under current U.S. federal income tax law. If the income tax rates imposed on dividends were increased further, it may make these WisdomTree ETFs less attractive to investors.
Our expenses are subject to fluctuations that could materially affect our operating results.
Our results of operations are dependent in part on the level of our expenses, which can vary from quarter to quarter. Our expenses may fluctuate primarily as a result of discretionary spending, including additional headcount, accruals for incentive compensation, marketing, advertising and sales expenses we incur to support our growth initiatives. Accordingly, our results of operations may vary from quarter to quarter.
Any significant limitation or failure of our technology systems, or of our third-party vendors’ technology systems, or any security breach of our information and cyber security infrastructure, software applications, technology or other systems that are critical to our operations could interrupt or damage our operations and result in material financial loss, regulatory violations, reputational harm or legal liability.
We are dependent upon the effectiveness of our own, and our vendors’, information security policies, procedures and capabilities to protect the technology systems used to operate our business and to protect the data that reside on or are transmitted through them. Although we and our third-party vendors take protective measures to secure information, our and our vendors’ technology systems may still be vulnerable to unauthorized access, computer viruses or other events that could result in inaccuracies in our information or system disruptions or failures, which could materially interrupt or damage our operations. In addition, technology is subject to rapid change and we cannot guarantee that our competitors may not implement more advanced technology platforms for their products, which could affect our business. Any inaccuracies, delays, system failures or breaches, or advancements in technology, and the cost necessary to address them, could subject us to client dissatisfaction and losses or result in material financial loss, regulatory violations, reputational harm or legal liability, which, in turn, could cause a decline in our earnings or stock price.
We may from time to time in the future be involved in legal proceedings that could require significant management time and attention, possibly resulting in significant expense or in an unfavorable outcome, which could have a material adverse effect on our business, financial condition, results of operations and cash flows.
From time to time, we may be subject to litigation. In any litigation in which we are involved, we may be forced to incur costs and expenses to defend ourselves or to pay a settlement or judgment or comply with any injunctions in connection therewith if there is an unfavorable outcome. The expense of defending litigation may be significant. The amount of time to resolve lawsuits is unpredictable and defending ourselves may divert management’s attention from the day-to-day operations of our business, which could adversely affect our business, results of operations, financial condition and cash flows. In addition, an unfavorable outcome in any such litigation could have a material adverse effect on our business, results of operations, financial condition and cash flows.
Catastrophic and unpredictable events could have a material adverse effect on our business.
A terrorist attack, war, power failure, cyber-attack, natural disaster or other catastrophic or unpredictable event could adversely affect our revenues, expenses and operating results by: interrupting our normal business operations; inflicting employee casualties, including loss of our key employees; requiring substantial expenditures and expenses to repair, replace and restore normal business operations; and reducing investor confidence. We have a disaster recovery plan to address certain contingencies, but this plan may not be sufficient in responding or ameliorating the effects of all disaster scenarios. Similarly, these types of events could also affect the ability of the third-party vendors that we rely upon to conduct our business, including parties that provide us with sub-advisory portfolio management services, custodial, fund accounting and administration services or index calculation services, to continue to provide these necessary services to us, even though they may also have disaster recovery plans to address these contingencies. In addition, a failure of the stock exchanges on which our ETFs trade to function properly could cause a material disruption to our business. If we or our third-party vendors are unable to respond adequately or in a timely manner, these failures may result in a loss of revenues and/or increased expenses, either of which would have a material adverse effect on our operating results.
A change of control of our Company would automatically terminate our investment management agreements relating to the WisdomTree ETFs unless the Board of Trustees of the WisdomTree Trust and shareholders of the WisdomTree ETFs voted to continue the agreements. A change in control could occur if a third-party were to acquire a controlling interest in our Company.
Under the Investment Company Act, an investment management agreement with a fund must provide for its automatic termination in the event of its assignment. The fund’s board must vote to continue such an agreement following any such assignment and the shareholders of the WisdomTree ETFs must approve the assignment. The cost of obtaining such shareholder approval can be significant and ordinarily would be borne by us. Similarly, under the Investment Advisers Act, a client’s investment management agreement may not be “assigned” by the investment adviser without the client’s consent.
30
An investment management agreement is considered under both acts to be assigned to another party when a controlling block of the adviser’s securities is transferred. Under both acts, there is a presumption that a stockholder beneficially owning 25% or more of an adviser’s voting stock controls the adviser and conversely a stockholder beneficially owning less than 25% is presumed not to control the adviser. In our case, an assignment of our investment management agreements may occur if a third-party were to acquire a controlling interest in our Company. We cannot be certain that the Trustees of the WisdomTree ETFs would consent to assignments of our investment management agreements or approve new agreements with us if a change of control occurs. And even if such approval were obtained, approval from the shareholders of the WisdomTree ETFs would be required to be obtained; such approval could not be guaranteed and even if obtained, likely would result in significant expense. This restriction may discourage potential purchasers from acquiring a controlling interest in our Company.
We may from time to time be subject to claims of infringement of third-party intellectual property rights, which could harm our business.
Third parties may assert against us alleged patent, copyright, trademark or other intellectual property rights to intellectual property that is important to our business. Any claims that our products or processes infringe the intellectual property rights of others, regardless of the merit or resolution of such claims, could cause us to incur significant costs in responding to, defending and resolving such claims, and may divert the efforts and attention of our management from our business. As a result of such intellectual property infringement claims, we could be required or otherwise decide that it is appropriate to:
| • | pay third-party infringement claims; |
| • | discontinue selling the particular funds subject to infringement claims; |
| • | discontinue using the processes subject to infringement claims; |
| • | develop other intellectual property or products not subject to infringement claims, which could be time-consuming and costly or may not be possible; or |
| • | license the intellectual property from the third-party claiming infringement, which license may not be available on commercially reasonable terms. |
The occurrence of any of the foregoing could result in unexpected expenses, reduce our revenues and adversely affect our business and financial results.
We have been issued a patent and have applied for other patents, but additional patents may not be issued to us and we may not be able to enforce or protect our patents and other intellectual property rights, which may harm our ability to compete and harm our business.
Although we have a patent and have applied for other patents relating to our index methodology and the operation of our ETFs, these other patents may not be issued to us. In addition, even if issued, our ability to enforce our patents and other intellectual property rights is subject to general litigation risks. While we have been competing without the benefit of these patents being issued, if they are not issued or we cannot successfully enforce them, we may lose the benefit of a future competitive advantage that they would otherwise provide to us. If we seek to enforce our rights, we could be subject to claims that the intellectual property right is invalid or is otherwise not enforceable. Furthermore, our assertion of intellectual property rights could result in the other party seeking to assert alleged intellectual property rights of its own or assert other claims against us, which could harm our business. If we are not ultimately successful in defending ourselves against these claims in litigation, we may be subject to the risks described in the immediately preceding risk factor entitled “We may from time to time be subject to claims of infringement of third-party intellectual property rights, which could harm our business.”
Risks Relating to our Common Stock
The market price of our common stock has been fluctuating significantly and may continue to do so, and you could lose all or part of your investment.
The market price of our common stock has been fluctuating significantly and may continue to do so, depending upon many factors, some of which may be beyond our control, including:
| • | decreases in our AUM; |
| • | variations in our quarterly operating results; |
| • | differences between our actual financial operating results and those expected by investors and analysts; |
31
| • | publication of research reports about us or the investment management industry; |
| • | changes in expectations concerning our future financial performance and the future performance of the ETF industry and the asset management industry in general, including financial estimates and recommendations by securities analysts; |
| • | our strategic moves and those of our competitors, such as acquisitions or consolidations; |
| • | changes in the regulatory framework of the ETF industry and the asset management industry in general and regulatory action, including action by the SEC to lessen the regulatory requirements or shortening the process to obtain regulatory relief under the Investment Company Act that is necessary to become an ETF sponsor; |
| • | the level of demand for our stock, including the amount of short interest in our stock; |
| • | changes in general economic or market conditions; and |
| • | realization of any other of the risks described elsewhere in this section. |
In addition, stock markets in general have experienced volatility that has often been unrelated to the operating performance of a particular company. These broad market fluctuations may adversely affect the trading price of our common stock. Furthermore, in the past, market fluctuations and price declines in a company’s stock have led to securities class action litigations or other derivative stockholder lawsuits. If such a suit were to arise, it could cause substantial costs to us and divert our resources regardless of the outcome.
If equity research analysts issue unfavorable commentary or downgrade our common stock, the price of our common stock could decline.
The trading market for our common stock relies in part on the research and reports that equity research analysts publish about us and our business. We do not control the opinions of these analysts. The price and trading volume of our common stock could decline if one or more equity analysts downgrade our common stock or if analysts issue other unfavorable commentary or cease publishing reports about us or our business.
Future issuances of our common stock could lower our stock price and dilute the interests of existing stockholders.
We may issue additional shares of our common stock in the future, either in connection with an acquisition, such as our proposed acquisition of ETFS, or for other business reasons. The issuance of a substantial amount of common stock could have the effect of substantially diluting the interests of our current stockholders. In addition, the sale of a substantial amount of common stock in the public market, either in the initial issuance or in a subsequent resale by the target company in an acquisition which received such common stock as consideration or by investors who acquired such common stock in a private placement, could have a material adverse effect on the market price of our common stock.
The members of our Board of Directors, their affiliates and our executive officers, as stockholders, can exert significant influence over our Company.
As of December 31, 2017, the members of our Board of Directors and our executive officers, as stockholders, collectively beneficially owned approximately 16.8% of our outstanding common stock. As a result of this ownership, they have the ability to significantly influence all matters requiring approval by stockholders of our Company, including the election of directors. This concentration of ownership also may have the effect of delaying or preventing a change in control of our Company that may be favored by other stockholders. This could prevent transactions in which stockholders might otherwise receive a premium for their shares over current market prices.
Although our directors and officers have a duty of loyalty to us under Delaware law and our certificate of incorporation, transactions that we enter into in which a director or officer has a conflict of interest are generally permissible so long as (i) the material facts relating to the director’s or officer’s relationship or interest as to the transaction are disclosed to our Board of Directors and a majority of our disinterested directors, or a committee consisting solely of disinterested directors, approves the transaction, (ii) the material facts relating to the director’s or officer’s relationship or interest as to the transaction are disclosed to our stockholders and a majority of our disinterested stockholders approves the transaction, or (iii) the transaction is otherwise fair to us. Under our certificate of incorporation, representatives of our stockholders are not required to offer to us any transaction opportunity of which they become aware and could take any such opportunity for themselves or offer it to other companies in which they have an investment, unless such opportunity is expressly offered to them solely in their capacity as a director of ours. The listing requirements of the NASDAQ Global Select Market, upon which our common stock is listed, also require that certain transactions in which a director or officer has a conflict of interest must be considered and approved by our Audit Committee, which consists solely of independent directors.
32
A provision in our certificate of incorporation and by-laws may prevent or delay an acquisition of our Company, which could decrease the market value of our common stock.
Provisions of Delaware law, our certificate of incorporation and our by-laws may discourage, delay or prevent a merger, acquisition or other change in control that stockholders may consider favorable. These provisions may also prevent or delay attempts by stockholders to replace or remove our current management or members of our Board of Directors. These provisions include:
| • | a classified Board of Directors; |
| • | limitations on the removal of directors; |
| • | advance notice requirements for stockholder proposals and nominations; |
| • | the inability of stockholders to act by written consent or to call special meetings; |
| • | the ability of our Board of Directors to make, alter or repeal our by-laws; and |
| • | the authority of our Board of Directors to issue preferred stock with such terms as our Board of Directors may determine. |
In addition, we are subject to the provisions of Section 203 of the Delaware General Corporation Law, which limits business combination transactions with stockholders of 15% or more of our outstanding voting stock that our Board of Directors has not approved. These provisions and other similar provisions make it more difficult for stockholders or potential acquirers to acquire us without negotiation. These provisions may apply even if some stockholders may consider the transaction beneficial to them.
As a result, these provisions could limit the price that investors are willing to pay in the future for shares of our common stock. These provisions might also discourage a potential acquisition proposal or tender offer, even if the acquisition proposal or tender offer is at a premium over the then current market price for our common stock.
The payment of dividends to our stockholders and our ability to repurchase our common stock is subject to the discretion of our Board of Directors and may be limited by our financial condition, our proposed credit agreement, and any applicable laws.
In November 2014, we commenced a quarterly cash dividend and intend to continue to pay regular dividends to our stockholders. In October 2014, our Board of Directors authorized a share repurchase program with a term that was extended through April 27, 2019, under which $88.6 million remained available for repurchases as of December 31, 2017. In connection with our agreement to acquire ETFS, our Board of Directors adjusted the quarterly dividend to $0.03 per share, beginning with the dividend payment in the first quarter of 2018. Under the terms of the credit agreement governing the credit facilities we plan to use to partially finance the acquisition, we will be required to comply with various covenants including a leverage test. A quarterly cash dividend payment in excess of $0.03 per share, as well as share repurchases other than for shares withheld pursuant to the terms of equity awards granted to employees to satisfy tax withholding obligations, will be permitted only to the extent we comply with the leverage test and no event of default (as defined in the credit agreement) has occurred and is continuing at the time the cash dividend payment or share repurchase is made as the case may be. Our Board of Directors may, in its discretion, decrease, but not increase, the level of dividends in the future. Further, our Board of Directors will continue to have the discretion to discontinue the payment of dividends entirely. Any determination as to the payment of dividends or stock repurchases, as well as the level of such dividends or repurchases, will depend on, among other things, general economic and business conditions, our level of AUM, our strategic plans, our financial results and condition, limitations associated with the credit facilities or other agreements that could limit the amount of dividends we are permitted to pay or the stock we may repurchase, and any applicable laws. If, as a consequence of these various limitations and restrictions, we are unable to generate sufficient income from our business, we may need to reduce or eliminate the payment of dividends on our common stock or cease repurchasing our common stock. Any change in our stock repurchases or the level of our dividends or the suspension of the payment thereof could adversely affect our stock price.
In addition, our Board of Directors is authorized, without stockholder approval, to issue preferred stock with such terms as our Board of Directors may, in its discretion, determine. Our Board of Directors could, therefore, issue preferred stock with dividend rights superior to that of the common stock, which could also limit the payment of dividends on the common stock.
33
| ITEM 1B. | UNRESOLVED STAFF COMMENTS |
We have no unresolved comments from the SEC staff relating to our periodic or current reports filed with the SEC pursuant to the Exchange Act.
| ITEM 2. | PROPERTIES |
Our principal executive office is located at 245 Park Avenue, New York, New York 10167. We occupy approximately 38,000 square feet of office space under a lease that expires in July 2029. We believe that the space we lease is sufficient to meet our needs until the expiration of the lease.
| ITEM 3. | LEGAL PROCEEDINGS |
We may be subject to reviews, inspections and investigations by the SEC, CFTC, NFA, state and foreign regulators, as well as legal proceedings arising in the ordinary course of business. We are not currently party to any litigation that is expected to have a material impact on our business, financial position, results of operations or cash flows.
| ITEM 4. | MINE SAFETY DISCLOSURES |
Not applicable.
| ITEM 5. | MARKET FOR REGISTRANT’S COMMON EQUITY, RELATED STOCKHOLDER MATTERS AND ISSUER PURCHASES OF EQUITY SECURITIES |
Market Information
Our common stock is traded on the NASDAQ Global Select Market under the symbol “WETF.” The following table sets forth the intra-day high and low sale prices per share as reported by the NASDAQ Global Select Market.
| Period |
High | Low | Dividends Declared |
|||||||||
| Fiscal 2017 |
||||||||||||
| Quarter ended December 31, 2017 |
$ | 12.68 | $ | 10.07 | $ | 0.08 | ||||||
| Quarter ended September 30, 2017 |
$ | 10.80 | $ | 8.75 | $ | 0.08 | ||||||
| Quarter ended June 30, 2017 |
$ | 10.53 | $ | 7.87 | $ | 0.08 | ||||||
| Quarter ended March 31, 2017 |
$ | 12.33 | $ | 8.30 | $ | 0.08 | ||||||
| Fiscal 2016 |
||||||||||||
| Quarter ended December 31, 2016 |
$ | 13.32 | $ | 8.00 | $ | 0.08 | ||||||
| Quarter ended September 30, 2016 |
$ | 12.07 | $ | 9.03 | $ | 0.08 | ||||||
| Quarter ended June 30, 2016 |
$ | 13.13 | $ | 8.70 | $ | 0.08 | ||||||
| Quarter ended March 31, 2016 |
$ | 15.63 | $ | 9.75 | $ | 0.08 | ||||||
As of December 31, 2017, there were 235 holders of record of shares of our common stock and we believe there were approximately 34,600 beneficial owners of our common stock.
Dividends
In November 2014, we commenced a quarterly cash dividend and intend to continue to pay regular dividends to our stockholders. In connection with our agreement to acquire ETFS, our Board of Directors adjusted the quarterly dividend to $0.03 per share, beginning with the dividend payment in the first quarter of 2018. Under the terms of the credit agreement governing the credit facilities we plan to use to partially finance the acquisition, we will be required to comply with various covenants including a leverage test. A quarterly cash dividend payment in excess of $0.03 per share will be permitted only to the extent we comply with the leverage test and no event of default (as defined within the credit agreement) has occurred and is continuing at the time the cash dividend payment is made. Our Board of Directors may, in its discretion, decrease, but not increase, the level of dividends in the future. Further, our Board of Directors has the discretion to discontinue the payment of dividends entirely. Any determination as to the payment of dividends, as well as the level of such dividends, will depend on, among other things, general economic and business conditions, our level of AUM, our strategic plans, our financial results and condition, limitations associated with the credit facilities or other agreements that could limit the amount of dividends we are permitted to pay, and any applicable laws.
34
Issuer Purchases of Equity Securities
The following table provides information with respect to purchases made by or on behalf of the Company or any “affiliated purchaser” of shares of our common stock.
| Total Number of Shares Purchased |
Average Price Paid Per Share |
Total Number of Shares Purchased as Part of Publicly Announced Plans or Programs(1) |
Approximate Dollar Value of Shares that May Yet Be Purchased Under the Plans or Programs |
|||||||||||||
| Period |
(in thousands) | |||||||||||||||
| October 1, 2017 to October 31, 2017 |
— | $ | — | — | ||||||||||||
| November 1, 2017 to November 30, 2017 |
— | $ | — | — | ||||||||||||
| December 1, 2017 to December 31, 2017 |
295,851 | $ | $12.55 | 295,851 | ||||||||||||
|
|
|
|
|
|||||||||||||
| Total |
295,851 | $ | $12.55 | 295,851 | $ | 88,614 | ||||||||||
|
|
|
|
|
|
|
|||||||||||
| (1) | On October 29, 2014, our Board of Directors authorized a three-year share repurchase program of up to $100 million. On April 27, 2016, the Board approved a $60.0 million increase to this program and extended the term through April 27, 2019, increasing the total authorized repurchase amount to $100.3 million. During the three months ended December 31, 2017, we repurchased 295,851 shares of our common stock under this program for an aggregate cost of approximately $3.7 million. As of December 31, 2017, $88.6 million remained under this program for future purchases. Under the terms of the credit agreement governing the credit facilities we plan to use to partially finance the acquisition of ETFS, share repurchases will be permitted only to the extent we comply with a leverage test and no event of default (as defined in the credit agreement) has occurred and is continuing at the time the cash dividend payment is made. However, our ability to purchase shares of our common stock withheld pursuant to the terms of equity awards granted to employees to satisfy tax withholding obligations will not be restricted. |
35
| ITEM 6. | SELECTED FINANCIAL DATA |
You should read the selected consolidated financial data presented below in conjunction with the section entitled “Management’s Discussion and Analysis of Financial Condition and Results of Operations” in this Report and our consolidated financial statements and the related notes included elsewhere in this Report. The selected consolidated statements of operations data presented below under the heading “Consolidated Statements of Operations Data” for the years ended December 31, 2015, 2016 and 2017 and the selected consolidated balance sheet data presented below under the heading “Consolidated Balance Sheet Data” as of December 31, 2016 and 2017 have been derived from our audited consolidated financial statements included elsewhere in this Report. The selected consolidated financial data presented below under the headings “Consolidated Statements of Operations Data” for the years ended December 31, 2013 and 2014 and under “Consolidated Balance Sheet Data” as of December 31, 2013, 2014 and 2015 have been derived from our consolidated financial statements not included in this Report. The historical results presented below are not necessarily indicative of the financial results to be expected for future periods.
| 2013 | 2014 | 2015 | 2016 | 2017 | ||||||||||||||||
| (in thousands, except per share data) | ||||||||||||||||||||
| Consolidated Statements of Operations Data: |
||||||||||||||||||||
| Revenues: |
||||||||||||||||||||
| Advisory fees |
$ | 148,594 | $ | 182,816 | $ | 297,944 | $ | 218,465 | $ | 227,775 | ||||||||||
| Settlement gain |
— | — | — | — | 6,909 | |||||||||||||||
| Other income |
874 | 946 | 998 | 981 | 2,715 | |||||||||||||||
|
|
|
|
|
|
|
|
|
|
|
|||||||||||
| Total revenues |
149,468 | 183,762 | 298,942 | 219,446 | 237,399 | |||||||||||||||
| Expenses: |
||||||||||||||||||||
| Compensation and benefits |
36,210 | 40,995 | 73,228 | 63,263 | 81,493 | |||||||||||||||
| Fund management and administration |
35,076 | 34,383 | 42,782 | 41,083 | 42,144 | |||||||||||||||
| Marketing and advertising |
8,309 | 11,514 | 13,371 | 15,643 | 14,402 | |||||||||||||||
| Sales and business development |
6,474 | 6,221 | 9,189 | 12,537 | 13,811 | |||||||||||||||
| Professional and consulting fees |
2,748 | 7,578 | 7,067 | 6,692 | 10,086 | |||||||||||||||
| Occupancy, communications and equipment |
2,784 | 3,578 | 4,299 | 5,211 | 5,415 | |||||||||||||||
| Depreciation and amortization |
439 | 821 | 1,006 | 1,305 | 1,395 | |||||||||||||||
| Third-party sharing arrangements |
1,368 | 594 | 2,443 | 2,827 | 3,393 | |||||||||||||||
| Goodwill impairment |
— | — | — | 1,676 | — | |||||||||||||||
| Acquisition payment |
— | — | 2,185 | 6,738 | — | |||||||||||||||
| Other |
4,523 | 4,530 | 6,187 | 6,909 | 7,068 | |||||||||||||||
|
|
|
|
|
|
|
|
|
|
|
|||||||||||
| Total expenses |
97,931 | 110,214 | 161,757 | 163,884 | 179,207 | |||||||||||||||
|
|
|
|
|
|
|
|
|
|
|
|||||||||||
| Income before taxes |
51,537 | 73,548 | 137,185 | 55,562 | 58,192 | |||||||||||||||
| Income tax expense |
— | 12,497 | 57,133 | 29,407 | 30,993 | |||||||||||||||
|
|
|
|
|
|
|
|
|
|
|
|||||||||||
| Net income |
$ | 51,537 | $ | 61,051 | $ | 80,052 | $ | 26,155 | $ | 27,199 | ||||||||||
|
|
|
|
|
|
|
|
|
|
|
|||||||||||
| Net income per share—basic |
$ | 0.41 | $ | 0.46 | $ | 0.58 | $ | 0.19 | $ | 0.20 | ||||||||||
| Net income per share—diluted |
$ | 0.37 | $ | 0.44 | $ | 0.58 | $ | 0.19 | $ | 0.20 | ||||||||||
| Weighted average common shares—basic |
126,651 | 131,770 | 137,242 | 134,401 | 134,614 | |||||||||||||||
| Weighted average common shares—diluted |
139,797 | 138,551 | 138,825 | 135,539 | 136,003 | |||||||||||||||
| Cash dividends declared per common share |
$ | — | $ | 0.08 | $ | 0.57 | $ | 0.32 | $ | 0.32 | ||||||||||
| 2013 | 2014 | 2015 | 2016 | 2017 | ||||||||||||||||
| Consolidated Balance Sheet Data: |
||||||||||||||||||||
| Cash and cash equivalents |
$ | 104,316 | $ | 165,284 | $ | 210,070 | $ | 92,722 | $ | 54,193 | ||||||||||
| Total assets |
$ | 141,791 | $ | 220,751 | $ | 292,693 | $ | 249,767 | $ | 254,985 | ||||||||||
| Total liabilities |
$ | 32,762 | $ | 36,466 | $ | 58,191 | $ | 48,423 | $ | 62,034 | ||||||||||
| Stockholders’ equity |
$ | 109,029 | $ | 184,285 | $ | 234,502 | $ | 201,344 | $ | 192,951 | ||||||||||
36
| ITEM 7. | MANAGEMENT’S DISCUSSION AND ANALYSIS OF FINANCIAL CONDITION AND RESULTS OF OPERATIONS |
The following discussion and analysis of our financial condition and results of operations should be read together with our consolidated financial statements and the related notes and the other financial information included elsewhere in this Report. In addition to historical consolidated financial information, the following discussion contains forward-looking statements that reflect our plans, estimates and beliefs. Our actual results could differ materially from those discussed in the forward-looking statements. Factors that could cause or contribute to these differences include those discussed below. For a more complete description of the risks noted above and other risks that could cause our actual results to materially differ from our current expectations, please see Item 1A. “Risk Factors” of this Report. We assume no obligation to update or revise publicly any forward-looking statements, whether as a result of new information, future events or otherwise, unless required by law.
Introduction
We are one of the leading ETP sponsors in the world (based on AUM), with AUM of $48.9 billion globally as of December 31, 2017. An ETP is a pooled investment vehicle that holds a basket of financial instruments, securities or other assets and generally seeks to track (index-based) or outperform (actively managed) the performance of a broad or specific equity, fixed income or alternatives market segment, commodity or currency (or an inverse or multiple thereof). ETPs are listed on an exchange with their shares traded in the secondary market at market prices, generally at approximately the same price as the net asset value of their underlying components. ETP is an umbrella term that includes ETFs, exchange-traded notes and exchange-traded commodities.
Through our operating subsidiaries, we provide investment advisory and other management services to the WisdomTree ETFs and Boost ETPs collectively offering ETPs covering equity, fixed income, currency, alternatives and commodity asset classes. In exchange for providing these services, we receive advisory fee revenues based on a percentage of the ETPs’ average daily AUM. Our expenses are predominantly related to selling, operating and marketing our ETPs. We have contracted with third parties to provide certain operational services for the ETPs. We distribute our ETPs through all major channels within the asset management industry, including brokerage firms, registered investment advisers, institutional investors, private wealth managers and discount brokers primarily through our sales force. Our sales efforts are not directed towards the retail segment but rather are directed towards financial or investment advisers that act as intermediaries between the end-client and us. Recent investments in technology-enabled services and the launch of our Advisor Solutions program in October 2017, which includes portfolio construction, asset allocation, practice management services and wealth management technology via the AdvisorEngine platform, have been made to differentiate us in the market, expand our distribution and further enhance our relationships with financial advisors.
Executive Summary
Our U.S. listed AUM, which currently makes up the vast majority of our global AUM, has fluctuated over the last three fiscal years, from $51.6 billion at the end of 2015, to $40.2 billion at the end of 2016 and $46.8 billion at the end of 2017. While our net flows historically have been concentrated in our two largest ETFs and aligned with market sentiment, we have taken additional steps to broaden the diversification of our flows through recent investments in technology-enabled services including the rollout of our Advisor Solutions program in the fourth quarter of 2017. For example, in 2015, our currency hedged European equity ETF (HEDJ) comprised the vast majority of our net inflows and offset the outflows we experienced in emerging markets as the accommodative monetary policy of the European Central Bank weakened the Euro, stimulating the local equity markets. Similarly, we experienced strong inflows into our currency hedged Japanese equity ETF (DXJ) in 2013 as a result of a weakening Yen due to political and economic policy changes in Japan. In 2016, we experienced significant outflows in these two products as those markets fell out of favor with investors. In 2017, we experienced additional outflows in HEDJ as the Euro strengthened, which was largely driven by an improvement in the Eurozone’s economic outlook. However, we also experienced $2.9 billion of net inflows into our U.S. listed ETFs (excluding HEDJ and DXJ), including $2.1 billion of net inflows across 56 of our ETFs in the fourth quarter of 2017, which can be attributed in part to our rollout of the Advisor Solutions program.
In November 2017, we agreed to acquire ETFS, which includes $17.8 billion of AUM as of December 31, 2017. The acquisition, which is expected to close late in the first quarter of 2018 (subject to regulatory approval and other customary closing conditions), will provide us with immediate scale in Europe, an industry leading position in European-listed gold and commodity products, greater AUM diversification globally, and profitability within our International Business segment. A substantial portion of AUM of ETFS are in products backed by gold. These products historically have been negatively correlated with our two largest ETFs, HEDJ and DXJ, and therefore we may experience improved stability of our AUM and lower overall AUM volatility if the acquisition of ETFS is completed. However, we can provide no assurance that the negative historical correlation between the AUM of ETFS and the AUM of our two largest ETFs will continue in the future.
Our financial results have fluctuated along with the changes in our AUM. Revenues were $298.9 million, $219.4 million and $237.4 million in 2015, 2016 and 2017, respectively.
In addition to effectively integrating ETFS, if the acquisition is completed, our strategic focus remains diversifying and stabilizing our asset base by fostering deeper relationships through technology-driven solutions, increasing penetration within existing distribution channels and expanding into new distribution channels, continuing to grow our international business and offering innovative products.
37
Other business highlights for 2017 include the following:
| • | In October 2017, we launched our Advisor Solutions program, which is focused on providing technology-enabled solutions to help financial advisors address technology challenges and grow and scale their businesses. The Advisor Solutions program includes: |
| • | wealth investment research and ETF education; |
| • | portfolio construction services such as the Digital Portfolio Developer, or DPD, an enhanced portfolio construction tool that assists financial advisors in analyzing an existing investment portfolio by analyzing the data and providing alternative portfolio approaches to consider in seeking to improve outcomes based on different measures; |
| • | access to ETF model portfolios, which are currently available on several platforms. Our model portfolios are a natural extension of our research capabilities and provide advisors access to an open-architecture approach, a tenured team and a firm dedicated to innovation and value creation; |
| • | practice management resources, including access to thought leaders in retirement planning, leadership and behavioral finance; and |
| • | wealth management technology through AdvisorEngine, a customized end-to-end platform for financial advisors. AdvisorEngine offers an array of distinct product offerings that provide advisors with new client prospecting tools, online client onboarding, institutional grade analytics, trading, performance reporting and billing. Its technology is distinctive in that it provides these features from an advisor-centric point of view, allowing advisors to deepen their engagement with clients and demonstrate the value of the advisory relationship. |
| • | In October 2017, 72 of our U.S. listed ETFs were added to TD Ameritrade’s expanded and enhanced commission-free ETF program, which allows for investors using the TD Ameritrade platform to purchase these ETFs without incurring the costs of trading commission fees. This commission-free access spans asset classes including equities, fixed income and alternatives, and includes a variety of investment categories in which we are a smart beta ETF provider. In January 2018 our commission free ETF model portfolios became available on the TD Ameritrade Institutional Model Market Center which offers financial advisors the ability to subscribe to third-party models and personalize portfolios according to their clients’ unique needs. |
| • | During June 2017, we collaborated with IBM’s Advanced Analytics practice and global consulting agency Bluewolf, an IBM Company, to develop a cognitive customer-focused lead prioritization system leveraging IBM Watson to enhance our distribution efforts. The system evaluates data across structured and unstructured sources such as historical investment data, market data and investor activity history, extracting behavioral insights, and is designed to enable our sales and marketing teams to optimize outreach to our potential investor base. |
| • | In November 2017, we acquired a suite of eight Canadian listed ETFs from Questrade, which represented approximately $77.4 million in AUM at closing. As part of the transaction, we became a premier provider of ETFs available for purchase on a commission-free basis on Questrade’s self-directed platform, including all of our Canadian listed ETFs. |
| • | We launched 5 new U.S. listed ETFs, 6 new Canadian listed ETFs, 2 new Boost ETPs and 1 new WisdomTree UCITs ETF. |
| • | We returned approximately $51.7 million to our stockholders largely through our ongoing quarterly cash dividend and to a lesser extent, through stock repurchases. |
Business Segments
We operate as an ETP sponsor and asset manager providing investment advisory services in the U.S., Europe, Canada and Japan. These activities are reported in our U.S. Business and International Business segments, as follows:
| • | U.S. Business segment: Our U.S. business and Japan sales office, which primarily engages in selling our U.S. listed ETFs to Japanese institutional clients; and |
| • | International Business segment: Our European business, which commenced in April 2014 in connection with our acquisition of Boost and our Canadian business, which launched its first six ETFs in July 2016. This segment will also include ETFS if the acquisition is completed. |
38
Background
Market Environment
The following chart reflects the annual returns of the broad-based equity indexes over the last three years. As the chart reflects, the broad-based equity market indexes have been volatile since 2014.
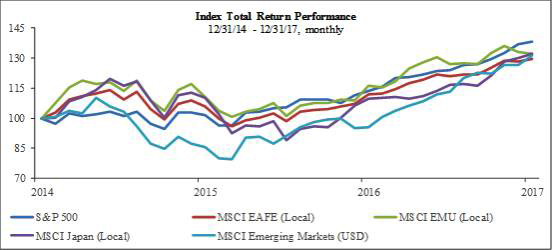
Source: FactSet
The vast majority of our global AUM is currently in U.S. listed ETFs. Our international AUM should increase substantially following the completion of our acquisition of ETFS, if the acquisition is completed. The AUM of ETFS at December 31, 2017 was $17.8 billion.
The U.S. ETF industry also has been experiencing generally higher flows as the charts below reflect. In 2017, domestic equities gathered the majority of net inflows for the year:
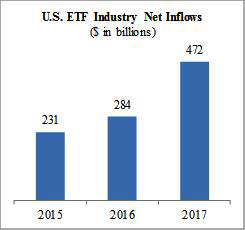
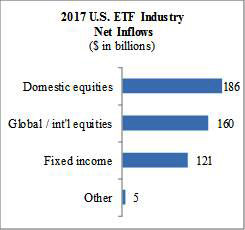
Source: Investment Company Institute.
Industry Developments
The ETF industry is becoming significantly more competitive. There has been increased price competition in not only commoditized product categories such as traditional, market capitalization weighted index exposures, but also in fundamental or other non-market cap weighted or factor-based exposures. Certain ETF sponsors have been reducing fees, which has been a trend over the last few years that accelerated meaningfully in 2017. Funds are being offered with fees of 20 bps or less, which attracted approximately 70% of the net flows into U.S. listed ETFs during the year ended December 31, 2017. In addition, existing players have broadened their suite of products to offering strategies that are, in some cases, similar to ours. Large traditional asset managers are also launching ETFs, some with similar strategies as well.
39
While low cost ETFs have accumulated a significant amount of AUM recently, these same funds have captured only 34% of the revenues associated with the net flows into U.S. listed ETFs during 2017. In addition, in the ETF industry, being a first mover, or one of the first providers of ETFs in a particular asset class, can be a significant advantage, as the first ETF in a category to attract scale in AUM and trading liquidity is generally viewed as the most attractive ETF. We believe that our early launch of ETFs in a number of asset classes or strategies, including fundamental weighting and currency hedging, positions us well to maintain our position as one of the leaders of the ETF industry. Additionally, we believe our affiliated indexing or “self-indexing” model enables us to launch proprietary products which do not have exact competition.
In April 2016, the DOL published the Fiduciary Rule to address conflicts of interest in retirement advice, and full compliance with the rule is required by July 1, 2019. In response to the Fiduciary Rule, the shift from commission- to fee-based advisory models has accelerated as several large asset management firms have announced and implemented changes to their platforms and policies that favor fee based account structures. Also in response to the Fiduciary Rule, several fund sponsors have implemented further fee reductions which have occurred primarily in commoditized exposures based upon third-party indexes. We believe that ETFs’ competitiveness generally will increase as a result of the Fiduciary Rule due to the inherent benefits of ETFs – transparency and liquidity; and while we are not immune to fee pressure, we believe our self-indexing capabilities and regulatory exemptive relief provides a strategic advantage.
Components of Revenue
Advisory fees
The majority of our revenues are comprised of advisory fees we earn from our U.S. listed ETFs. We earn this revenue based on a percentage of the average daily value of AUM. Our average daily value of AUM is the average of the daily aggregate AUM of our ETFs as determined by the then current net asset value (as defined under Investment Company Act Rule 2a-4) of such ETFs as of the close of business each day. Our fee percentages for individual U.S. listed ETFs, net of fee waivers, range from 0.12% to 0.88%.
We determine the appropriate advisory fee to charge for our ETFs based on the cost of operating each particular ETF taking into account the types of securities the ETFs will hold, fees third-party service providers will charge us for operating the ETFs and our competitors’ fees for similar ETFs. Generally, our actively managed ETFs, along with our emerging markets ETFs, are priced higher than our other index based ETFs.
Each of our ETFs has a fixed advisory fee. To increase the advisory fee, we would need to obtain approval from a majority of the ETF shareholders, which may be difficult or not possible to achieve. There also may be a significant cost in obtaining such ETF shareholder approval. We do not need ETF shareholder approval to lower our advisory fee. From time to time, we implement voluntary waivers of a portion of our advisory fee. These waivers may expire without shareholder approval needing to be obtained. In addition, we earn a fee based on daily aggregate AUM of our ETFs in exchange for bearing certain fund expenses.
Our ETF advisory fee revenues may fluctuate based on general stock market trends, which include market value appreciation or depreciation, currency fluctuations against the U.S. dollar and level of inflows or outflows from our ETFs. In addition, these revenues may fluctuate due to increased competition or a determination by the independent trustees of the WisdomTree ETFs to terminate or significantly alter the funds’ investment management agreements with us.
Settlement gain
A settlement gain of $6.9 million was recorded during the second quarter of 2017 representing the fair value of the preferred stock of Thesys Group, Inc. (formerly known as Tradeworx, Inc.) (“Thesys”) that we received in connection with the resolution of a dispute regarding our ownership stake in Thesys.
Other income
Other income includes interest income from investing our corporate cash and fees from licensing our indexes to third parties. The licensing fees are immaterial to our financial results and we do not expect them to be material in the near term.
Components of Expenses
Our operating expenses consist primarily of costs related to selling, operating and marketing our ETFs as well as the infrastructure needed to run our business.
Compensation and benefits
Employee compensation and benefits expenses are expensed when incurred and include salaries, incentive compensation, and related benefit costs. Virtually all our employees receive incentive compensation that is based on our operating results as well as their individual performance. Therefore, a portion of this expense will fluctuate with our business results. To attract and retain qualified personnel, we must maintain competitive employee compensation and benefit plans. We would expect changes in employee compensation and benefits expense to be correlated with changes in our revenues and net inflows.
40
Also included in compensation and benefits are costs related to equity awards granted to our employees. Our executive management and Board of Directors strongly believe that equity awards are an important part of our employees’ overall compensation package and that incentivizing our employees with equity in the Company aligns the interest of our employees with that of our stockholders. We use the fair value method in recording compensation expense for equity based awards. Under the fair value method, compensation expense is measured at the grant date based on the estimated fair value of the award and is recognized as an expense over the vesting period.
We expect our compensation and benefits expense for our U.S. Business segment will be between 27% to 29% of U.S. Business segment revenues in 2018.
Fund management and administration
Fund management and administration expenses are expensed when incurred and are comprised of the following costs we pay third-party service providers to operate our ETFs:
| • | portfolio management of our ETFs (sub-advisory); |
| • | fund accounting and administration; |
| • | custodial services; |
| • | transfer agency; |
| • | accounting and tax services; |
| • | printing and mailing of stockholder materials; |
| • | index calculation; |
| • | indicative values; |
| • | distribution fees; |
| • | legal and compliance services; |
| • | exchange listing fees; |
| • | trustee fees and expenses; |
| • | preparation of regulatory reports and filings; |
| • | insurance; |
| • | certain local income taxes; and |
| • | other administrative services. |
We are not responsible for extraordinary expenses, taxes and certain other expenses.
BNY Mellon acts as sub-adviser for the majority of our ETFs. Fund administration, custody and accounting related services are performed by State Street. The fees we pay BNY Mellon and our other sub-advisers generally have minimums per fund which range from $25,000 to $50,000 per year with additional fees ranging between 0.015% and 0.20% of average daily AUM at various breakpoint levels depending on the nature of the ETF. In addition, we pay certain costs based on transactions in our ETFs or based on inflow levels. The fees we pay for accounting, tax, transfer agency, index calculation, indicative values and exchange listing are based on the number of ETFs we have. The remaining fees are based on a combination of both AUM and number of funds, or as incurred.
Marketing and advertising
Marketing and advertising expenses are recorded when incurred and include the following:
| • | advertising and product promotion campaigns that are initiated to promote our existing and new ETFs as well as brand awareness; |
| • | development and maintenance of our website; and |
| • | creation and preparation of marketing materials. |
Our discretionary advertising comprises the largest portion of this expense and we generally expect these costs to increase as we continue to execute our growth strategy and compete against other ETF sponsors. In addition, we may incur expenditures in certain periods to attract inflows, the benefit of which may or may not be recognized from increases to our AUM in future periods. However, due to the discretionary nature of some of these costs, they can generally be reduced if there were a decline in the markets.
Sales and business development
Sales and business development expenses are recorded when incurred and include the following:
| • | travel and entertainment or conference related expenses for our sales force; |
41
| • | market data services for our research team; |
| • | sales related software tools; |
| • | voluntary payment of certain costs associated with the creation or redemption of ETF shares, as we may elect from time to time; and |
| • | legal and other advisory fees associated with the development of new funds or business initiatives. |
Professional and consulting fees
Professional fees are expensed when incurred and consist of fees we pay to corporate advisers including accountants, tax advisers, legal counsel, investment bankers, human resources or other consultants. These expenses fluctuate based on our needs or requirements at the time. Certain of these costs are at our discretion and can fluctuate year to year.
Occupancy, communications and equipment
Occupancy, communications and equipment expense includes costs for our corporate headquarters in New York City as well as office related costs in our other locations.
Depreciation and amortization
Depreciation and amortization expense results primarily from amortization of leasehold improvements to our office space as well as depreciation on fixed assets we purchase, which is depreciated over five to fifteen years.
Third-party sharing arrangements
Third-party sharing arrangements expense includes payments to our third-party marketing agents in Latin America, Australia, New Zealand and Israel. In addition, this expense includes fees we pay to enable our ETFs to be included on certain third-party platforms.
Acquisition payment
Prior to May 2016, acquisition payment expense represented the change in the fair value of the buyout obligation of the remaining minority interest in our European business, in which we acquired a majority stake in April 2014. In May 2016, we accelerated the buyout of this remaining minority interest and the final buyout obligation was quantified based on a formula applied to projected AUM in the business and its projected profitability levels.
Other
Other expenses consist primarily of insurance premiums, general office related expenses, securities license fees for our sales force, public company related expenses, corporate related travel and entertainment and board of director fees, including stock-based compensation related to equity awards we granted to our directors.
Income tax
Overview
Our consolidated effective income tax expense consists of taxes due to federal, various state and local and certain foreign authorities. This rate was 53.3% for the year ended December 31, 2017 and was impacted by a valuation allowance on foreign net operating losses, stock-based compensation tax shortfalls and windfalls, and certain items including non-deductible transaction costs.
U.S. Tax Reform
On December 22, 2017, the Tax Cuts and Jobs Act, or the TCJA, was enacted, which was the most comprehensive U.S. tax reform in more than 30 years. The sweeping modifications to the Internal Revenue Code include a significant reduction in the federal income tax rate (from 35% to 21%), change certain tax deductions including a disallowance for all executive compensation paid in excess of $1 million, create a territorial tax system with a one-time transition tax on previously deferred foreign earnings and require minimum taxes to be paid on future foreign earnings.
We anticipate that we will benefit from a significant reduction in taxes payable on earnings subject to U.S. tax as our statutory tax rate on such earnings will be approximately 25%, a significant decline from approximately 40% historically. The actual U.S. effective tax rate is also anticipated to be lower and will be dependent upon our actual state apportionment and the magnitude of adjustments to pre-tax book income required to arrive at taxable income such as compensation paid to certain executives in excess of $1 million, non-deductible transaction costs, stock-based compensation windfalls or shortfalls, non-deductible meals and entertainment expense and deductions received for dividends paid on unvested restricted stock awards. The requirement for minimum
42
taxes to be paid on future foreign earnings is not currently expected to be significant as our foreign operations have NOLs and are currently generating losses. However, the anticipated acquisition of ETFS is expected to result in significant profitability of our International Business segment and will require an allocation of these profits to certain international jurisdictions pursuant to a transfer pricing arrangement which has yet to be completed. The profits allocation will directly impact the amount of foreign taxes paid. The magnitude of any minimum U.S. taxes to be paid on these foreign profits, pursuant to the TCJA, will ultimately be dependent upon the actual amounts paid to the foreign jurisdictions. However, the anticipated acquisition of ETFS should benefit our overall consolidated effective tax rate as the business operates in jurisdictions with tax rates that are lower than our pre-existing businesses.
We currently anticipate that the normalized effective tax rate applicable to our U.S. Business segment for the year ending December 31, 2018 will be approximately 28% and that our normalized consolidated effective tax rate assuming the completion of the acquisition of ETFS will be approximately 30%. Our normalized consolidated effective tax rate, excluding the acquisition of ETFS is estimated to be approximately 33%. These estimated rates may change and are dependent upon our actual taxable income earned in relation to our forecasts as well as any other items which may arise that are not currently forecasted. Such items may include, but are not limited to, any non-deductible transaction costs incurred in connection with the acquisition of ETFS and any stock-based compensation windfalls or shortfalls.
Accounting Standards Codification (“ASC”) 740, Income Taxes, requires the effects of changes in tax rates and laws on deferred tax balances (including the effects of the one-time transition tax) to be recognized in the period in which the legislation is enacted. The remeasurement of our net deferred tax assets, or DTAs, using a statutory federal and state and local tax rate of approximately 25% resulted in a charge of $0.5 million. The one-time transition tax was not material as our international subsidiaries historically have generated losses. Our accounting for the income tax effects of the TCJA is complete based on currently available guidance and interpretations.
Factors that May Impact our Future Financial Results
Revenues
Our revenues are highly correlated to the level and relative mix of our AUM, as well as the fee rate associated with our ETFs, and is impacted by market sentiment.
A significant portion of our AUM is held in ETFs that invest in foreign securities. Therefore, our AUM and revenues are affected by movements in global capital market levels and the strengthening or weakening of the U.S. dollar against other currencies. As the chart below reflects, as of December 31, 2017, 36% of our U.S. AUM was concentrated in two products with similar strategies – HEDJ, our European equity ETF which hedges exposure to the Euro, and DXJ, our Japanese equity ETF which hedges exposure to the Yen. The strengthening of the Euro or Yen against the U.S. dollar, or the decline in European or Japanese equity markets, may have an adverse effect on our results.
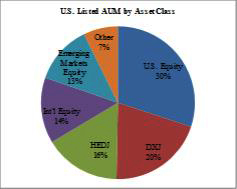
Another factor impacting our revenues is the fees associated with our ETFs. Our overall average fee rate is affected by the mix of flows into our ETFs. With a significant portion of our AUM held in ETFs that invest in foreign securities, favorable market sentiment toward international equities (particularly during a time when the U.S. dollar is strengthening for our international currency hedged products) is likely to have a positive effect on our overall revenues and conversely unfavorable market sentiment is likely to have a negative impact.
Our fund and investment theme concentrations are expected to improve assuming the completion of our acquisition of ETFS. As shown in the charts below, the AUM of ETFS when combined with the AUM of our existing WisdomTree ETPs results in a well-diversified mix with immediate scale in commodities and an industry leading position in European listed gold products. In addition, our concentrations in HEDJ and DXJ are reduced by an aggregate of approximately 10 percentage points to 11% and 14%, respectively.
43
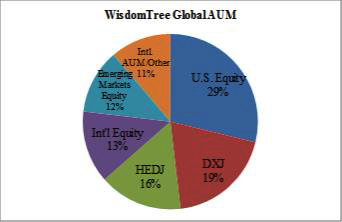
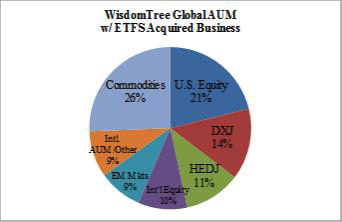
Gold historically has been negatively correlated with our two largest ETFS, HEDJ and DXJ, and therefore we may experience improved stability of our AUM and lower overall AUM volatility if the acquisition of ETFS is completed. However, we can provide no assurance that the negative historical correlation between the AUM of ETFS and the AUM of our two largest ETFs will continue in the future.
We also currently compete within the ETF market against several large ETF sponsors, many smaller sponsors, as well as new entrants to the marketplace, including large asset management companies that have launched or intend to launch ETFs. Competitive pressures could reduce revenues and profit margins as certain existing players have launched ETFs with fees that are generally equivalent to, and in some instances lower than, our ETFs. Certain ETF sponsors have been reducing fees which has been a trend over the last few years that accelerated meaningfully in 2017. Funds are being offered with fees of 20 bps or less, which attracted approximately 70% of the net flows into U.S. listed ETFs during the year ended December 31, 2017. In addition, existing players have broadened their suite of products offering strategies that are, in some cases, similar to ours. Large traditional asset managers are also launching ETFs, some with similar strategies as well.
While low cost ETFs have accumulated a significant amount of AUM recently, these same funds have captured only 34% of the revenues associated with the net flows into U.S. listed ETFs during 2017. We believe that our early launch of ETFs in a number of asset classes or strategies, including fundamental weighting and currency hedging, positions us well to maintain our position as one of the leaders in the ETF industry. Additionally, we believe our affiliated indexing or “self-indexing” model enables us to launch proprietary products which do not have exact competition. These competitive advantages, coupled with general stock market trends, will have the greatest impact on our business.
Expenses – Growth Initiative Spending
We have made significant investments in our business over the last several years, which have elevated the recurring expense base for future years. We expect our spending on new strategic growth initiatives to range from $3.0 million to $5.0 million in 2018 which will focus on technology initiatives and expanding our distribution abilities, specifically relating to our Advisor Solutions program.
Our actual growth initiative spending may increase or decrease from our planned estimates depending on the nature of the growth initiatives and market conditions.
Seasonality
We believe seasonal fluctuations in the asset management industry are common, however such trends are generally masked by global market events and market volatility in general. Therefore, period to period comparisons of ours or the industry’s flows and operating results may not be meaningful or indicative of results in future periods.
44
Key Operating Statistics
The following table presents key operating statistics that serve as indicators for the performance of our business:
| Year Ended December 31, | ||||||||||||
| 2017 | 2016 | 2015 | ||||||||||
| U.S. LISTED ETFs (in millions) |
||||||||||||
| Beginning of period assets |
$ | 40,164 | $ | 51,639 | $ | 39,281 | ||||||
| Assets acquired |
— | 225 | — | |||||||||
| Inflows/(outflows) |
234 | (12,557 | ) | 16,856 | ||||||||
| Market appreciation/(depreciation) |
6,429 | 857 | (4,498 | ) | ||||||||
|
|
|
|
|
|
|
|||||||
| End of period assets |
$ | 46,827 | $ | 40,164 | $ | 51,639 | ||||||
|
|
|
|
|
|
|
|||||||
| Average assets during the period |
$ | 43,516 | $ | 41,012 | $ | 55,930 | ||||||
| Revenue days |
365 | 366 | 365 | |||||||||
| Number of ETFs - end of the period |
89 | 94 | 86 | |||||||||
| ETF Industry and Market Share (in billions) |
||||||||||||
| ETF industry net inflows |
$ | 472 | $ | 284 | $ | 231 | ||||||
| WisdomTree market share of industry inflows |
0.1 | % | n/a | 7.3 | % | |||||||
| Average ETF advisory fee during the period |
||||||||||||
| Alternative strategy ETFs |
0.59 | % | 0.79 | % | 0.95 | % | ||||||
| Emerging markets equity ETFs |
0.70 | % | 0.71 | % | 0.71 | % | ||||||
| International developed equity ETFs |
0.56 | % | 0.56 | % | 0.56 | % | ||||||
| International hedged equity ETFs |
0.53 | % | 0.54 | % | 0.54 | % | ||||||
| Currency ETFs |
0.50 | % | 0.50 | % | 0.50 | % | ||||||
| Fixed income ETFs |
0.40 | % | 0.44 | % | 0.52 | % | ||||||
| U.S. equity ETFs |
0.35 | % | 0.35 | % | 0.35 | % | ||||||
|
|
|
|
|
|
|
|||||||
| Blended total |
0.50 | % | 0.51 | % | 0.53 | % | ||||||
|
|
|
|
|
|
|
|||||||
| EUROPEAN LISTED ETPs |
||||||||||||
| Total ETPs (in thousands) |
||||||||||||
| Beginning of period assets |
$ | 626,280 | $ | 437,934 | $ | 165,018 | ||||||
| Inflows/(outflows) |
290,399 | 197,870 | 539,780 | |||||||||
| Market appreciation/(depreciation) |
16,274 | (9,524 | ) | (266,864 | ) | |||||||
|
|
|
|
|
|
|
|||||||
| End of period assets |
$ | 932,953 | $ | 626,280 | $ | 437,934 | ||||||
|
|
|
|
|
|
|
|||||||
| Average assets during the period |
812,434 | 550,572 | 358,895 | |||||||||
| Average ETP advisory fee during the period |
0.78 | % | 0.82 | % | 0.83 | % | ||||||
| Number of ETPs - end of period |
70 | 68 | 64 | |||||||||
| Total UCITS ETFs (in thousands) |
||||||||||||
| Beginning of period assets |
$ | 398,015 | $ | 335,938 | $ | 16,179 | ||||||
| Inflows/(outflows) |
340,053 | 51,905 | 287,573 | |||||||||
| Market appreciation/(depreciation) |
133,134 | 10,172 | 32,186 | |||||||||
|
|
|
|
|
|
|
|||||||
| End of period assets |
$ | 871,202 | $ | 398,015 | $ | 335,938 | ||||||
|
|
|
|
|
|
|
|||||||
| Average assets during the period |
665,290 | 402,191 | 241,573 | |||||||||
| Average UCITS ETF advisory fee during the period |
0.44 | % | 0.45 | % | 0.46 | % | ||||||
| Number of UCITS ETFs - end of period |
17 | 16 | 12 | |||||||||
| CANADIAN LISTED ETFs (in thousands) |
||||||||||||
| Beginning of period assets |
$ | 68,618 | $ | — | $ | — | ||||||
| Assets acquired |
77,403 | — | — | |||||||||
| Inflows/(outflows) |
127,057 | 68,534 | * | — | ||||||||
| Market appreciation/(depreciation) |
32,398 | 84 | — | |||||||||
|
|
|
|
|
|
|
|||||||
| End of period assets |
$ | 305,476 | $ | 68,618 | $ | — | ||||||
|
|
|
|
|
|
|
|||||||
| Average assets during the period |
203,426 | 67,640 | n/a | |||||||||
| Average ETF advisory fee during the period |
0.34 | % | 0.47 | % | n/a | |||||||
| Number of ETFs - end of period |
12 | 6 | n/a | |||||||||
| Headcount: U.S. Business Segment |
162 | 163 | 143 | |||||||||
| Headcount: International Business Segment |
42 | 46 | 34 | |||||||||
| * | ETF inception date is July 14, 2016 |
Note: Previously issued statistics may be restated due to trade adjustments
Source: Investment Company Institute, Bloomberg, WisdomTree
45
Year Ended December 31, 2017 Compared to Year Ended December 31, 2016
Selected Operating and Financial Information
| As of and for the Year Ended December 31, |
Change | Percent Change |
||||||||||||||
| 2017 | 2016 | |||||||||||||||
| Global AUM (in millions) |
||||||||||||||||
| End of period assets |
$ | 48,937 | $ | 41,257 | ||||||||||||
|
|
|
|
|
|||||||||||||
| U.S. listed AUM (in millions) |
||||||||||||||||
| Beginning of period assets |
$ | 40,164 | $ | 51,639 | ||||||||||||
| Assets acquired |
— | 225 | ||||||||||||||
| Net inflows/(outflows) |
234 | (12,557 | ) | |||||||||||||
| Market appreciation/(depreciation) |
6,429 | 857 | ||||||||||||||
|
|
|
|
|
|||||||||||||
| End of period assets |
$ | 46,827 | $ | 40,164 | ||||||||||||
|
|
|
|
|
|||||||||||||
| Financial Results (in thousands) |
||||||||||||||||
| Total revenues |
$ | 237,399 | $ | 219,446 | $ | 17,953 | 8.2 | % | ||||||||
| Total expenses |
179,207 | 163,884 | 15,323 | 9.3 | % | |||||||||||
|
|
|
|
|
|
|
|||||||||||
| Pre-tax income |
$ | 58,192 | $ | 55,562 | $ | 2,630 | 4.7 | % | ||||||||
| Net income |
$ | 27,199 | $ | 26,155 | $ | 1,044 | 4.0 | % | ||||||||
Overview – Global AUM (December 31, 2017 and December 31, 2016)
Our global AUM increased 18.6% from $41.3 billion at December 31, 2016 to $48.9 billion at December 31, 2017. This was primarily due to market appreciation of our U.S. listed ETFs, and to a lesser extent, net inflows into certain of our U.S. listed ETFs (including within our international equity, emerging markets, U.S. equity, fixed income and alternative strategy ETFs), European listed ETPs and Canadian listed ETFs. These increases were partly offset by outflows in our two largest ETFs, HEDJ and DXJ.
Overview – Year Ended December 31, 2017 and December 31, 2016
During the year ended December 31, 2017, our U.S. listed ETFs’ AUM increased 16.6% from $40.2 billion at December 31, 2016 to $46.8 billion at December 31, 2017. This increase was primarily driven by market appreciation, and to a lesser extent, net inflows. Our U.S. listed ETFs’ AUM decreased 22.2% during the year ended December 31, 2016, primarily due to net outflows from our two largest ETFs, HEDJ and DXJ.
We reported pre-tax income of $58.2 million for the year ended December 31, 2017, an increase of 4.7% from the year ended December 31, 2016 due to higher revenues which were partly offset by higher expenses. Net income was $27.2 million for the year ended December 31, 2017, an increase of 4.0% from the year ended December 31, 2016.
Revenues
| Year Ended December 31, |
Change | Percent Change |
||||||||||||||
| 2017 | 2016 | |||||||||||||||
| Global AUM (in millions) |
||||||||||||||||
| Global - Average AUM |
$ | 45,197 | $ | 42,032 | $ | 3,165 | 7.5 | % | ||||||||
|
|
|
|
|
|||||||||||||
| U.S. listed AUM (in millions) |
||||||||||||||||
| U.S. listed - Average AUM |
$ | 43,516 | $ | 41,012 | $ | 2,504 | 6.1 | % | ||||||||
| U.S. listed - Average ETF advisory fee |
0.50 | % | 0.51 | % | (0.01 | ) | (0.2 | %) | ||||||||
| Revenues (in thousands) |
||||||||||||||||
| Advisory fees |
$ | 227,775 | $ | 218,465 | $ | 9,310 | 4.3 | % | ||||||||
| Settlement gain |
6,909 | — | 6,909 | n/a | ||||||||||||
| Other income |
2,715 | 981 | 1,734 | 176.8 | % | |||||||||||
|
|
|
|
|
|
|
|||||||||||
| Total revenues |
$ | 237,399 | $ | 219,446 | $ | 17,953 | 8.2 | % | ||||||||
|
|
|
|
|
|
|
|||||||||||
46
Advisory fees
Advisory fee revenues increased 4.3% from $218.5 million for the year ended December 31, 2016 to $227.8 million for the year ended December 31, 2017 due to an increase in our average global AUM, partly offset by lower average U.S. advisory fees due to a change in product mix. Our average global AUM increased primarily due to market appreciation of our U.S. listed ETFs and net inflows into certain of our U.S. listed ETFs (including within our international equity, emerging markets, U.S. equity, fixed income and alternative strategy ETFs), European listed ETPs and Canadian listed ETFs. These increases were partly offset by outflows primarily in our two largest U.S. listed ETFs. The changes in product mix resulted in our average U.S. ETF advisory fee declining from 0.51% for the year ended December 31, 2016 to 0.50% for the year ended December 31, 2017.
Settlement gain
A settlement gain of $6.9 million was recorded during the year ended December 31, 2017 representing the fair value of the preferred stock of Thesys that we received in connection with the resolution of a dispute regarding our ownership stake in Thesys, which occurred in June 2017. See Note 9 to our Consolidated Financial Statements.
Other income
Other income increased $1.7 million from $1.0 million during the year ended December 31, 2016 to $2.7 million during the year ended December 31, 2017. Included in other income for the year ended December 31, 2017 was a one-time reimbursement of fund-related costs for prior years of $0.8 million. In addition, other income increased due to higher interest earned on our securities owned, at fair value.
Expenses
| (in thousands) |
Year Ended December 31, |
Change | Percent Change |
|||||||||||||
| 2017 | 2016 | |||||||||||||||
| Compensation and benefits |
$ | 81,493 | $ | 63,263 | $ | 18,230 | 28.8 | % | ||||||||
| Fund management and administration |
42,144 | 41,083 | 1,061 | 2.6 | % | |||||||||||
| Marketing and advertising |
14,402 | 15,643 | (1,241 | ) | (7.9 | %) | ||||||||||
| Sales and business development |
13,811 | 12,537 | 1,274 | 10.2 | % | |||||||||||
| Professional and consulting fees |
10,086 | 6,692 | 3,394 | 50.7 | % | |||||||||||
| Occupancy, communications and equipment |
5,415 | 5,211 | 204 | 3.9 | % | |||||||||||
| Depreciation and amortization |
1,395 | 1,305 | 90 | 6.9 | % | |||||||||||
| Third-party sharing arrangements |
3,393 | 2,827 | 566 | 20.0 | % | |||||||||||
| Goodwill impairment |
— | 1,676 | (1,676 | ) | n/a | |||||||||||
| Acquisition payment |
— | 6,738 | (6,738 | ) | n/a | |||||||||||
| Other |
7,068 | 6,909 | 159 | 2.3 | % | |||||||||||
|
|
|
|
|
|
|
|
|
|||||||||
| Total expenses |
$ | 179,207 | $ | 163,884 | $ | 15,323 | 9.3 | % | ||||||||
|
|
|
|
|
|
|
|
|
|||||||||
| As a Percent of Revenues: |
Year Ended December 31, |
|||||||
| 2017 | 2016 | |||||||
| Compensation and benefits |
34.3 | % | 28.8 | % | ||||
| Fund management and administration |
17.8 | % | 18.7 | % | ||||
| Marketing and advertising |
6.1 | % | 7.1 | % | ||||
| Sales and business development |
5.8 | % | 5.7 | % | ||||
| Professional and consulting fees |
4.2 | % | 3.0 | % | ||||
| Occupancy, communications and equipment |
2.3 | % | 2.5 | % | ||||
| Depreciation and amortization |
0.6 | % | 0.6 | % | ||||
| Third-party sharing arrangements |
1.4 | % | 1.3 | % | ||||
| Goodwill impairment |
n/a | 0.8 | % | |||||
| Acquisition payment |
n/a | 3.1 | % | |||||
| Other |
3.0 | % | 3.1 | % | ||||
|
|
|
|
|
|||||
| Total expenses |
75.5 | % | 74.7 | % | ||||
|
|
|
|
|
|||||
47
Compensation and benefits
Compensation and benefits expense increased 28.8% from $63.3 million during the year ended December 31, 2016 to $81.5 million during the year ended December 31, 2017 primarily due to higher accrued incentive compensation. The incentive compensation pool increased for compensation payable to our Chief Executive Officer, who opted not to accept any cash or equity bonus in the prior year. The pool was also increased to recognize the achievement of certain milestones involving several important strategic initiatives, as well as the addition of a key executive and average higher headcount. Headcount of our U.S. Business segment was 163 and our International Business segment was 46 at December 31, 2016 compared to 162 and 42, respectively, at December 31, 2017.
Fund management and administration
Fund management and administration expense increased 2.6% from $41.1 million during the year ended December 31, 2016 to $42.1 million during the year ended December 31, 2017. This increase was primarily due to higher average global AUM and the higher number of ETPs of our International Business segment, partly offset by a lower number of U.S. listed ETFs. We had 94 U.S. listed ETFs, 84 European ETPs and 6 Canadian listed ETFs at December 31, 2016 compared to 89 U.S. listed ETFs, 87 European ETPs and 12 Canadian listed ETFs at December 31, 2017.
Marketing and advertising
Marketing and advertising expense decreased 7.9% from $15.6 million during the year ended December 31, 2016 to $14.4 million during the year ended December 31, 2017 primarily due to lower levels of advertising related activities in our U.S. Business segment.
Sales and business development
Sales and business development expense increased 10.2% from $12.5 million during the year ended December 31, 2016 to $13.8 million during the year ended December 31, 2017 primarily due to sales related activities globally.
Professional and consulting fees
Professional and consulting fees increased 50.7% from $6.7 million during the year ended December 31, 2016 to $10.1 million during the year ended December 31, 2017 primarily due to $4.8 million of transaction costs incurred in connection with our agreement to acquire ETFS and securing an option to purchase the remaining equity interests in AdvisorEngine.
Occupancy, communications and equipment
Occupancy, communications and equipment expense was essentially unchanged from the year ended December 31, 2016.
Depreciation and amortization
Depreciation and amortization expense was essentially unchanged from the year ended December 31, 2016.
Third-party sharing arrangements
Third-party sharing arrangements expense increased 20.0% from $2.8 million during the year ended December 31, 2016 to $3.4 million during the year ended December 31, 2017 primarily due to higher fees paid to our third-party marketing agents in Latin America and Israel as well as the addition of a new distribution relationship, partly offset by lower spending on a third-party commission free brokerage platform in the U.S.
Goodwill impairment
A goodwill impairment charge of $1.7 million was recorded during the three months ended December 31, 2016, which was related to an interim impairment test performed on the goodwill recognized in connection with the acquisition of a majority stake in our European business in April 2014.
Acquisition payment
Acquisition payment expense was $6.7 million during the year ended December 31, 2016 as a result of the acceleration of the buyout of the remaining minority interest in our European business.
Other
Other expense was essentially unchanged from the year ended December 31, 2016.
48
Income tax expense
Our effective income tax rate for the year ended December 31, 2017 of 53.3% resulted in income tax expense of $31.0 million. Our tax rate differs from the federal statutory tax rate of 35% primarily due to a valuation allowance on foreign net operating losses, state and local income tax expense, $4.1 million of non-deductible transaction costs discussed above (increasing tax expense by $1.5 million) and $1.0 million of income tax expense associated with tax shortfalls recognized upon vesting of stock-based compensation awards during the year ended December 31, 2017. In addition, included within our effective income tax rate is a charge of $0.5 million to remeasure our net DTAs in connection with recent U.S. tax reform. We were required to remeasure our DTAs using the newly enacted federal corporate income tax rate at date of enactment. This reduced the carrying value of our DTAs and increased tax expense.
Our effective income tax rate for the year ended December 31, 2016 was 52.9%, which resulted in income tax expense of $29.4 million. Our tax rate differed from the federal statutory rate of 35% primarily due to a valuation allowance on our foreign net operating losses, the acquisition payment expense and goodwill impairment charge (both of which are non-deductible) and state and local income taxes.
Year Ended December 31, 2016 Compared to Year Ended December 31, 2015
Overview
| As of and for the Year Ended December 31, |
Change | Percent Change |
||||||||||||||
| 2016 | 2015 | |||||||||||||||
| Global AUM (in millions) |
||||||||||||||||
| End of period assets |
$ | 41,257 | $ | 52,413 | ||||||||||||
|
|
|
|
|
|||||||||||||
| U.S. listed AUM (in millions) |
||||||||||||||||
| Beginning of period assets |
$ | 51,639 | $ | 39,281 | ||||||||||||
| Assets acquired |
225 | — | ||||||||||||||
| Net inflows/(outflows) |
(12,557 | ) | 16,856 | |||||||||||||
| Market appreciation/(depreciation) |
857 | (4,498 | ) | |||||||||||||
|
|
|
|
|
|||||||||||||
| End of period assets |
$ | 40,164 | $ | 51,639 | ||||||||||||
|
|
|
|
|
|||||||||||||
| Financial Results (in thousands) |
||||||||||||||||
| Total revenues |
$ | 219,446 | $ | 298,942 | $ | (79,496 | ) | (26.6 | %) | |||||||
| Total expenses |
163,884 | 161,757 | 2,127 | 1.3 | % | |||||||||||
|
|
|
|
|
|
|
|||||||||||
| Pre-tax income |
$ | 55,562 | $ | 137,185 | $ | (81,623 | ) | (59.5 | %) | |||||||
| Net income |
$ | 26,155 | $ | 80,052 | $ | (53,897 | ) | (67.3 | %) | |||||||
Overview – Global AUM (December 31, 2016 and December 31, 2015)
Our global AUM decreased 21.3% from $52.4 billion at December 31, 2015 to $41.3 billion at December 31, 2016. This was primarily due to net outflows from our two largest ETFs, HEDJ and DXJ, as well as outflows from our international equity, fixed income and emerging markets ETFs. These decreases were partly offset by market appreciation and net inflows into our U.S. equity ETFs, European listed ETPs and Canadian listed ETFs.
Overview – Year Ended December 31, 2016 and December 31, 2015
During the year ended December 31, 2016, our U.S. listed ETFs’ AUM decreased 22.2% from $51.6 billion at December 31, 2015 to $40.2 billion at December 31, 2016. This decrease was primarily due to net outflows from our two largest ETFs, HEDJ and DXJ, as well as outflows from our international equity, fixed income and emerging markets ETFs. These decreases were partly offset by inflows into our U.S. equity ETFs and market appreciation. Our U.S. listed ETFs’ AUM increased 31.5% during the year ended December 31, 2015, primarily due to net inflows into our two largest ETFs, HEDJ and DXJ, partly offset by outflows from our emerging markets ETFs and market depreciation.
We reported pre-tax income of $55.6 million for the year ended December 31, 2016, a decrease of 59.5% from the year ended December 31, 2015 primarily due to lower revenues. Net income was $26.2 million for the year ended December 31, 2016, a decrease of 67.3% from the year ended December 31, 2015.
49
Revenues
| Year Ended December 31, |
Change | Percent Change |
||||||||||||||
| 2016 | 2015 | |||||||||||||||
| Global AUM (in millions) |
||||||||||||||||
| Global - Average AUM |
$ | 42,032 | $ | 56,531 | $ | (14,499 | ) | (25.6 | %) | |||||||
|
|
|
|
|
|||||||||||||
| U.S. listed AUM (in millions) |
||||||||||||||||
| U.S. listed - Average AUM |
$ | 41,012 | $ | 55,930 | $ | (14,918 | ) | (26.7 | %) | |||||||
| U.S. listed - Average ETF advisory fee |
0.51 | % | 0.53 | % | (0.02 | ) | (3.8 | %) | ||||||||
| Revenues (in thousands) |
||||||||||||||||
| Advisory fees |
$ | 218,465 | $ | 297,944 | $ | (79,479 | ) | (26.7 | %) | |||||||
| Other income |
981 | 998 | (17 | ) | (1.7 | %) | ||||||||||
|
|
|
|
|
|
|
|||||||||||
| Total revenues |
$ | 219,446 | $ | 298,942 | $ | (79,496 | ) | (26.6 | %) | |||||||
|
|
|
|
|
|
|
|||||||||||
Advisory fees
Advisory fee revenues decreased 26.7% from $297.9 million during the year ended December 31, 2015 to $218.5 million during the year ended December 31, 2016 due to lower average AUM primarily resulting from net outflows from our two largest U.S. listed ETFs – our currency hedged European and Japan equity ETFs (HEDJ and DXJ, respectively). Our average U.S. advisory fee decreased to 0.51% from 0.53% during the year due to changes in product mix.
Other income
Other income was essentially unchanged from 2015 to 2016.
Expenses
| (in thousands) |
Year Ended December 31, |
Change | Percent Change |
|||||||||||||
| 2016 | 2015 | |||||||||||||||
| Compensation and benefits |
$ | 63,263 | $ | 73,228 | $ | (9,965 | ) | (13.6 | %) | |||||||
| Fund management and administration |
41,083 | 42,782 | (1,699 | ) | (4.0 | %) | ||||||||||
| Marketing and advertising |
15,643 | 13,371 | 2,272 | 17.0 | % | |||||||||||
| Sales and business development |
12,537 | 9,189 | 3,348 | 36.4 | % | |||||||||||
| Professional and consulting fees |
6,692 | 7,067 | (375 | ) | (5.3 | %) | ||||||||||
| Occupancy, communications and equipment |
5,211 | 4,299 | 912 | 21.2 | % | |||||||||||
| Depreciation and amortization |
1,305 | 1,006 | 299 | 29.7 | % | |||||||||||
| Third-party sharing arrangements |
2,827 | 2,443 | 384 | 15.7 | % | |||||||||||
| Goodwill impairment |
1,676 | — | 1,676 | n/a | ||||||||||||
| Acquisition payment |
6,738 | 2,185 | 4,553 | 208.4 | % | |||||||||||
| Other |
6,909 | 6,187 | 722 | 11.7 | % | |||||||||||
|
|
|
|
|
|
|
|
|
|||||||||
| Total expenses |
$ | 163,884 | $ | 161,757 | $ | 2,127 | 1.3 | % | ||||||||
|
|
|
|
|
|
|
|
|
|||||||||
| Year Ended December 31, |
||||||||
| As a Percent of Revenues: |
2016 | 2015 | ||||||
| Compensation and benefits |
28.8 | % | 24.5 | % | ||||
| Fund management and administration |
18.7 | % | 14.3 | % | ||||
| Marketing and advertising |
7.1 | % | 4.5 | % | ||||
| Sales and business development |
5.7 | % | 3.1 | % | ||||
| Professional and consulting fees |
3.0 | % | 2.4 | % | ||||
| Occupancy, communications and equipment |
2.5 | % | 1.4 | % | ||||
| Depreciation and amortization |
0.6 | % | 0.3 | % | ||||
| Third-party sharing arrangements |
1.3 | % | 0.8 | % | ||||
| Goodwill impairment |
0.8 | % | — | |||||
| Acquisition payment |
3.1 | % | 0.7 | % | ||||
| Other |
3.1 | % | 2.1 | % | ||||
|
|
|
|
|
|||||
| Total expenses |
74.7 | % | 54.1 | % | ||||
|
|
|
|
|
|||||
50
Compensation and benefits
Compensation and benefits expense decreased 13.6% from $73.2 million during the year ended December 31, 2015 to $63.3 million during the year ended December 31, 2016 due to a significant decline in accrued incentive compensation as a result of net outflows we experienced in 2016 partly offset by higher headcount related expenses and higher stock-based compensation due to equity awards we granted as part of 2015 incentive compensation. Headcount of our U.S. Business segment was 143 and our International Business segment was 34 at the end of 2015 compared to 163 and 46, respectively, at the end of 2016.
Fund management and administration
Fund management and administration expense decreased 4.0% from $42.8 million during the year ended December 31, 2015 to $41.1 million during the year ended December 31, 2016. This decrease was primarily due to lower fund costs for our U.S. listed ETFs as a result of lower average AUM partly offset by higher costs for additional fund launches by our U.S., European and Canadian businesses. We had 86 U.S. listed ETFs and 76 European listed products at the end of 2015 compared to 94 U.S. listed ETFs, 84 European listed products and six Canadian listed ETFs at the end of 2016.
Marketing and advertising
Marketing and advertising expense increased 17.0% from $13.4 million during the year ended December 31, 2015 to $15.6 million during the year ended December 31, 2016 primarily due to higher levels of advertising related activities.
Sales and business development
Sales and business development expense increased 36.4% from $9.2 million during the year ended December 31, 2015 to $12.5 million during the year ended December 31, 2016 primarily due to higher spending on sales related activities.
Professional and consulting fees
Professional and consulting fees decreased 5.3% from $7.1 million during the year ended December 31, 2015 to $6.7 million during the year ended December 31, 2016. This decrease was primarily due to lower fees for strategic consulting services and lower recruiting fees partly offset by fees associated with our office in Canada that we established in April 2016.
Occupancy, communications and equipment
Occupancy, communications and equipment expense increased 21.2% from $4.3 million during the year ended December 31, 2015 to $5.2 million during the year ended December 31, 2016 primarily due to technology initiatives and higher costs for our office space in Japan which was opened in the second quarter of 2015.
Depreciation and amortization
Depreciation and amortization expense increased 29.7% from $1.0 million during the year ended December 31, 2015 to $1.3 million during the year ended December 31, 2016 primarily due to expenses of our Japan office that we opened in the second quarter of 2015 and higher amortization for leasehold improvements to our New York office space.
Third-party sharing arrangements
Third-party sharing arrangements expense increased 15.7% from $2.4 million during the year ended December 31, 2015 to $2.8 million during the year ended December 31, 2016 primarily due to fees we pay to include our ETFs on third-party platforms and higher fees to our marketing agent in Latin America.
51
Goodwill impairment
A goodwill impairment charge of $1.7 million was recorded during the three months ended December 31, 2016, which was related to an interim impairment test performed on the goodwill recognized in connection with the acquisition of a majority stake in our European business in April 2014.
Acquisition payment
Acquisition payment expense increased 208.4% from $2.2 million during the year ended December 31, 2015 to $6.7 million during the year ended December 31, 2016 as a result of the acceleration of the buyout of the remaining minority interest in our European business.
Other
Other expenses increased 11.7% from $6.2 million during the year ended December 31, 2015 to $6.9 million during the year ended December 31, 2016 primarily due to expenses of our Japan office that we opened in the second quarter of 2015 and increases other general and administrative expenses.
Income tax expense
Our effective income tax rate for the year ended December 31, 2016 was 52.9%, which resulted in income tax expense of $29.4 million. Our tax rate differed from the federal statutory rate of 35% primarily due to a valuation allowance on our foreign net operating losses, the acquisition payment expense and goodwill impairment charge (both of which are non-deductible) and state and local income taxes.
Our effective income tax rate for the year ended December 31, 2015 was 41.6%, which resulted in income tax expense of $57.1 million. Our tax rate differed from the federal statutory rate of 35% primarily due to state and local income taxes, foreign net operating losses and the acquisition payment expense (which is non-deductible).
52
Quarterly Results
The following tables set forth our unaudited consolidated quarterly statement of operations data, both in dollar amounts and as a percentage of total revenues, and our unaudited consolidated quarterly operating data for the quarters in 2016 and 2017. In our opinion, this unaudited information has been prepared on substantially the same basis as the consolidated financial statements appearing elsewhere in this Report and includes all adjustments (consisting of normal recurring adjustments) necessary for a fair statement of the unaudited consolidated quarterly data. The unaudited consolidated quarterly data should be read together with the consolidated financial statements and related notes included elsewhere in this Report. The results for any quarter are not necessarily indicative of results for any future period, and you should not rely on them as such.
| (in thousands, except per share amounts) | Q1/16 | Q2/16 | Q3/16 | Q4/16 | Q1/17 | Q2/17 | Q3/17 | Q4/17 | ||||||||||||||||||||||||
| Revenues |
||||||||||||||||||||||||||||||||
| Advisory fees |
$ | 60,615 | $ | 55,931 | $ | 51,553 | $ | 50,366 | $ | 53,262 | $ | 56,114 | $ | 57,574 | $ | 60,825 | ||||||||||||||||
| Settlement gain |
— | — | — | — | — | 6,909 | — | — | ||||||||||||||||||||||||
| Other income |
263 | 50 | 236 | 432 | 1,337 | 405 | 412 | 561 | ||||||||||||||||||||||||
|
|
|
|
|
|
|
|
|
|
|
|
|
|
|
|
|
|||||||||||||||||
| Total revenues |
60,878 | 55,981 | 51,789 | 50,798 | 54,599 | 63,428 | 57,986 | 61,386 | ||||||||||||||||||||||||
| Expenses |
||||||||||||||||||||||||||||||||
| Compensation and benefits |
15,226 | 14,343 | 15,328 | 18,366 | 17,874 | 18,421 | 19,492 | 25,706 | ||||||||||||||||||||||||
| Fund management and administration |
10,044 | 10,621 | 10,372 | 10,046 | 9,600 | 10,112 | 10,862 | 11,570 | ||||||||||||||||||||||||
| Marketing and advertising |
3,832 | 4,566 | 3,600 | 3,645 | 3,537 | 3,825 | 3,314 | 3,726 | ||||||||||||||||||||||||
| Sales and business development |
2,447 | 3,834 | 3,075 | 3,181 | 2,962 | 3,389 | 3,617 | 3,843 | ||||||||||||||||||||||||
| Professional and consulting fees |
2,835 | 1,365 | 1,035 | 1,457 | 1,558 | 1,221 | 1,035 | 6,272 | ||||||||||||||||||||||||
| Occupancy, communications and equipment |
1,222 | 1,241 | 1,469 | 1,279 | 1,353 | 1,371 | 1,378 | 1,313 | ||||||||||||||||||||||||
| Depreciation and amortization |
316 | 330 | 332 | 327 | 337 | 352 | 353 | 353 | ||||||||||||||||||||||||
| Third-party sharing arrangements |
907 | 709 | 622 | 589 | 932 | 670 | 710 | 1,081 | ||||||||||||||||||||||||
| Goodwill impairment |
— | — | — | 1,676 | — | — | — | — | ||||||||||||||||||||||||
| Acquisition payment |
745 | 5,993 | — | — | — | — | — | — | ||||||||||||||||||||||||
| Other |
1,632 | 1,823 | 1,731 | 1,723 | 1,624 | 1,842 | 1,729 | 1,873 | ||||||||||||||||||||||||
|
|
|
|
|
|
|
|
|
|
|
|
|
|
|
|
|
|||||||||||||||||
| Total expenses |
39,206 | 44,825 | 37,564 | 42,289 | 39,777 | 41,203 | 42,490 | 55,737 | ||||||||||||||||||||||||
|
|
|
|
|
|
|
|
|
|
|
|
|
|
|
|
|
|||||||||||||||||
| Income before taxes |
21,672 | 11,156 | 14,225 | 8,509 | 14,822 | 22,225 | 15,496 | 5,649 | ||||||||||||||||||||||||
| Income tax expense |
9,600 | 7,505 | 6,270 | 6,032 | 7,942 | 10,120 | 7,520 | 5,411 | ||||||||||||||||||||||||
|
|
|
|
|
|
|
|
|
|
|
|
|
|
|
|
|
|||||||||||||||||
| Net income |
$ | 12,072 | $ | 3,651 | $ | 7,955 | $ | 2,477 | $ | 6,880 | $ | 12,105 | $ | 7,976 | $ | 238 | ||||||||||||||||
|
|
|
|
|
|
|
|
|
|
|
|
|
|
|
|
|
|||||||||||||||||
| Net income per share - basic |
$ | 0.09 | $ | 0.03 | $ | 0.06 | $ | 0.02 | $ | 0.05 | $ | 0.09 | $ | 0.06 | $ | 0.00 | ||||||||||||||||
|
|
|
|
|
|
|
|
|
|
|
|
|
|
|
|
|
|||||||||||||||||
| Net income per share - diluted |
$ | 0.09 | $ | 0.03 | $ | 0.06 | $ | 0.02 | $ | 0.05 | $ | 0.09 | $ | 0.06 | $ | 0.00 | ||||||||||||||||
|
|
|
|
|
|
|
|
|
|
|
|
|
|
|
|
|
|||||||||||||||||
| Dividends per common share |
$ | 0.08 | $ | 0.08 | $ | 0.08 | $ | 0.08 | $ | 0.08 | $ | 0.08 | $ | 0.08 | $ | 0.08 | ||||||||||||||||
|
|
|
|
|
|
|
|
|
|
|
|
|
|
|
|
|
|||||||||||||||||
53
| Q1/16 | Q2/16 | Q3/16 | Q4/16 | Q1/17 | Q2/17 | Q3/17 | Q4/17 | |||||||||||||||||||||||||
| Percent of Revenues |
||||||||||||||||||||||||||||||||
| Revenues |
||||||||||||||||||||||||||||||||
| Advisory fees |
99.6 | % | 99.9 | % | 99.5 | % | 99.1 | % | 97.6 | % | 88.5 | % | 99.3 | % | 99.1 | % | ||||||||||||||||
| Settlement gain |
0.0 | % | 0.0 | % | 0.0 | % | 0.0 | % | 0.0 | % | 10.9 | % | 0.0 | % | 0.0 | % | ||||||||||||||||
| Other income |
0.4 | % | 0.1 | % | 0.5 | % | 0.9 | % | 2.4 | % | 0.6 | % | 0.7 | % | 0.9 | % | ||||||||||||||||
|
|
|
|
|
|
|
|
|
|
|
|
|
|
|
|
|
|||||||||||||||||
| Total revenues |
100.0 | % | 100.0 | % | 100.0 | % | 100.0 | % | 100.0 | % | 100.0 | % | 100.0 | % | 100.0 | % | ||||||||||||||||
| Expenses |
||||||||||||||||||||||||||||||||
| Compensation and benefits |
25.0 | % | 25.6 | % | 29.6 | % | 36.2 | % | 32.7 | % | 29.0 | % | 33.6 | % | 41.9 | % | ||||||||||||||||
| Fund management and administration |
16.5 | % | 19.0 | % | 20.0 | % | 19.8 | % | 17.6 | % | 16.0 | % | 18.7 | % | 18.9 | % | ||||||||||||||||
| Marketing and advertising |
6.3 | % | 8.2 | % | 7.0 | % | 7.2 | % | 6.5 | % | 6.0 | % | 5.7 | % | 6.1 | % | ||||||||||||||||
| Sales and business development |
4.0 | % | 6.8 | % | 5.9 | % | 6.2 | % | 5.4 | % | 5.3 | % | 6.3 | % | 6.2 | % | ||||||||||||||||
| Professional and consulting fees |
4.7 | % | 2.4 | % | 2.0 | % | 2.9 | % | 2.9 | % | 1.9 | % | 1.8 | % | 10.2 | % | ||||||||||||||||
| Occupancy, communications and equipment |
2.0 | % | 2.2 | % | 2.8 | % | 2.5 | % | 2.5 | % | 2.2 | % | 2.4 | % | 2.1 | % | ||||||||||||||||
| Depreciation and amortization |
0.5 | % | 0.6 | % | 0.7 | % | 0.6 | % | 0.6 | % | 0.6 | % | 0.6 | % | 0.6 | % | ||||||||||||||||
| Third-party sharing arrangements |
1.5 | % | 1.3 | % | 1.2 | % | 1.1 | % | 1.7 | % | 1.1 | % | 1.2 | % | 1.8 | % | ||||||||||||||||
| Goodwill impairment |
0.0 | % | 0.0 | % | 0.0 | % | 3.3 | % | 0.0 | % | 0.0 | % | 0.0 | % | 0.0 | % | ||||||||||||||||
| Acquisition payment |
1.2 | % | 10.7 | % | 0.0 | % | 0.0 | % | 0.0 | % | 0.0 | % | 0.0 | % | 0.0 | % | ||||||||||||||||
| Other |
2.7 | % | 3.3 | % | 3.3 | % | 3.4 | % | 3.0 | % | 2.9 | % | 3.0 | % | 3.0 | % | ||||||||||||||||
|
|
|
|
|
|
|
|
|
|
|
|
|
|
|
|
|
|||||||||||||||||
| Total expenses |
64.4 | % | 80.1 | % | 72.5 | % | 83.2 | % | 72.9 | % | 65.0 | % | 73.3 | % | 90.8 | % | ||||||||||||||||
|
|
|
|
|
|
|
|
|
|
|
|
|
|
|
|
|
|||||||||||||||||
| Income before taxes |
35.6 | % | 19.9 | % | 27.5 | % | 16.8 | % | 27.1 | % | 35.0 | % | 26.7 | % | 9.2 | % | ||||||||||||||||
| Income tax expense |
15.8 | % | 13.4 | % | 12.1 | % | 11.9 | % | 14.5 | % | 15.9 | % | 12.9 | % | 8.8 | % | ||||||||||||||||
|
|
|
|
|
|
|
|
|
|
|
|
|
|
|
|
|
|||||||||||||||||
| Net income |
19.8 | % | 6.5 | % | 15.4 | % | 4.9 | % | 12.6 | % | 19.1 | % | 13.8 | % | 0.4 | % | ||||||||||||||||
|
|
|
|
|
|
|
|
|
|
|
|
|
|
|
|
|
|||||||||||||||||
54
| Q1/16 | Q2/16 | Q3/16 | Q4/16 | Q1/17 | Q2/17 | Q3/17 | Q4/17 | |||||||||||||||||||||||||
| Operating Statistics |
||||||||||||||||||||||||||||||||
| U.S. LISTED ETFs (in millions) |
||||||||||||||||||||||||||||||||
| Beginning of period assets |
$ | 51,639 | $ | 44,256 | $ | 38,046 | $ | 37,704 | $ | 40,164 | $ | 41,940 | $ | 43,183 | $ | 44,398 | ||||||||||||||||
| Assets acquired |
225 | — | — | — | — | — | — | — | ||||||||||||||||||||||||
| Inflows/(outflows) |
(5,359 | ) | (4,949 | ) | (2,381 | ) | 132 | (58 | ) | 605 | (619 | ) | 306 | |||||||||||||||||||
| Market appreciation/(depreciation) |
(2,249 | ) | (1,261 | ) | 2,039 | 2,328 | 1,834 | 638 | 1,834 | 2,123 | ||||||||||||||||||||||
|
|
|
|
|
|
|
|
|
|
|
|
|
|
|
|
|
|||||||||||||||||
| End of period assets |
$ | 44,256 | $ | 38,046 | $ | 37,704 | $ | 40,164 | $ | 41,940 | $ | 43,183 | $ | 44,398 | $ | 46,827 | ||||||||||||||||
|
|
|
|
|
|
|
|
|
|
|
|
|
|
|
|
|
|||||||||||||||||
| Average assets during the period |
$ | 45,475 | $ | 41,681 | $ | 38,710 | $ | 38,253 | $ | 41,292 | $ | 42,961 | $ | 43,523 | $ | 46,030 | ||||||||||||||||
| Number of ETFs – end of the period |
93 | 99 | 93 | 94 | 88 | 90 | 87 | 89 | ||||||||||||||||||||||||
| ETF Industry and Market Share (in billions) |
||||||||||||||||||||||||||||||||
| ETF industry net inflows |
$ | 34.6 | $ | 30.8 | $ | 91.3 | $ | 127.2 | $ | 133.9 | $ | 112.0 | $ | 87.7 | $ | 138.3 | ||||||||||||||||
| WisdomTree market share of industry inflows |
n/a | n/a | n/a | 0.1 | % | n/a | 0.1 | % | n/a | 0.2 | % | |||||||||||||||||||||
| Average ETF advisory fee during the period |
||||||||||||||||||||||||||||||||
| Alternative strategy ETFs |
0.88 | % | 0.87 | % | 0.78 | % | 0.72 | % | 0.66 | % | 0.60 | % | 0.57 | % | 0.55 | % | ||||||||||||||||
| Emerging markets equity ETFs |
0.71 | % | 0.71 | % | 0.71 | % | 0.70 | % | 0.70 | % | 0.70 | % | 0.70 | % | 0.69 | % | ||||||||||||||||
| International developed equity ETFs |
0.56 | % | 0.56 | % | 0.56 | % | 0.56 | % | 0.56 | % | 0.56 | % | 0.55 | % | 0.55 | % | ||||||||||||||||
| International hedged equity ETFs |
0.54 | % | 0.54 | % | 0.54 | % | 0.54 | % | 0.53 | % | 0.53 | % | 0.53 | % | 0.53 | % | ||||||||||||||||
| Currency ETFs |
0.50 | % | 0.50 | % | 0.50 | % | 0.50 | % | 0.50 | % | 0.50 | % | 0.50 | % | 0.50 | % | ||||||||||||||||
| Fixed income ETFs |
0.49 | % | 0.48 | % | 0.47 | % | 0.43 | % | 0.42 | % | 0.42 | % | 0.40 | % | 0.37 | % | ||||||||||||||||
| U.S. equity ETFs |
0.35 | % | 0.35 | % | 0.35 | % | 0.35 | % | 0.35 | % | 0.35 | % | 0.35 | % | 0.35 | % | ||||||||||||||||
|
|
|
|
|
|
|
|
|
|
|
|
|
|
|
|
|
|||||||||||||||||
| Total |
0.52 | % | 0.52 | % | 0.51 | % | 0.50 | % | 0.50 | % | 0.50 | % | 0.50 | % | 0.50 | % | ||||||||||||||||
|
|
|
|
|
|
|
|
|
|
|
|
|
|
|
|
|
|||||||||||||||||
| EUROPEAN LISTED ETPs |
||||||||||||||||||||||||||||||||
| Total ETPs (in thousands) |
||||||||||||||||||||||||||||||||
| Beginning of period assets |
$ | 437,934 | $ | 488,069 | $ | 560,063 | $ | 647,497 | $ | 626,280 | $ | 774,487 | $ | 812,604 | $ | 979,608 | ||||||||||||||||
| Inflows/(outflows) |
123,461 | 20,578 | 92,045 | (38,214 | ) | 160,327 | 102,783 | 129,742 | (102,453 | ) | ||||||||||||||||||||||
| Market appreciation/(depreciation) |
(73,326 | ) | 51,416 | (4,611 | ) | 16,997 | (12,120 | ) | (64,666 | ) | 37,262 | 55,798 | ||||||||||||||||||||
|
|
|
|
|
|
|
|
|
|
|
|
|
|
|
|
|
|||||||||||||||||
| End of period assets |
$ | 488,069 | $ | 560,063 | $ | 647,497 | $ | 626,280 | $ | 774,487 | $ | 812,604 | $ | 979,608 | $ | 932,953 | ||||||||||||||||
|
|
|
|
|
|
|
|
|
|
|
|
|
|
|
|
|
|||||||||||||||||
| Average assets during the period |
428,857 | 544,676 | 575,248 | 640,101 | 704,843 | 735,295 | 870,773 | 933,975 | ||||||||||||||||||||||||
| Average ETP advisory fee during the period |
0.84 | % | 0.84 | % | 0.82 | % | 0.80 | % | 0.79 | % | 0.78 | % | 0.77 | % | 0.77 | % | ||||||||||||||||
| Number of ETPs – end of the period |
67 | 67 | 67 | 68 | 68 | 68 | 68 | 70 | ||||||||||||||||||||||||
| Total UCITS ETFs (in thousands) |
||||||||||||||||||||||||||||||||
| Beginning of period assets |
$ | 335,938 | $ | 396,901 | $ | 391,900 | $ | 371,307 | $ | 398,015 | $ | 576,503 | $ | 643,199 | $ | 785,899 | ||||||||||||||||
| Inflows/(outflows) |
71,440 | 26,931 | (58,908 | ) | 12,442 | 159,774 | 44,022 | 99,546 | 36,711 | |||||||||||||||||||||||
| Market appreciation/(depreciation) |
(10,477 | ) | (31,932 | ) | 38,315 | 14,266 | 18,714 | 22,674 | 43,154 | 48,592 | ||||||||||||||||||||||
|
|
|
|
|
|
|
|
|
|
|
|
|
|
|
|
|
|||||||||||||||||
| End of period assets |
$ | 396,901 | $ | 391,900 | $ | 371,307 | $ | 398,015 | $ | 576,503 | $ | 643,199 | $ | 785,899 | $ | 871,202 | ||||||||||||||||
|
|
|
|
|
|
|
|
|
|
|
|
|
|
|
|
|
|||||||||||||||||
| Average assets during the period |
356,814 | 400,047 | 437,767 | 375,286 | 504,294 | 626,177 | 692,666 | 830,637 | ||||||||||||||||||||||||
| Average UCITS ETF advisory fee during the period |
0.47 | % | 0.46 | % | 0.44 | % | 0.42 | % | 0.43 | % | 0.44 | % | 0.44 | % | 0.44 | % | ||||||||||||||||
| Number of UCITS ETFs – end of the period |
12 | 16 | 16 | 16 | 17 | 17 | 17 | 17 | ||||||||||||||||||||||||
| CANADIAN LISTED ETFs |
||||||||||||||||||||||||||||||||
| Total ETFs (in thousands) |
||||||||||||||||||||||||||||||||
| Beginning of period assets |
$ | — | $ | — | $ | — | $ | 68,427 | $ | 68,618 | $ | 72,927 | $ | 91,490 | $ | 205,469 | ||||||||||||||||
| Assets acquired |
— | — | — | — | — | — | — | 77,403 | ||||||||||||||||||||||||
| Inflows/(outflows) |
— | — | 68,531 | (1) | 3 | (2 | ) | 15,280 | 96,745 | 15,034 | ||||||||||||||||||||||
| Market appreciation/(depreciation) |
— | — | (104 | ) | 188 | 4,311 | 3,283 | 17,234 | 7,570 | |||||||||||||||||||||||
|
|
|
|
|
|
|
|
|
|
|
|
|
|
|
|
|
|||||||||||||||||
| End of period assets |
$ | — | $ | — | $ | 68,427 | $ | 68,618 | $ | 72,927 | $ | 91,490 | $ | 205,469 | $ | 305,476 | ||||||||||||||||
|
|
|
|
|
|
|
|
|
|
|
|
|
|
|
|
|
|||||||||||||||||
| Average assets during the period |
n/a | n/a | 68,177 | 67,168 | 71,234 | 84,879 | 129,284 | 270,901 | ||||||||||||||||||||||||
| Average ETF advisory fee during the period |
n/a | n/a | 0.47 | % | 0.46 | % | 0.46 | % | 0.42 | % | 0.28 | %(2) | 0.30 | %(2) | ||||||||||||||||||
| Number of ETFs – end of the period |
n/a | n/a | 6 | 6 | 6 | 8 | 11 | 12 | ||||||||||||||||||||||||
| Headcount – U.S. Business segment |
153 | 157 | 159 | 163 | 163 | 166 | 165 | 162 | ||||||||||||||||||||||||
| Headcount – International segment |
38 | 47 | 43 | 46 | 47 | 46 | 43 | 42 | ||||||||||||||||||||||||
| (1) | ETF inception date is July 14, 2016. |
| (2) | Average ETF advisory fee for our Canadian listed ETFs declined from 0.42% at June 30, 2017 to 0.30% and 0.28% at December 31, 2017 and September 30, 2017, respectively, due to management fee rebates provided to initial seed capital providers. |
55
Segment Results
The table below presents the net revenues, operating expenses and income before taxes of our U.S. Business and International Business reportable segments.
| Year Ended December 31, | ||||||||||||
| 2017 | 2016 | 2015 | ||||||||||
| (in thousands) | ||||||||||||
| U.S. Business segment |
||||||||||||
| Revenues |
$ | 226,879 | $ | 212,490 | $ | 294,719 | ||||||
| Operating expenses |
(156,342 | ) | (137,769 | ) | (148,384 | ) | ||||||
|
|
|
|
|
|
|
|||||||
| Income before taxes |
$ | 70,537 | $ | 74,721 | $ | 146,335 | ||||||
|
|
|
|
|
|
|
|||||||
| Average assets during the period (in millions) |
$ | 43,516 | $ | 41,012 | $ | 55,930 | ||||||
| Average advisory fee during the period |
0.50 | % | 0.51 | % | 0.53 | % | ||||||
| International Business segment |
||||||||||||
| Revenues |
$ | 10,520 | $ | 6,956 | $ | 4,223 | ||||||
| Operating expenses |
(22,865 | ) | (26,115 | ) | (13,373 | ) | ||||||
|
|
|
|
|
|
|
|||||||
| Income before taxes |
$ | (12,345 | ) | $ | (19,159 | ) | $ | (9,150 | ) | |||
|
|
|
|
|
|
|
|||||||
| European ETPs – Average assets during the period (in millions) |
$ | 812 | $ | 551 | $ | 359 | ||||||
| UCITS ETFs – Average asset during the period (in millions) |
$ | 665 | $ | 402 | $ | 242 | ||||||
| Canadian ETFs – Average asset during the period (in millions) |
$ | 203 | $ | 68 | $ | n/a | ||||||
| European ETPs – Average advisory fee during the period |
0.78 | % | 0.82 | % | 0.83 | % | ||||||
| UCITS ETFs – Average advisory fee during the period |
0.44 | % | 0.45 | % | 0.46 | % | ||||||
| Canadian ETFs – Average advisory fee during the period |
0.34 | % | 0.47 | % | n/a | |||||||
| Totals |
||||||||||||
| Revenues |
$ | 237,399 | $ | 219,446 | $ | 298,942 | ||||||
| Operating expenses |
(179,207 | ) | (163,884 | ) | (161,757 | ) | ||||||
|
|
|
|
|
|
|
|||||||
| Income before taxes |
$ | 58,192 | $ | 55,562 | $ | 137,185 | ||||||
|
|
|
|
|
|
|
|||||||
Year Ended December 31, 2017 Compared to Year Ended December 31, 2016
U.S. Business segment
Revenues of the U.S. Business segment increased 6.8% from $212.5 million during the year ended December 31, 2016 to $226.9 million during the year ended December 31, 2017. Included in revenues during the year ended December 31, 2017 was a settlement gain of $6.9 million. In addition, revenues increased as compared to the prior year due to higher advisory fee revenue on higher average AUM (partly offset by a decline in our U.S. ETF advisory fee) and an increase in interest income on our securities owned, at fair value. Our average U.S. ETF advisory fee declined from 0.51% for year ended December 31, 2016 to 0.50% for the year ended December 31, 2017 due to changes in product mix.
Operating expenses of the U.S. Business segment increased 13.5% from $137.8 million during the year ended December 31, 2016 to $156.3 million during the year ended December 31, 2017. Included within operating expenses were $4.8 million of professional fees incurred in connection with our agreement to acquire ETFS, and to a lesser extent, professional fees associated with securing an option to purchase the remaining equity interests in AdvisorEngine. In addition, compensation expense increased due to higher accrued incentive compensation. The incentive compensation pool increased for compensation payable to our Chief Executive Officer, who opted not to accept any cash or equity bonus in the prior year. The pool was also increased to recognize the achievement of certain milestones involving several important strategic initiatives, as well as the addition of a key executive and average higher headcount. These increases were partly offset by lower marketing expenses.
International Business segment
Revenues of the International Business segment increased 51.2% from $7.0 million during the year ended December 31, 2016 to $10.5 million during the year ended December 31, 2017. This increase was attributable to higher average AUM which increased 64.5% from $1.0 billion during the year ended December 31, 2016 to $1.7 billion during the year ended December 31, 2017 primarily due to net inflows, and to a lesser extent market appreciation.
56
Operating expenses of the International Business segment decreased 12.4% from $26.1 million during the year ended December 31, 2016 to $22.9 million during the year ended December 31, 2017. Included in operating expenses for the year ended December 31, 2016 was acquisition payment expense of $6.7 million associated with the acceleration of the buyout of the remaining minority interest in our European business during the second quarter of 2016 and a goodwill impairment charge of $1.7 million. Partly offsetting these items was an increase in compensation expense associated with higher average headcount, higher fund management and administration expenses due to higher average AUM and higher spending on sales related activities.
Year Ended December 31, 2016 Compared to Year Ended December 31, 2015
U.S. Business segment
Revenues of the U.S. Business segment decreased 27.9% from $294.7 million during the year ended December 31, 2015 to $212.5 million during the year ended December 31, 2016. The decrease was attributable to lower average AUM which decreased 26.7%, primarily resulting from net outflows from HEDJ and DXJ, our two largest U.S. listed ETFs. Our average U.S. advisory fee decreased to 0.51% from 0.53% during the year ended December 31, 2016 due to changes in product mix.
Operating expenses of the U.S. Business segment decreased 7.2% from $148.4 million during the year ended December 31, 2015 to $137.8 million during the year ended December 31, 2016. The decrease was primarily due to significantly lower accrued incentive compensation as a result of net outflows we experienced partly offset by higher headcount related expenses and higher stock-based compensation due to equity awards granted to our employees as part of 2015 compensation. Operating expenses also decreased as a result of lower fund management and administration expenses primarily due to lower average U.S. listed AUM. These decreases were partly offset by higher sales and business development and marketing expenses.
International Business segment
Revenues of the International Business segment increased 64.7% from $4.2 million during the year ended December 31, 2015 to $7.0 million during the year ended December 31, 2016. This increase was attributable to higher average AUM which increased 69.9% from $600.5 million in 2015 to $1.0 billion in 2016 primarily due to net inflows. In addition, in July 2016 we began distributing six locally listed ETFs in Canada.
Operating expenses of the International Business segment increased 95.3% from $13.4 million during the year ended December 31, 2015 to $26.1 million during the year ended December 31, 2016. Certain non-recurring charges were recognized in 2016 including an increase of $4.6 million in acquisition payment expense primarily associated with the acceleration of the buyout of the remaining minority interest in our European business and a goodwill impairment charge of $1.7 million on the goodwill recognized in connection with the acquisition of a majority stake in our European business. In addition, compensation and benefits expense was higher due to increased headcount, including a full year of compensation that was recognized in 2016 for European hires that occurred during the build out of our European business in 2015. Fund management and administration expense also increased due to higher average AUM. Also, we incurred expenses in Canada as our office was established in April 2016.
Liquidity and Capital Resources
The following table summarizes key data regarding our liquidity, capital resources and use of capital to fund our operations:
| December 31, 2017 |
December 31, 2016 |
|||||||
| Balance Sheet Data (in thousands): |
||||||||
| Cash and cash equivalents |
$ | 54,193 | $ | 92,722 | ||||
| Securities owned, at fair value |
66,294 | 58,907 | ||||||
| Securities held-to-maturity |
21,299 | 22,496 | ||||||
| Accounts receivable |
21,309 | 17,668 | ||||||
|
|
|
|
|
|||||
| Total: Liquid assets |
163,095 | 191,793 | ||||||
| Less: Total liabilities |
(62,034 | ) | (48,423 | ) | ||||
|
|
|
|
|
|||||
| Total: Available liquidity |
$ | 101,061 | $ | 143,370 | ||||
|
|
|
|
|
|||||
57
| Year Ended December 31, | ||||||||||||
| 2017 | 2016 | 2015 | ||||||||||
| Cash Flow Data (in thousands): |
||||||||||||
| Operating cash flows |
$ | 48,508 | $ | 54,911 | $ | 155,111 | ||||||
| Investing cash flows |
(37,021 | ) | (89,265 | ) | (12,319 | ) | ||||||
| Financing cash flows |
(51,136 | ) | (82,844 | ) | (98,136 | ) | ||||||
| Foreign exchange rate effect |
1,120 | (150 | ) | 130 | ||||||||
|
|
|
|
|
|
|
|||||||
| (Decrease)/increase in cash and cash equivalents |
$ | (38,529 | ) | $ | (117,348 | ) | $ | 44,786 | ||||
|
|
|
|
|
|
|
|||||||
Liquidity
We consider our available liquidity to be our liquid assets less our liabilities. Liquid assets consist of cash and cash equivalents, securities owned, at fair value, securities held-to-maturity and accounts receivable. Cash and cash equivalents include cash on hand with financial institutions and all highly liquid investments with an original maturity of 90 days or less at the time of purchase. Our securities owned, at fair value are highly liquid investments. Certain securities are accounted for as held-to-maturity securities and we have the intention and ability to hold them to maturity. However, these securities are also readily traded and, if needed, could be sold for liquidity. Accounts receivable are current assets and primarily represent receivables from advisory fees we earn from our ETPs. Our liabilities consist primarily of payments owed to vendors and third parties in the normal course of business as well as accrued year end compensation for employees.
Cash and cash equivalents decreased $38.5 million during the year ended December 31, 2017 due to $99.8 million used to purchase securities available-for-sale, $43.8 million used to pay dividends on our common stock, $18.7 million used to fund the AdvisorEngine note receivable, net of original issue discount, $8.3 million invested in AdvisorEngine, $7.9 million used to repurchase our common stock, $3.0 million used to purchase securities held-to-maturity and $2.1 million used to acquire the Questrade ETFs. These decreases were partly offset by $91.1 million from sales and maturities of securities available-for-sale, $48.5 million of cash generated by our operating activities, $4.2 million from held-to-maturity securities called or maturing during the period and $1.3 million for other activities.
Cash and cash equivalents decreased $117.3 million during the year ended December 31, 2016 due to $63.6 million of cash and cash equivalents invested in an available-for-sale portfolio of short-duration investment grade corporate bonds, $43.7 million used to pay dividends on our common stock, $39.4 million used to repurchase our common stock, $20.0 million invested in AdvisorEngine, $15.5 million used to purchase held-to-maturity securities, $11.8 million used in connection with the GreenHaven acquisition and $0.9 million of other activities. These decreases were partly offset by $54.9 million of cash generated by our operating activities, $16.7 million from held-to-maturity securities called or maturing during the year and $6.0 million from sales and maturities of securities available-for-sale.
Cash and cash equivalents increased $44.8 million during the year ended December 31, 2015 due to $155.1 million of cash flows generated by our operating activities, $4.8 million from held-to-maturity securities called or maturing during the year and $4.5 million from the exercise of stock options. These increases were partially offset by $78.5 million used to pay dividends on our common stock, $24.1 million used to repurchase our common stock, $14.4 million used to purchase securities held-to-maturity and $2.6 million for leasehold and other capital expenditures for our office space.
Pending Acquisition of ETFS
We plan to finance our pending acquisition of ETFS with $253.0 million of cash (including $53.0 million from cash on hand), 15,250,000 shares of our common stock and 14,750 shares of a new class of Series A Non-Voting Convertible Preferred Stock that is convertible, subject to certain restrictions, into an aggregate of 14,750,000 shares of our common stock. The stock consideration will represent initial ownership of approximately 18% of our outstanding common stock on an as-converted basis. However, we will not effect any conversion of shares of our Series A Non-Voting Convertible Preferred Stock to the extent that after giving effect to such conversion, ETF Securities (together will its affiliates and certain attributable parties) would beneficially own in excess of 9.99% of our common stock outstanding immediately after giving effect to such conversion.
The newly issued debt has yet to be raised. We have secured commitments for senior secured debt financing of $250.0 million from Credit Suisse Securities (USA) LLC in support of the acquisition, which will be comprised of a $50.0 million revolving credit facility and a $200.0 million term loan facility. Interest under the credit facilities will accrue at a rate per annum of up to LIBOR plus 2.00% (commencing at LIBOR plus 1.75%) or up to ABR plus 1.00% (commencing at ABR plus 0.75%), subject to step-downs based on our ratio of debt to EBITDA. Commitment fees on any undrawn portion of the revolving credit facility will begin at 0.50% and also will be subject to step-downs based on our ratio of debt to EBITDA. The revolving credit facility will provide for borrowings denominated in
58
U.S. dollars, Euros and British Pounds. The term of the facilities will be three years from the date of completion of the acquisition. Entering into the credit agreement is subject to customary closing conditions, including, among others, completion of the acquisition.
The credit agreement will include various covenants, including a quarterly leverage test and others which may limit our ability to freely use our cash (if not otherwise permitted). Quarterly dividend payments in excess of $0.03 per share and repurchases of our common stock (excluding purchases of our common stock withheld pursuant to the terms of equity awards granted to employees to satisfy tax withholding obligations) will be permitted only to the extent we comply with a leverage test and no event of default (as defined within the credit agreement) has occurred and is continuing at the time the cash dividend payment is made. Our ability to make certain investments will also be restricted.
Capital Resources
Our principal source of financing is our operating cash flow. We believe that current cash flows generated by our operating activities and existing cash balances should be sufficient for us to fund our operations for at least the next 12 months.
Use of Capital
Our business does not require us to maintain a significant cash position. We expect that our main uses of cash will be to facilitate the acquisition of ETFS, potentially exercise our option to acquire the remaining equity interests in AdvisorEngine and fund the ongoing operations of our business. Also, as part of our capital management, we maintain a capital return program which includes a $0.03 per share quarterly cash dividend and authority to purchase our common stock through April 27, 2019, including purchases to offset future equity grants made under our equity plans. As previously mentioned, under the terms of the credit agreement governing the credit facilities, we will be subject to various covenants including compliance with a leverage test. A quarterly dividend payment in excess of $0.03 per share and repurchases of our common stock (excluding purchases of our common stock withheld pursuant to the terms of equity awards granted to employees to satisfy tax withholding obligations) will be permitted only to the extent we comply with a leverage test and no event of default (as defined within the credit agreement) has occurred and is continuing at the time the cash dividend payment or stock repurchase is made.
In 2017, we repurchased 697,664 shares of our common stock under the repurchase program for an aggregate cost of $7.9 million. Currently, $88.6 million remains under this program for future purchases.
Contractual Obligations
The following table summarizes our future cash payments associated with contractual obligations as of December 31, 2017.
| Total | Payments Due by Period | |||||||||||||||||||
| (in thousands) | ||||||||||||||||||||
| Less than 1 year |
1 to 3 years | 3 to 5 years | More than 5 years |
|||||||||||||||||
| Operating leases |
$ | 35,129 | $ | 4,011 | $ | 6,863 | $ | 8,511 | $ | 15,744 | ||||||||||
| Pending acquisition – ETFS (cash consideration) |
253,000 | 253,000 | — | — | — | |||||||||||||||
| Commitment to provide working capital – AdvisorEngine |
8,000 | 8,000 | — | — | — | |||||||||||||||
|
|
|
|
|
|
|
|
|
|
|
|||||||||||
| Total |
$ | 296,129 | $ | 265,011 | $ | 6,863 | $ | 8,511 | $ | 15,744 | ||||||||||
|
|
|
|
|
|
|
|
|
|
|
|||||||||||
59
Pending Acquisition – ETFS
See Liquidity and Capital Resources – Pending Acquisition of ETFS for a description of our proposed acquisition of ETFS.
Commitment to Provide Working Capital – AdvisorEngine
In December 2017, we committed to provide up to $30.0 million in additional working capital to AdvisorEngine pursuant to an unsecured promissory note (of which $22.0 million is currently funded). The majority of the working capital was used by AdvisorEngine to fund the acquisition of CRM Software, Inc., known as Junxure. Pursuant to the terms of the promissory note, we will advance an additional $5.0 million and $3.0 million on June 30, 2018 and September 30, 2018, respectively, so long as no event of default (as defined) has occurred or is continuing.
Off-Balance Sheet Arrangements
Other than operating leases, which are included in the table above, we do not have any off-balance sheet financing or other arrangements. We have neither created nor are party to any special-purpose or off-balance sheet entities for the purpose of raising capital, incurring debt or operating our business.
Critical Accounting Policies
Goodwill and Intangible Assets
Goodwill is the excess of the fair value of the purchase price over the fair values of the identifiable net assets at the acquisition date. The Company tests its goodwill for impairment at least annually and at the time of a triggering event requiring re-evaluation, if one were to occur. In accordance with Accounting Standards Update, or ASU, 2017-04, Intangibles-Goodwill and Other (Topic 350): Simplifying the Test for Goodwill Impairment, which was early adopted by the Company, goodwill is impaired when the estimated fair value of the reporting unit that was allocated the goodwill is less than its carrying value. If the estimated fair value of such reporting unit is less than its carrying value, goodwill impairment is recognized based on that difference. A reporting unit is an operating segment or a component of an operating segment provided that the component constitutes a business for which discrete financial information is available and management regularly reviews the operating results of that component.
For impairment testing purposes, goodwill has been allocated to our U.S. Business reporting unit. When performing our goodwill impairment test, we consider a qualitative assessment, when appropriate, and the income approach, market approach and our market capitalization when determining the fair value of our reporting units. We have designated April 30th as our annual impairment testing date. Our goodwill was assessed for impairment as of April 30, 2017. The results of this analysis indicated no impairment.
Indefinite-lived intangible assets are tested for impairment at least annually and are reviewed for impairment whenever events or changes in circumstances indicate that the carrying amount of an asset may not be recoverable. Indefinite-lived intangible assets are impaired if their estimated fair value is less than their carrying value. We may rely on a qualitative assessment when performing our intangible asset impairment test. Otherwise, the impairment evaluation is performed at the lowest level of reasonably identifiable cash flows independent of other assets. We have designated November 30th as our annual impairment testing date for our indefinite-lived intangible assets. Our intangible assets were assessed for impairment as of November 30, 2017. The results of this analysis identified no indicators of impairment to be recognized based upon a qualitative assessment.
Revenue Recognition
We earn investment advisory fees from ETPs, as well as licensing fees from third parties. ETP advisory fees are based on a percentage of the ETPs’ average daily net assets and recognized over the period the related service is provided. Licensing fees are based on a percentage of the average monthly net assets and recognized over the period the related service is provided.
Recently Issued Accounting Pronouncements
In May 2014, the Financial Accounting Standards Board, or FASB, issued ASU 2014-09, Revenue from Contracts with Customers (ASU 2014-09), which is a new comprehensive revenue recognition standard on the financial reporting requirements for revenue from contracts entered into with customers. In July 2015, the FASB deferred this ASU’s effective date by one year, to interim and annual periods beginning after December 15, 2017. The deferral allows early adoption at the original effective date. During 2016, the FASB issued ASU 2016-08, which clarifies principal versus agent considerations, ASU 2016-10, which clarifies identifying performance obligations and the licensing implementation guidance, and ASU 2016-12, which amends certain aspects of the new revenue recognition standard pursuant to ASU 2014-09. ASU 2014-09 allows for the use of either the retrospective or modified retrospective adoption method. The guidance in ASU 2014-09, and the related amendments, is effective for us beginning on January 1, 2018. We will adopt this standard on that date under the modified retrospective method and have determined the standard will not have a material impact on our historical pattern of recognizing revenue for advisory fees and licensing fees in our consolidated financial statements.
60
In June 2016, the FASB issued ASU 2016-13, Financial Instruments-Credit Losses (Topic 326) – Measurement of Credit Losses on Financial Instruments (ASU 2016-13). The main objective of the standard is to provide financial statement users with more decision-useful information about the expected credit losses on financial instruments and other commitments to extend credit held by a reporting entity at each reporting date. To achieve this objective, the amendments in the standard replace the incurred loss impairment methodology with a methodology that reflects expected credit losses and requires consideration of a broader range of reasonable and supportable information to inform credit loss estimates. The standard is applicable to loans, accounts receivable, trade receivables, and other financial assets measured at amortized cost, loan commitments and certain other off-balance sheet credit exposures, debt securities (including those held-to-maturity) and other financial assets measured at fair value through other comprehensive income, and beneficial interests in securitized financial assets. Accordingly, the new methodology will be utilized when assessing our financial instruments for impairment. ASU 2016-13 is effective for years beginning after December 15, 2019, including interim periods within those fiscal years under a modified retrospective approach. Early adoption is permitted for periods beginning after December 15, 2018. We are currently evaluating the impact that the standard will have on our consolidated financial statements.
In March 2016, the FASB issued ASU 2016-09, Compensation—Stock Compensation (Topic 718): Improvements to Employee Share-Based Payment Accounting (ASU 2016-09). The standard is intended to simplify several areas of accounting for share-based compensation arrangements, including the income tax impact, classification on the statement of cash flows and forfeitures. ASU 2016-09 is effective for fiscal years, and interim periods within those years, beginning after December 15, 2016, and early adoption is permitted. We adopted this standard prospectively on January 1, 2017. The adoption of the standard increased volatility reported in income tax expense as income tax windfalls and shortfalls associated with the vesting of stock-based compensation is now recorded in income tax expense, rather than additional paid-in capital, when applicable. This new guidance resulted in us recognizing approximately $1.0 million of income tax expense for tax shortfalls related to stock-based compensation vesting that occurred during the year ended December 31, 2017. See Note 16 to our Consolidated Financial Statements.
In February 2016, the FASB issued ASU 2016-02, Leases (ASU 2016-02), which requires lessees to include most leases on the balance sheet. ASU 2016-02 is effective for fiscal years (and interim reporting periods within those years) beginning after December 15, 2018 and early adoption is permitted. We are currently evaluating the impact that the standard will have on our consolidated financial statements and expect, at a minimum, that its implementation will result in a gross-up on the consolidated balance sheets upon recognition of right-of-use assets and lease liabilities associated with the future minimum payments required under operating leases as disclosed in Note 9 to our Consolidated Financial Statements.
In January 2016, the FASB issued ASU 2016-01, Financial Instruments – Recognition and Measurement of Financial Assets and Financial Liabilities (ASU 2016-01). The main objective of the standard is to enhance the reporting model for financial instruments to provide users of financial statements with more decision-useful information. The amendments in the update make targeted improvements to generally accepted accounting principles. These include requiring equity investments (except those accounted for under the equity method of accounting or those that result in consolidation of the investee) to be measured at fair value with changes in fair value recognized in net income. Available-for-sale classification for equity investments with readily determinable fair values will no longer be permissible. However, an entity may choose to measure equity investments that do not have readily determinable fair values at cost minus impairment, if any, plus or minus changes resulting from observable price changes in orderly transactions for the identical or similar investment of the same issuer. The update also simplifies the impairment assessment of equity investments without readily determinable fair values by requiring a qualitative assessment to identify impairment. When a qualitative assessment indicates that impairment exists, an entity is required to measure the investment at fair value. ASU 2016-01 is effective for fiscal years beginning after December 15, 2017, including interim periods within those fiscal years. Early adoption is not permitted for the updates currently applicable to us. Our equity investments with readily determinable fair values are all currently measured at fair value with changes in fair value recognized in net income. Upon adoption, we will apply the amendments in this update when assessing the carrying value of our investments, held at cost.
| ITEM 7A. | QUANTITATIVE AND QUALITATIVE DISCLOSURES ABOUT MARKET RISK |
The following information, together with information included in Management’s Discussion and Analysis of Financial Condition and Results of Operations, describes key aspects of our market risk.
Market Risk
Market risk to us generally represents the risk of changes in the value of securities held in the portfolios of the WisdomTree ETPs that generally results from fluctuations in securities prices, foreign currency exchange rates against the U.S. dollar, and interest rates. Nearly all of our revenues are derived from advisory agreements for the WisdomTree ETFs. Under these agreements, the advisory fee we receive is based on the average market value of the assets in the WisdomTree ETF portfolios we manage.
Fluctuations in the value of these securities are common and are generated by numerous factors such as market volatility, the overall economy, inflation, changes in investor strategies and sentiment, availability of alternative investment vehicles, government regulations and others. Accordingly, changes in any one or a combination of these factors may reduce the value of investment
61
securities and, in turn, the underlying AUM on which our revenues are earned. These declines may cause investors to withdraw funds from our ETPs in favor of investments that they perceive as offering greater opportunity or lower risk, thereby compounding the impact on our revenues. We believe challenging and volatile market conditions will continue to be present in the foreseeable future.
Interest Rate Risk
In order to maximize yields, we invest our corporate cash in short-term interest earning assets, primarily money market instruments at a commercial bank, federal agency debt instruments and short-term investment grade corporate bonds which totaled $135.7 million and $113.1 million as of December 31, 2016 and 2017, respectively. We do not anticipate that changes in interest rates will have a material impact on our financial condition, operating results or cash flows.
We plan to partially finance our pending acquisition of ETFS with $200.0 million of newly issued debt. The newly issued debt has yet to be raised. We have secured commitments for senior secured debt financing of $250.0 million which will be comprised of a $50.0 million revolving credit facility and a $200.0 million term loan facility. Interest rate risk is not significant as the borrowing rates under these credit facilities are variable rates.
Exchange Rate Risk
As a result of our operations in Europe, Japan and Canada, we now operate globally and are subject to currency translation exposure on the results of our non-U.S. operations. Foreign currency translation risk is the risk that exchange rate gains or losses arise from translating foreign entities’ statements of earnings and balance sheets from functional currency to our reporting currency (the U.S. dollar) for consolidation purposes. We currently generate the vast majority of our revenues and expenses in the U.S. dollar. However, the acquisition of ETFS (if the acquisition is completed) will increase our exposure to exchange rate risk, predominantly associated with the British pound. We do not anticipate that changes in exchange rates associated with the Japanese Yen and Canadian Dollar, as they relate to translating functional currency to our reporting currency, will have a material impact on our financial condition, operating results or cash flows. Currently, we do not enter into derivative financial instruments aimed at offsetting certain exposures in the statement of operations or the balance sheet but may look to do so in the future.
Commodity Price Risk
We are currently not subject to significant commodity price risk. However, our acquisition of ETFS, if completed will provide us with an industry leading position in European-listed gold and commodity products. Fluctuations in the prices of commodities that are linked to certain of these ETPs could have a material adverse effect on ETFS’s AUM and revenues. In addition, a portion of the management fees earned are received in gold ounces and we currently do not anticipate entering into arrangements to hedge against fluctuations in the price of gold.
| ITEM 8. | FINANCIAL STATEMENTS AND SUPPLEMENTARY DATA |
The report of the independent registered public accounting firm and financial statements listed in the accompanying index are included in Item 15 of this Annual Report on Form 10-K. See Index to Consolidated Financial Statements on page F-1 of this Annual Report on Form 10-K.
| ITEM 9. | CHANGES IN AND DISAGREEMENTS WITH ACCOUNTANTS ON ACCOUNTING AND FINANCIAL DISCLOSURE |
None.
| ITEM 9A. | CONTROLS AND PROCEDURES |
Evaluation of Disclosure Controls and Procedures
As of December 31, 2017, our management, with the participation of our Chief Executive Officer and our Chief Financial Officer, evaluated the effectiveness of our disclosure controls and procedures pursuant to Rule 13a-15(b) promulgated under the Exchange Act. Based upon that evaluation, our Chief Executive Officer and our Chief Financial Officer concluded that, as of December 31, 2017, our disclosure controls and procedures were effective at a reasonable assurance level in ensuring that material information required to be disclosed by us in the reports that we file or submit under the Exchange Act is recorded, processed, summarized and reported within the time periods specified in the rules, regulations and forms of the SEC, including ensuring that such material information is accumulated by and communicated to our management, including our Chief Executive Officer and our Chief Financial Officer, as appropriate to allow timely decisions regarding required disclosure.
62
Changes in Internal Control Over Financial Reporting
During the quarter ended December 31, 2017, there were no changes in our internal control over financial reporting that have materially affected, or are reasonably likely to materially affect, our internal control over financial reporting.
Report of Management on Internal Control over Financial Reporting
Our management is responsible for establishing and maintaining adequate internal control over financial reporting, as defined in Rules 13a-15(f) and 15d-15(f) under the Exchange Act. In order to evaluate the effectiveness of internal control over financial reporting, management has conducted an assessment, including testing, using the criteria in Internal Control—Integrated Framework issued by the Committee of Sponsoring Organizations of the Treadway Commission (2013 Framework) (the COSO criteria). Our system of internal control over financial reporting is designed to provide reasonable assurance regarding the reliability of financial reporting and the preparation of financial statements for external purposes in accordance with generally accepted accounting principles. Our internal control over financial reporting includes those policies and procedures that (i) pertain to the maintenance of records that, in reasonable detail, accurately and fairly reflect the transactions and dispositions of the Company’s assets; (ii) provide reasonable assurance that transactions are recorded as necessary to permit preparation of financial statements in accordance with generally accepted accounting principles, and that receipts and expenditures of the Company are being made only in accordance with authorizations of management and directors of the Company; and (iii) provide reasonable assurance regarding prevention or timely detection of unauthorized acquisition, use, or disposition of the Company’s assets that could have a material effect on the financial statements.
Because of its inherent limitations, internal control over financial reporting may not prevent or detect misstatements. Also, projections of any evaluation of effectiveness to future periods are subject to the risk that controls may become inadequate because of changes in conditions, or that the degree of compliance with the policies or procedures may deteriorate.
Based on the assessment, management has concluded that the Company maintained effective internal control over financial reporting as of December 31, 2017, based on the COSO criteria.
The effectiveness of the Company’s internal control over financial reporting as of December 31, 2017 has been audited by Ernst & Young LLP, an independent registered public accounting firm, as stated in their report, which is included herein.
| ITEM 9B. | OTHER INFORMATION |
None.
| ITEM 10. | DIRECTORS, EXECUTIVE OFFICERS AND CORPORATE GOVERNANCE |
The information required by Item 401 of Regulation S-K regarding directors and officers will be contained in our definitive proxy statement to be filed pursuant to Regulation 14A for the 2016 Annual Meeting of our stockholders, expected to be filed within 120 days of our fiscal year end, or in an amendment to this Form 10-K, and is incorporated herein by reference.
The information required by Item 405 of Regulation S-K will be contained in our definitive proxy statement or in an amendment to this Form 10-K, and is incorporated herein by reference.
We have adopted a Code of Conduct that applies to all of our directors, officers and employees, including our principal executive officer and principal financial and accounting officer. The Code of Conduct is posted on our website at http://ir.wisdomtree.com/governance.cfm.
We will post any amendments to, or waivers from, a provision of this Code of Conduct by posting such information on our website, at the address and location specified above.
The information required by Item 407(c)(3), (d)(4) and (d)(5) of Regulation S-K will be contained in our definitive proxy statement or in an amendment to this Form 10-K, and is incorporated herein by reference.
| ITEM 11. | EXECUTIVE COMPENSATION |
The information required by Item 402 and Item 407(e)(4) and (e)(5) of Regulation S-K will be contained in our definitive proxy statement or in an amendment to this Form 10-K, and is incorporated herein by reference.
63
| ITEM 12. | SECURITY OWNERSHP OF CERTAIN BENEFICIAL OWNERS AND MANAGEMENT AND RELATED STOCKHOLDER MATTERS |
The information required by Item 201(d) and Item 403 of Regulation S-K will be contained in our definitive proxy statement or in an amendment to this Form 10-K, and is incorporated herein by reference.
| ITEM 13. | CERTAIN RELATIONSHIPS AND RELATED TRANSACTIONS, AND DIRECTOR INDEPENDENCE |
The information required by Item 404 and Item 407(a) of Regulation S-K will be contained in our definitive proxy statement or in an amendment to this Form 10-K, and is incorporated herein by reference.
| ITEM 14. | PRINCIPAL ACCOUNTANT FEES AND SERVICES |
The information required by Item 9(e) of Schedule 14A will be contained in our definitive proxy statement or in an amendment to this Form 10-K, and is incorporated herein by reference.
| ITEM 15. | EXHIBITS; FINANCIAL STATEMENT SCHEDULES |
(a). The following are filed as part of this Annual Report on Form 10-K:
| 1. | Consolidated Financial Statements: The consolidated financial statements and report of independent registered public accounting firm required by this item are included beginning on page F-1. |
| 2. | Financial Statement Schedules: None. |
All other schedules are omitted because they are not applicable or not required, or because the required information is shown either in the consolidated financial statements or in the notes thereto.
(b). Exhibits: The list of exhibits in the Exhibit Index immediately preceding the exhibits to this Annual Report on Form 10-K is incorporated herein by reference in response to this item.
| ITEM 16. | FORM 10-K SUMMARY |
None.
64
WISDOMTREE INVESTMENTS, INC.
INDEX TO CONSOLIDATED FINANCIAL STATEMENTS
F-1
Report of Independent Registered Public Accounting Firm
To the Stockholders and the Board of Directors of WisdomTree Investments, Inc.
Opinion on the Financial Statements
We have audited the accompanying consolidated balance sheets of WisdomTree Investments, Inc. and Subsidiaries (the Company) as of December 31, 2017 and 2016, the related consolidated statements of operations, comprehensive income, stockholders’ equity and cash flows for each of the three years in the period ended December 31, 2017, and the related notes (collectively referred to as the “consolidated financial statements”). In our opinion, the consolidated financial statements present fairly, in all material respects, the financial position of the Company at December 31, 2017 and 2016, and the results of its operations and its cash flows for each of the three years in the period ended December 31, 2017, in conformity with U.S. generally accepted accounting principles.
We also have audited, in accordance with the standards of the Public Company Accounting Oversight Board (United States) (PCAOB), the Company’s internal control over financial reporting as of December 31, 2017, based on criteria established in Internal Control-Integrated Framework issued by the Committee of Sponsoring Organizations of the Treadway Commission (2013 framework) and our report dated March 1, 2018 expressed an unqualified opinion thereon.
Basis for Opinion
These financial statements are the responsibility of the Company’s management. Our responsibility is to express an opinion on the Company’s financial statements based on our audits. We are a public accounting firm registered with the PCAOB and are required to be independent with respect to the Company in accordance with the U.S. federal securities laws and the applicable rules and regulations of the Securities and Exchange Commission and the PCAOB.
We conducted our audits in accordance with the standards of the PCAOB. Those standards require that we plan and perform the audit to obtain reasonable assurance about whether the financial statements are free of material misstatement, whether due to error or fraud. Our audits included performing procedures to assess the risks of material misstatement of the financial statements, whether due to error or fraud, and performing procedures that respond to those risks. Such procedures included examining, on a test basis, evidence supporting the amounts and disclosures in the financial statements. Our audits also included evaluating the accounting principles used and significant estimates made by management, as well as evaluating the overall presentation of the financial statements. We believe that our audits provide a reasonable basis for our opinion.
/s/ Ernst & Young LLP
We have served as the Company’s auditor since 2010.
New York, NY
March 1, 2018
F-2
Report of Independent Registered Public Accounting Firm
To the Stockholders and the Board of Directors of WisdomTree Investments, Inc.
Opinion on Internal Control Over Financial Reporting
We have audited WisdomTree Investments, Inc. and Subsidiaries’ internal control over financial reporting as of December 31, 2017, based on criteria established in Internal Control-Integrated Framework issued by the Committee of Sponsoring Organizations of the Treadway Commission (2013 framework) (the COSO criteria). In our opinion, WisdomTree Investments, Inc. and Subsidiaries (the Company) maintained, in all material respects, effective internal control over financial reporting as of December 31, 2017, based on the COSO criteria.
We also have audited, in accordance with the standards of the Public Company Accounting Oversight Board (United States) (PCAOB), the 2017 consolidated financial statements of the Company and our report dated March 1, 2018 expressed an unqualified opinion thereon.
Basis for Opinion
The Company’s management is responsible for maintaining effective internal control over financial reporting and for its assessment of the effectiveness of internal control over financial reporting included in the accompanying Report of Management on Internal Control over Financial Reporting. Our responsibility is to express an opinion on the Company’s internal control over financial reporting based on our audit. We are a public accounting firm registered with the PCAOB and are required to be independent with respect to the Company in accordance with the U.S. federal securities laws and the applicable rules and regulations of the Securities and Exchange Commission and the PCAOB.
We conducted our audit in accordance with the standards of the PCAOB. Those standards require that we plan and perform the audit to obtain reasonable assurance about whether effective internal control over financial reporting was maintained in all material respects.
Our audit included obtaining an understanding of internal control over financial reporting, assessing the risk that a material weakness exists, testing and evaluating the design and operating effectiveness of internal control based on the assessed risk, and performing such other procedures as we considered necessary in the circumstances. We believe that our audit provides a reasonable basis for our opinion.
Definition and Limitations of Internal Control Over Financial Reporting
A company’s internal control over financial reporting is a process designed to provide reasonable assurance regarding the reliability of financial reporting and the preparation of financial statements for external purposes in accordance with generally accepted accounting principles. A company’s internal control over financial reporting includes those policies and procedures that (1) pertain to the maintenance of records that, in reasonable detail, accurately and fairly reflect the transactions and dispositions of the assets of the company; (2) provide reasonable assurance that transactions are recorded as necessary to permit preparation of financial statements in accordance with generally accepted accounting principles, and that receipts and expenditures of the company are being made only in accordance with authorizations of management and directors of the company; and (3) provide reasonable assurance regarding prevention or timely detection of unauthorized acquisition, use, or disposition of the company’s assets that could have a material effect on the financial statements.
Because of its inherent limitations, internal control over financial reporting may not prevent or detect misstatements. Also, projections of any evaluation of effectiveness to future periods are subject to the risk that controls may become inadequate because of changes in conditions, or that the degree of compliance with the policies or procedures may deteriorate.
/s/ Ernst & Young LLP
New York, NY
March 1, 2018
F-3
WisdomTree Investments, Inc. and Subsidiaries
Consolidated Balance Sheets
(In Thousands, Except Per Share Amounts)
| December 31, 2017 |
December 31, 2016 |
|||||||
| Assets: |
||||||||
| Current assets: |
||||||||
| Cash and cash equivalents |
$ | 54,193 | $ | 92,722 | ||||
| Securities owned, at fair value |
66,294 | 58,907 | ||||||
| Securities held-to-maturity |
1,000 | 3,994 | ||||||
| Accounts receivable |
21,309 | 17,668 | ||||||
| Income taxes receivable |
6,978 | — | ||||||
| Prepaid expenses |
3,550 | 3,346 | ||||||
| Other current assets |
1,007 | 555 | ||||||
|
|
|
|
|
|||||
| Total current assets |
154,331 | 177,192 | ||||||
| Fixed assets, net |
10,693 | 11,748 | ||||||
| Note receivable |
18,748 | — | ||||||
| Securities held-to-maturity |
20,299 | 18,502 | ||||||
| Deferred tax asset, net |
1,050 | 9,826 | ||||||
| Investments, carried at cost |
35,187 | 20,000 | ||||||
| Goodwill |
1,799 | 1,799 | ||||||
| Intangible assets |
12,085 | 9,953 | ||||||
| Other noncurrent assets |
793 | 747 | ||||||
|
|
|
|
|
|||||
| Total assets |
$ | 254,985 | $ | 249,767 | ||||
|
|
|
|
|
|||||
| Liabilities and stockholders’ equity |
||||||||
| Liabilities: |
||||||||
| Current liabilities: |
||||||||
| Fund management and administration payable |
$ | 20,099 | $ | 13,584 | ||||
| Compensation and benefits payable |
28,053 | 14,652 | ||||||
| Income taxes payable |
— | 4,700 | ||||||
| Acquisition payable |
— | 3,537 | ||||||
| Securities sold, but not yet purchased, at fair value |
950 | 1,248 | ||||||
| Accounts payable and other liabilities |
8,246 | 5,806 | ||||||
|
|
|
|
|
|||||
| Total current liabilities: |
57,348 | 43,527 | ||||||
| Deferred rent payable |
4,686 | 4,896 | ||||||
|
|
|
|
|
|||||
| Total liabilities |
62,034 | 48,423 | ||||||
|
|
|
|
|
|||||
| Commitments and Contingencies (Note 9) |
||||||||
| Stockholders’ equity: |
||||||||
| Preferred stock, par value $0.01; 2,000 shares authorized: |
— | — | ||||||
| Common stock, par value $0.01; 250,000 shares authorized; issued and outstanding: 136,996 and 136,475 at December 31, 2017 and December 31, 2016, respectively |
1,370 | 1,365 | ||||||
| Additional paid-in capital |
216,006 | 224,739 | ||||||
| Accumulated other comprehensive income/(loss) |
291 | (44 | ) | |||||
| Accumulated deficit |
(24,716 | ) | (24,716 | ) | ||||
|
|
|
|
|
|||||
| Total stockholders’ equity |
192,951 | 201,344 | ||||||
|
|
|
|
|
|||||
| Total liabilities and stockholders’ equity |
$ | 254,985 | $ | 249,767 | ||||
|
|
|
|
|
|||||
The accompanying notes are an integral part of these consolidated financial statements
F-4
WisdomTree Investments, Inc. and Subsidiaries
Consolidated Statements of Operations
(In Thousands, Except Per Share Amounts)
| Year Ended December 31, | ||||||||||||
| 2017 | 2016 | 2015 | ||||||||||
| Revenues: |
||||||||||||
| Advisory fees |
$ | 227,775 | $ | 218,465 | $ | 297,944 | ||||||
| Settlement gain (Note 9) |
6,909 | — | — | |||||||||
| Other income |
2,715 | 981 | 998 | |||||||||
|
|
|
|
|
|
|
|||||||
| Total revenues |
237,399 | 219,446 | 298,942 | |||||||||
| Expenses: |
||||||||||||
| Compensation and benefits |
81,493 | 63,263 | 73,228 | |||||||||
| Fund management and administration |
42,144 | 41,083 | 42,782 | |||||||||
| Marketing and advertising |
14,402 | 15,643 | 13,371 | |||||||||
| Sales and business development |
13,811 | 12,537 | 9,189 | |||||||||
| Professional and consulting fees |
10,086 | 6,692 | 7,067 | |||||||||
| Occupancy, communications and equipment |
5,415 | 5,211 | 4,299 | |||||||||
| Depreciation and amortization |
1,395 | 1,305 | 1,006 | |||||||||
| Third-party sharing arrangements |
3,393 | 2,827 | 2,443 | |||||||||
| Goodwill impairment |
— | 1,676 | — | |||||||||
| Acquisition payment |
— | 6,738 | 2,185 | |||||||||
| Other |
7,068 | 6,909 | 6,187 | |||||||||
|
|
|
|
|
|
|
|||||||
| Total expenses |
179,207 | 163,884 | 161,757 | |||||||||
|
|
|
|
|
|
|
|||||||
| Income before taxes |
58,192 | 55,562 | 137,185 | |||||||||
| Income tax expense |
30,993 | 29,407 | 57,133 | |||||||||
|
|
|
|
|
|
|
|||||||
| Net income |
$ | 27,199 | $ | 26,155 | $ | 80,052 | ||||||
|
|
|
|
|
|
|
|||||||
| Net income per share - basic |
$ | 0.20 | $ | 0.19 | $ | 0.58 | ||||||
|
|
|
|
|
|
|
|||||||
| Net income per share - diluted |
$ | 0.20 | $ | 0.19 | $ | 0.58 | ||||||
|
|
|
|
|
|
|
|||||||
| Weighted-average common shares - basic |
134,614 | 134,401 | 137,242 | |||||||||
|
|
|
|
|
|
|
|||||||
| Weighted-average common shares - diluted |
136,003 | 135,539 | 138,825 | |||||||||
|
|
|
|
|
|
|
|||||||
| Cash dividends declared per common share |
$ | 0.32 | $ | 0.32 | $ | 0.57 | ||||||
|
|
|
|
|
|
|
|||||||
The accompanying notes are an integral part of these consolidated financial statements
F-5
WisdomTree Investments, Inc. and Subsidiaries
Consolidated Statements of Comprehensive Income
(In Thousands)
| Year Ended December 31, | ||||||||||||
| 2017 | 2016 | 2015 | ||||||||||
| Net income |
$ | 27,199 | $ | 26,155 | $ | 80,052 | ||||||
| Other comprehensive income/(loss) |
||||||||||||
| Unrealized losses on available-for-sale securities, net of tax |
(314 | ) | (163 | ) | — | |||||||
| Foreign currency translation adjustment |
649 | 245 | (73 | ) | ||||||||
|
|
|
|
|
|
|
|||||||
| Other comprehensive income/(loss) |
335 | 82 | (73 | ) | ||||||||
|
|
|
|
|
|
|
|||||||
| Comprehensive income |
$ | 27,534 | $ | 26,237 | $ | 79,979 | ||||||
|
|
|
|
|
|
|
|||||||
The accompanying notes are an integral part of these consolidated financial statements
F-6
WisdomTree Investments, Inc. and Subsidiaries
Consolidated Statements of Changes in Stockholders’ Equity
(In Thousands)
| Common Stock | Additional Paid-In Capital |
Accumulated Other Comprehensive Income/(Loss) |
Accumulated Deficit |
Total | ||||||||||||||||||||
| Shares Issued |
Par Value |
|||||||||||||||||||||||
| Balance—January 1, 2015 |
134,959 | $ | 1,350 | $ | 209,216 | $ | (53 | ) | $ | (26,228 | ) | $ | 184,285 | |||||||||||
| Restricted stock issued, net |
861 | 9 | (9 | ) | — | — | — | |||||||||||||||||
| Shares repurchased |
(1,190 | ) | (12 | ) | (24,104 | ) | — | — | (24,116 | ) | ||||||||||||||
| Exercise of stock options, net |
3,785 | 37 | 4,483 | — | — | 4,520 | ||||||||||||||||||
| Stock-based compensation |
— | — | 10,900 | — | — | 10,900 | ||||||||||||||||||
| Tax benefit from stock option exercised and vested restricted shares |
— | — | 57,474 | — | — | 57,474 | ||||||||||||||||||
| Other comprehensive loss |
— | — | — | (73 | ) | — | (73 | ) | ||||||||||||||||
| Dividends |
— | — | — | — | (78,540 | ) | (78,540 | ) | ||||||||||||||||
| Net income |
— | — | — | — | 80,052 | 80,052 | ||||||||||||||||||
|
|
|
|
|
|
|
|
|
|
|
|
|
|||||||||||||
| Balance—December 31, 2015 |
138,415 | 1,384 | 257,960 | (126 | ) | (24,716 | ) | 234,502 | ||||||||||||||||
| Restricted stock issued, net |
1,662 | 16 | (16 | ) | — | — | — | |||||||||||||||||
| Shares repurchased |
(3,778 | ) | (37 | ) | (39,342 | ) | — | — | (39,379 | ) | ||||||||||||||
| Exercise of stock options, net |
176 | 2 | 193 | — | — | 195 | ||||||||||||||||||
| Stock-based compensation |
— | — | 14,892 | — | — | 14,892 | ||||||||||||||||||
| Tax benefit from stock option exercised and vested restricted shares |
— | — | 8,557 | — | — | 8,557 | ||||||||||||||||||
| Other comprehensive income |
— | — | — | 82 | — | 82 | ||||||||||||||||||
| Dividends |
— | — | (17,505 | ) | — | (26,155 | ) | (43,660 | ) | |||||||||||||||
| Net income |
— | — | — | — | 26,155 | 26,155 | ||||||||||||||||||
|
|
|
|
|
|
|
|
|
|
|
|
|
|||||||||||||
| Balance—December 31, 2016 |
136,475 | 1,365 | 224,739 | (44 | ) | (24,716 | ) | 201,344 | ||||||||||||||||
| Restricted stock issued, net |
1,022 | 10 | (10 | ) | — | — | — | |||||||||||||||||
| Shares repurchased |
(698 | ) | (7 | ) | (7,884 | ) | — | — | (7,891 | ) | ||||||||||||||
| Exercise of stock options, net |
197 | 2 | 530 | — | — | 532 | ||||||||||||||||||
| Stock-based compensation |
— | — | 14,717 | — | — | 14,717 | ||||||||||||||||||
| Tax benefit from stock option exercised and vested restricted shares |
— | — | 492 | — | — | 492 | ||||||||||||||||||
| Other comprehensive income |
— | — | — | 335 | — | 335 | ||||||||||||||||||
| Dividends |
— | — | (16,578 | ) | — | (27,199 | ) | (43,777 | ) | |||||||||||||||
| Net income |
— | — | — | — | 27,199 | 27,199 | ||||||||||||||||||
|
|
|
|
|
|
|
|
|
|
|
|
|
|||||||||||||
| Balance—December 31, 2017 |
136,996 | $ | 1,370 | $ | 216,006 | $ | 291 | $ | (24,716 | ) | $ | 192,951 | ||||||||||||
|
|
|
|
|
|
|
|
|
|
|
|
|
|||||||||||||
The accompanying notes are an integral part of these consolidated financial statements
F-7
WisdomTree Investments, Inc. and Subsidiaries
Consolidated Statements of Cash Flows
(In Thousands)
| Year Ended December 31, | ||||||||||||
| 2017 | 2016 | 2015 | ||||||||||
| Cash flows from operating activities: |
||||||||||||
| Net income |
$ | 27,199 | $ | 26,155 | $ | 80,052 | ||||||
| Adjustments to reconcile net income to net cash provided by operating activities: |
||||||||||||
| Settlement gain |
(6,909 | ) | — | — | ||||||||
| Deferred income taxes |
8,838 | 12,900 | 53,018 | |||||||||
| Stock-based compensation |
14,717 | 14,892 | 10,900 | |||||||||
| Depreciation and amortization |
1,395 | 1,305 | 1,006 | |||||||||
| Realized losses on securities available-for-sale |
1,132 | — | — | |||||||||
| Goodwill impairment |
— | 1,676 | — | |||||||||
| Other |
(211 | ) | (278 | ) | (79 | ) | ||||||
| Changes in operating assets and liabilities: |
||||||||||||
| Securities owned, at fair value |
(135 | ) | (1,556 | ) | — | |||||||
| Accounts receivable |
(3,532 | ) | 9,778 | (9,321 | ) | |||||||
| Income taxes receivable/payable |
(11,211 | ) | 1,687 | 2,974 | ||||||||
| Prepaid expenses |
(204 | ) | (719 | ) | (1,069 | ) | ||||||
| Other assets |
(408 | ) | (307 | ) | (795 | ) | ||||||
| Acquisition payable |
(3,547 | ) | (384 | ) | 2,185 | |||||||
| Fund management and administration payable |
6,203 | 9,636 | 2,978 | |||||||||
| Compensation and benefits payable |
13,126 | (13,089 | ) | 13,286 | ||||||||
| Securities sold, but not yet purchased, at fair value |
(299 | ) | 1,249 | — | ||||||||
| Accounts payable and other liabilities |
2,354 | (8,034 | ) | (24 | ) | |||||||
|
|
|
|
|
|
|
|||||||
| Net cash provided by operating activities |
48,508 | 54,911 | 155,111 | |||||||||
| Cash flows from investing activities: |
||||||||||||
| Purchase of fixed assets |
(295 | ) | (1,070 | ) | (2,616 | ) | ||||||
| Purchase of securities held-to-maturity |
(3,009 | ) | (15,502 | ) | (14,467 | ) | ||||||
| Purchase of securities available-for-sale |
(99,848 | ) | (63,619 | ) | — | |||||||
| Purchase of investments |
(8,278 | ) | (20,000 | ) | — | |||||||
| Funding of AdvisorEngine note receivable, net of original issue discount (Note 6) |
(18,748 | ) | — | — | ||||||||
| Acquisition of the right to manage Questrade’s ETFs (Note 18) |
(2,132 | ) | — | — | ||||||||
| Proceeds from held-to-maturity securities maturing or called prior to maturity |
4,194 | 16,742 | 4,764 | |||||||||
| Proceeds from sales and maturities of securities available-for-sale |
91,095 | 6,002 | — | |||||||||
| Acquisition less cash acquired |
— | (11,818 | ) | — | ||||||||
|
|
|
|
|
|
|
|||||||
| Net cash used in investing activities |
(37,021 | ) | (89,265 | ) | (12,319 | ) | ||||||
| Cash flows from financing activities: |
||||||||||||
| Dividends paid |
(43,777 | ) | (43,660 | ) | (78,540 | ) | ||||||
| Shares repurchased |
(7,891 | ) | (39,379 | ) | (24,116 | ) | ||||||
| Proceeds from exercise of stock options |
532 | 195 | 4,520 | |||||||||
|
|
|
|
|
|
|
|||||||
| Net cash used in financing activities |
(51,136 | ) | (82,844 | ) | (98,136 | ) | ||||||
|
|
|
|
|
|
|
|||||||
| Increase/(decrease) in cash flow due to changes in foreign exchange rate |
1,120 | (150 | ) | 130 | ||||||||
|
|
|
|
|
|
|
|||||||
| Net (decrease)/increase in cash and cash equivalents |
(38,529 | ) | (117,348 | ) | 44,786 | |||||||
| Cash and cash equivalents—beginning of year |
92,722 | 210,070 | 165,284 | |||||||||
|
|
|
|
|
|
|
|||||||
| Cash and cash equivalents—end of year |
$ | 54,193 | $ | 92,722 | $ | 210,070 | ||||||
|
|
|
|
|
|
|
|||||||
| Supplemental disclosure of cash flow information: |
||||||||||||
| Cash paid for taxes |
$ | 33,113 | $ | 14,990 | $ | 1,262 | ||||||
|
|
|
|
|
|
|
|||||||
NON-CASH INVESTING ACTIVITY
On June 20, 2017, the Company was issued newly authorized preferred stock of Thesys Group, Inc. (formerly known as Tradeworx, Inc.”) (“Thesys”) and a warrant to purchase additional preferred stock in connection with the resolution of a dispute related to the Company’s ownership stake in Thesys. The fair value of the preferred stock was $6,909 and is included in Investments on the Consolidated Balance Sheets. The fair value of the warrant was determined to be insignificant (See Note 7).
The accompanying notes are an integral part of these consolidated financial statements
F-8
WisdomTree Investments, Inc. and Subsidiaries
Notes to Consolidated Financial Statements
(In Thousands, Except Share and Per Share Amounts)
1. Organization and Description of Business
WisdomTree Investments, Inc., through its global subsidiaries (collectively, “WisdomTree” or the “Company”), is an exchange traded product (“ETP”) sponsor and asset manager headquartered in New York. WisdomTree offers ETPs covering equity, fixed income, currency, alternative and commodity asset classes. The Company has the following wholly-owned operating subsidiaries:
| • | WisdomTree Asset Management, Inc. (“WTAM”) is a New York based investment adviser registered with the SEC providing investment advisory and other management services to the WisdomTree Trust (“WTT”) and WisdomTree exchange traded funds (“ETFs”). |
| • | Boost Management Limited (“BML”) is a Jersey based management company providing investment and other management services to Boost Issuer PLC (“BI”) and Boost ETPs. |
| • | WisdomTree Europe Limited (“WisdomTree Europe”) is a U.K. based company registered with the Financial Conduct Authority providing management and other services to BML and WisdomTree Management Limited. |
| • | WisdomTree Management Limited (“WTML”) is an Ireland based management company providing investment and other management services to WisdomTree Issuer plc (“WTI”) and WisdomTree UCITS ETFs. |
| • | WisdomTree Japan Inc. (“WTJ”) is a Japan based company that is registered with Japan’s Ministry of Finance and serves the institutional market selling U.S. listed WisdomTree ETFs in Japan. |
| • | WisdomTree Commodity Services, LLC (“WTCS”) is a New York based company that serves as the managing owner and commodity pool operator of the WisdomTree Continuous Commodity Index Fund. WTCS is registered with the Commodity Futures Trading Commission (“CFTC”) and is a member of the National Futures Association (“NFA”). |
| • | WisdomTree Asset Management Canada, Inc. (“WTAMC”) is a Canada based investment fund manager registered with the Ontario Securities Commission providing fund management services to locally-listed WisdomTree ETFs. |
The WisdomTree ETFs are issued in the U.S. by WTT. WTT, a non-consolidated third-party, is a Delaware statutory trust registered with the SEC as an open-end management investment company. The Company has licensed to WTT the use of certain of its own indexes on an exclusive basis for the WisdomTree ETFs in the U.S. The Boost ETPs are issued by BI. BI, a non-consolidated third-party, is a public limited company domiciled in Ireland. The WisdomTree UCITS ETFs are issued by WTI. WTI, a non-consolidated third-party, is a public limited company domiciled in Ireland.
The Board of Trustees and Board of Directors of WTT, BI and WTI, respectively, are separate from the Board of Directors of the Company. The respective Trustees and Directors of WTT, BI and WTI, as applicable, are primarily responsible for overseeing the management and affairs of the WisdomTree ETFs, Boost ETPs and the WisdomTree UCITS ETFs for the benefit of the WisdomTree ETF, Boost ETP and the WisdomTree UCITS ETF shareholders, respectively, and have contracted with the Company to provide for general management and administration services. The Company, in turn, has contracted with third parties to provide the majority of these administration services. In addition, certain officers of the Company provide general management services for WTT, BI and WTI.
Pending Acquisition of ETFS
On November 13, 2017, the Company entered into a Share Sale Agreement with ETF Securities Limited (“ETF Securities”), pursuant to which it agreed to acquire ETF Securities’ European exchange-traded commodity, currency and short-and-leveraged business (“ETFS”) by purchasing the entire issued share capital of a subsidiary into which ETF Securities will have transferred ETFS prior to completion of the acquisition.
Pursuant to the Share Sale Agreement, the Company will acquire ETFS for a purchase price, subject to customary adjustments for working capital, consisting of $253.0 million in cash (including $53.0 million from cash on hand), 15,250,000 shares of common stock and 14,750 shares of a new class of Series A Non-Voting Convertible Preferred Stock that is convertible, subject to certain restrictions, into an aggregate of 14,750,000 shares of our common stock.
The Company has secured commitments for senior secured debt financing of $250.0 million from Credit Suisse Securities (USA) LLC in support of the acquisition, which will be comprised of a $50.0 million revolving credit facility and a $200.0 million term loan facility. Interest under the credit facilities will accrue at a rate per annum of up to LIBOR plus 2.00% (commencing at LIBOR plus 1.75%) or up to ABR plus 1.00% (commencing at ABR plus 0.75%), subject to step-downs based on our ratio of debt to
F-9
adjusted earnings before interest, taxes, depreciation and amortization (“EBITDA”). Commitment fees on any undrawn portion of the revolving credit facility will begin at 0.50% and also will be subject to step-downs based on the Company’s ratio of debt to EBITDA. The revolving credit facility will provide for borrowings denominated in U.S. dollars, Euros and British Pounds. The term of the facilities will be three years from the date of completion of the acquisition. The credit agreement governing the facilities will include a leverage test. Entering into the credit agreement is subject to customary closing conditions, including, among others, completion of the acquisition.
Completion of the acquisition is subject to customary closing conditions, including, among others, obtaining regulatory approvals and the Company and ETF Securities entering into an Investor Rights Agreement, pursuant to which, among other things, ETF Securities will be subject to lock-up, standstill and voting restrictions, and will receive certain registration rights with respect to the common stock, including the Series A Non-Voting Convertible Preferred Stock, it will receive in the transaction. The Share Sale Agreement will terminate if the conditions to complete the acquisition are not satisfied on or prior to May 13, 2018, subject to the parties agreeing to extend such date.
2. Significant Accounting Policies
Basis of Presentation
These consolidated financial statements have been prepared in conformity with U.S. generally accepted accounting principles (“GAAP”) and in the opinion of management reflect all adjustments, consisting of only normal recurring adjustments, necessary for a fair statement of financial condition, results of operations, and cash flows for the periods presented. The consolidated financial statements include the accounts of the Company’s wholly owned subsidiaries.
All intercompany accounts and transactions have been eliminated in consolidation.
Consolidation
The Company consolidates entities in which it has a controlling financial interest. The Company determines whether it has a controlling financial interest in an entity by first evaluating whether the entity is a voting interest entity (“VOE”) or a variable interest entity (“VIE”). The usual condition for a controlling financial interest in a VOE is ownership of a majority voting interest. If the Company has a majority voting interest in a VOE, the entity is consolidated. The Company has a controlling financial interest in a VIE when the Company has a variable interest that provides it with (i) the power to direct the activities of the VIE that most significantly impact the VIE’s economic performance and (ii) the obligation to absorb losses of the VIE or the right to receive benefits from the VIE that could potentially be significant to the VIE.
The Company reassesses its initial evaluation of whether an entity is a VIE when certain reconsideration events occur.
Segment and Geographic Information
The Company operates as an ETP sponsor and asset manager providing investment advisory services in the U.S., Europe, Canada and Japan. These activities are reported in the Company’s U.S. Business and International Business reportable segments. The U.S. Business segment includes the results of the Company’s U.S. operations and Japan sales office, which primarily engages in selling U.S. listed ETFs to Japanese institutional clients. The results of the Company’s European and Canadian operations are reported as the International Business segment.
Revenues are primarily derived in the U.S. and the vast majority of the Company’s AUM is currently located in the U.S.
Foreign Currency Translation
Assets and liabilities of subsidiaries whose functional currency is not the U.S. dollar are translated based on the end of period exchange rates from local currency to U.S. dollars. Results of operations are translated at the average exchange rates in effect during the period. The impact of the foreign currency translation adjustment is included in the Consolidated Statements of Comprehensive Income as a component of other comprehensive income.
Use of Estimates
The preparation of the Company’s consolidated financial statements in conformity with U.S. GAAP requires management to make estimates and assumptions that affect the reported amounts of assets and liabilities as of the balance sheet dates and the reported amounts of revenues and expenses for the periods presented. Actual results could differ materially from those estimates.
Revenue Recognition
The Company earns investment advisory fees from its ETPs, as well as licensing fees from third parties. ETP advisory fees are based on a percentage of the ETPs’ average daily net assets and recognized over the period the related service is provided. Licensing fees are based on a percentage of the average monthly net assets and recognized over the period the related service is provided.
F-10
Depreciation and Amortization
Depreciation is provided for using the straight-line method over the estimated useful lives of the related assets as follows:
| Equipment |
5 years | |||
| Furniture and fixtures |
15 years |
Leasehold improvements are amortized over the term of their respective leases or service lives of the improvements, whichever is shorter. Fixed assets are recorded at cost less accumulated depreciation and amortization.
Occupancy
The Company accounts for its office lease facilities as operating leases, which may include free rent periods and escalation clauses. The Company expenses the lease payments associated with operating leases on a straight-line basis over the lease term.
Marketing and Advertising
Advertising costs, including media advertising and production costs, are expensed when incurred.
Cash and Cash Equivalents
The Company considers all highly liquid investments with an original maturity of 90 days or less at the time of purchase to be classified as cash equivalents. The Company maintains deposits with financial institutions in an amount that is in excess of federally insured limits.
Accounts Receivable and Allowance for Doubtful Accounts
Accounts receivable are customer and other obligations due under normal trade terms. An allowance for doubtful accounts is not provided since, in the opinion of management, all accounts receivable recorded are deemed current and collectible.
Impairment of Long-Lived Assets
The Company performs a review for the impairment of long-lived assets when events or changes in circumstances indicate that the estimated undiscounted future cash flows expected to be generated by the assets are less than their carrying amounts or when other events occur which may indicate that the carrying amount of an asset may not be recoverable.
Earnings per Share
Basic earnings per share (“EPS”) is computed by dividing net income available to common stockholders by the weighted-average number of common shares outstanding for the period. Net income available to common stockholders represents net income of the Company reduced by an allocation of earnings to participating securities. Unvested share-based payment awards that contain non-forfeitable rights to dividends or dividend equivalents (whether paid or unpaid) are participating securities and are included in the computation of EPS pursuant to the two-class method. Share-based payment awards that do not contain such rights are not deemed participating securities and are included in diluted shares outstanding (if dilutive) under the treasury stock method. Diluted EPS reflects the reduction in earnings per share assuming dilutive options or other dilutive contracts to issue common stock were exercised or converted into common stock. Diluted EPS is calculated under both the treasury stock method and two-class method. The calculation that results in the most dilutive EPS amount for the common stock is reported in the Company’s consolidated financial statements.
Note Receivable
Note receivable is accounted for on an amortized cost basis, net of original issue discount. Interest income is accrued over the term of the note using the effective interest method. The Company performs a review for the impairment of the note receivable on a quarterly basis and provides for an allowance for credit losses if all or a portion of the note is determined to be uncollectible.
Securities Owned and Securities Sold, but not yet Purchased (at fair value)
Securities owned and securities sold, but not yet purchased are securities classified as either trading or available-for-sale (“AFS”). These securities are recorded on their trade date and are measured at fair value. The Company classifies these financial instruments based primarily on the Company’s intent to hold or sell the security. Changes in the fair value of securities classified as trading are reported in other income in the period the change occurs. Unrealized gains and losses of securities classified as AFS are included in other comprehensive income. Once sold, amounts reclassified out of accumulated other comprehensive income and into earnings are determined using the specific identification method. AFS securities are assessed for impairment on a quarterly basis.
F-11
Securities Held-to-Maturity
The Company accounts for certain of its investments as held-to-maturity on a trade date basis, which are recorded at amortized cost. For held-to-maturity investments, the Company has the intent and ability to hold investments to maturity and it is not more-likely-than-not that the Company will be required to sell the investments before recovery of their amortized cost bases, which may be maturity. On a quarterly basis, the Company reviews its portfolio of investments for impairment. If a decline in fair value is deemed to be other-than-temporary, the security is written down to its fair value through earnings.
Investments, Carried at Cost
The Company accounts for equity securities and other instruments that do not have a readily determinable fair value as cost method investments to the extent such investments are not subject to consolidation or the equity method. Income is recognized when dividends are received only to the extent they are distributed from net accumulated earnings of the investee. Otherwise, such distributions are considered returns of investment and are recorded as a reduction of the cost of the investment.
Cost method investments held by the Company are assessed for impairment on a quarterly basis.
Goodwill
Goodwill is the excess of the fair value of the purchase price over the fair values of the identifiable net assets at the acquisition date. The Company tests its goodwill for impairment at least annually and at the time of a triggering event requiring re-evaluation, if one were to occur, in accordance with Accounting Standards Update (“ASU”) 2017-04, Intangibles-Goodwill and Other (Topic 350): Simplifying the Test for Goodwill Impairment. The Company early adopted the revised guidance for the impairment tests performed after January 1, 2017. Under the revised guidance, goodwill is considered impaired when the estimated fair value of the reporting unit that was allocated the goodwill is less than its carrying value. If the estimated fair value of such reporting unit is less than its carrying value, goodwill impairment is recognized based on that difference, not to exceed the carrying amount of goodwill. A reporting unit is an operating segment or a component of an operating segment provided that the component constitutes a business for which discrete financial information is available and management regularly reviews the operating results of that component.
For impairment testing purposes, goodwill has been allocated to the Company’s U.S. Business reporting unit (See Note 18). The Company has designated April 30th as its annual goodwill impairment testing date. When performing its goodwill impairment test, the Company considers a qualitative assessment, when appropriate, and the income approach, market approach and its market capitalization when determining the fair value of its reporting units.
Intangible Assets
Indefinite-lived intangible assets are tested for impairment at least annually and are also reviewed for impairment whenever events or changes in circumstances indicate that the carrying amount of an asset may not be recoverable. Indefinite-lived intangible assets are impaired if their estimated fair values are less than their carrying values.
Finite-lived intangible assets, if any, are amortized over their estimated useful life, which is the period over which the assets are expected to contribute directly or indirectly to the future cash flows of the Company. These intangible assets are tested for impairment at the time of a triggering event, if one were to occur. Finite-lived intangible assets may be impaired when the estimated undiscounted future cash flows generated from the assets are less than their carrying amounts.
The Company may rely on a qualitative assessment when performing its intangible asset impairment test. Otherwise, the impairment evaluation is performed at the lowest level of reasonably identifiable cash flows independent of other assets. The Company has designated November 30th as its annual impairment testing date for its indefinite-lived intangible assets.
Stock-Based Awards
Accounting for stock-based compensation requires the measurement and recognition of compensation expense for all equity awards based on estimated fair values. Stock-based compensation is measured based on the grant-date fair value of the award and is amortized over the relevant service period. Forfeitures are recognized when they occur.
Income Taxes
The Company accounts for income taxes using the liability method, which requires the determination of deferred tax assets and liabilities based on the differences between the financial and tax basis of assets and liabilities using the enacted tax rates in effect for the year in which differences are expected to reverse. Deferred tax assets are adjusted by a valuation allowance if, based on the weight of available evidence, it is more-likely-than-not that some portion or all the deferred tax assets will not be realized.
F-12
In order to recognize and measure any unrecognized tax benefits, management evaluates and determines whether any of its tax positions are more-likely-than-not to be sustained upon examination, including resolution of any related appeals or litigation processes, based on the technical merits of the position. Once it is determined that a position meets this recognition threshold, the position is measured to determine the amount of benefit to be recognized in the consolidated financial statements. The Company records interest expense and penalties related to tax expenses as income tax expense.
Non-income based taxes are recorded as part of other liabilities and other expenses.
Third-Party Sharing Arrangements
The Company pays a percentage of its advisory fee revenues based on incremental growth in AUM, subject to caps or minimums, to marketing agents to sell WisdomTree ETFs and for including WisdomTree ETFs on third-party customer platforms.
Recently Issued Accounting Pronouncements
In May 2014, the Financial Accounting Standards Board, or FASB, issued ASU 2014-09, Revenue from Contracts with Customers (ASU 2014-09), which is a new comprehensive revenue recognition standard on the financial reporting requirements for revenue from contracts entered into with customers. In July 2015, the FASB deferred this ASU’s effective date by one year, to interim and annual periods beginning after December 15, 2017. The deferral allows early adoption at the original effective date. During 2016, the FASB issued ASU 2016-08, which clarifies principal versus agent considerations, ASU 2016-10, which clarifies identifying performance obligations and the licensing implementation guidance, and ASU 2016-12, which amends certain aspects of the new revenue recognition standard pursuant to ASU 2014-09. ASU 2014-09 allows for the use of either the retrospective or modified retrospective adoption method. The guidance in ASU 2014-09, and the related amendments, is effective for the Company beginning on January 1, 2018. The Company will adopt this standard on that date under the modified retrospective method and has determined the standard will not have a material impact on its historical pattern of recognizing revenue for advisory fees and licensing fees in the Company’s consolidated financial statements.
In June 2016, the FASB issued ASU 2016-13, Financial Instruments-Credit Losses (Topic 326) – Measurement of Credit Losses on Financial Instruments (ASU 2016-13). The main objective of the standard is to provide financial statement users with more decision-useful information about the expected credit losses on financial instruments and other commitments to extend credit held by a reporting entity at each reporting date. To achieve this objective, the amendments in the standard replace the incurred loss impairment methodology with a methodology that reflects expected credit losses and requires consideration of a broader range of reasonable and supportable information to inform credit loss estimates. The standard is applicable to loans, accounts receivable, trade receivables, and other financial assets measured at amortized cost, loan commitments and certain other off-balance sheet credit exposures, debt securities (including those held-to-maturity) and other financial assets measured at fair value through other comprehensive income, and beneficial interests in securitized financial assets. Accordingly, the new methodology will be utilized when assessing the Company’s financial instruments for impairment. ASU 2016-13 is effective for years beginning after December 15, 2019, including interim periods within those fiscal years under a modified retrospective approach. Early adoption is permitted for periods beginning after December 15, 2018. The Company is currently evaluating the impact that the standard will have on its consolidated financial statements.
In March 2016, the FASB issued ASU 2016-09, Compensation—Stock Compensation (Topic 718): Improvements to Employee Share-Based Payment Accounting (ASU 2016-09). The standard is intended to simplify several areas of accounting for share-based compensation arrangements, including the income tax impact, classification on the statement of cash flows and forfeitures. ASU 2016-09 is effective for fiscal years, and interim periods within those years, beginning after December 15, 2016, and early adoption was permitted. The Company adopted this standard prospectively on January 1, 2017. The adoption of the standard increased volatility reported in income tax expense as income tax windfalls and shortfalls associated with the vesting of stock-based compensation is now recorded in income tax expense, rather than additional paid-in capital, when applicable. Adoption of this revised guidance resulted in the Company recognizing approximately $1,035 of additional income tax expense for tax shortfalls related to stock-based compensation vesting that occurred during the year ended December 31, 2017 (See Note 16).
In February 2016, the FASB issued ASU 2016-02, Leases (ASU 2016-02), which requires lessees to include most leases on the balance sheet. ASU 2016-02 is effective for fiscal years (and interim reporting periods within those years) beginning after December 15, 2018 and early adoption is permitted. The Company is currently evaluating the impact that the standard will have on its consolidated financial statements and expects, at a minimum, that its implementation will result in a gross-up on the consolidated balance sheets upon recognition of right-of-use assets and lease liabilities associated with the future minimum payments required under operating leases as disclosed in Note 9.
F-13
In January 2016, the FASB issued ASU 2016-01, Financial Instruments – Recognition and Measurement of Financial Assets and Financial Liabilities (ASU 2016-01). The main objective of the standard is to enhance the reporting model for financial instruments to provide users of financial statements with more decision-useful information. The amendments in the update make targeted improvements to generally accepted accounting principles. These include requiring equity investments (except those accounted for under the equity method of accounting or those that result in consolidation of the investee) to be measured at fair value with changes in fair value recognized in net income. Available-for-sale classification for equity investments with readily determinable fair values will no longer be permissible. However, an entity may choose to measure equity investments that do not have readily determinable fair values at cost minus impairment, if any, plus or minus changes resulting from observable price changes in orderly transactions for the identical or similar investment of the same issuer. The update also simplifies the impairment assessment of equity investments without readily determinable fair values by requiring a qualitative assessment to identify impairment. When a qualitative assessment indicates that impairment exists, an entity is required to measure the investment at fair value. ASU 2016-01 is effective for fiscal years beginning after December 15, 2017, including interim periods within those fiscal years. Early adoption is not permitted for the updates currently applicable to the Company. The Company’s equity investments with readily determinable fair values are all currently measured at fair value with changes in fair value recognized in net income. Upon adoption, the Company will apply the amendments in this update when assessing the carrying value of its investments, held at cost.
3. Cash and Cash Equivalents
Cash and cash equivalents of approximately $24,103 and $56,484 at December 31, 2017 and December 31, 2016, respectively, were held at one financial institution. At December 31, 2017 and December 31, 2016, cash equivalents were approximately $26,548 and $55,619, respectively.
4. Securities Owned and Securities Sold, but not yet Purchased (and Fair Value Measurement)
Securities owned and securities sold, but not yet purchased are measured at fair value. The fair value of securities is defined as the price that would be received to sell an asset or paid to transfer a liability (i.e., “the exit price”) in an orderly transaction between market participants at the measurement date. Accounting Standards Codification (“ASC”) 820, Fair Value Measurements, establishes a hierarchy for inputs used in measuring fair value that maximizes the use of observable inputs and minimizes the use of unobservable inputs by requiring that the most observable inputs be used when available. Observable inputs are inputs that market participants would use in pricing the asset or liability developed based on market data obtained from independent sources. Unobservable inputs reflect assumptions that market participants would use in pricing the asset or liability developed based on the best information available in the circumstances. The hierarchy is broken down into three levels based on the transparency of inputs as follows:
| Level 1 | - | Quoted prices for identical instruments in active markets. | ||
| Level 2 | - | Quoted prices for similar instruments in active markets; quoted prices for identical or similar instruments in markets that are not active; and model-derived valuations whose inputs are observable or whose significant value drivers are observable. | ||
| Level 3 | - | Instruments whose significant drivers are unobservable. | ||
The availability of observable inputs can vary from product to product and is effected by a wide variety of factors, including, for example, the type of product, whether the product is new and not yet established in the marketplace, and other characteristics particular to the transaction. To the extent that valuation is based on models or inputs that are less observable or unobservable in the market, the determination of fair value requires more judgment. Accordingly, the degree of judgment exercised by management in determining fair value is greatest for instruments categorized in Level 3. In certain cases, the inputs used to measure fair value may fall into different levels of the fair value hierarchy. In such cases, for disclosure purposes, the level in the fair value hierarchy within which the fair value measurement in its entirety falls is determined based on the lowest level input that is significant to the fair value measurement in its entirety.
Fair Valuation Methodology
Cash and Cash Equivalents (Note 3) – These financial assets represent cash in banks or cash invested in highly liquid investments with original maturities less than 90 days. These investments are valued at par, which approximates fair value, and are considered Level 1.
Note Receivable (Note 6) – The note receivable is an unsecured promissory note issued to AdvisorEngine Inc. which is carried at $18,748 representing amortized cost, net of original issue discount. The carrying amount of the note receivable at December 31, 2017 approximates fair value, as the implied discount rate of the note is similar to observable high yield credit spreads. The note receivable is classified as Level 2 within the fair value hierarchy.
F-14
Securities Held-to-Maturity (Note 5) – These securities are Federal agency debt instruments which are instruments that are generally traded in active, quoted and highly liquid markets and are therefore classified as Level 1 within the fair value hierarchy.
Securities Owned/Sold But Not Yet Purchased – These securities consist of securities classified as trading and AFS, as follows:
| December 31, | ||||||||
| 2017 | 2016 | |||||||
| Securities Owned |
||||||||
| Trading securities |
$ | 1,691 | $ | 1,556 | ||||
| Available-for-sale securities |
64,603 | 57,351 | ||||||
|
|
|
|
|
|||||
| Total |
$ | 66,294 | $ | 58,907 | ||||
|
|
|
|
|
|||||
| Securities Sold, but not yet Purchased |
||||||||
| Trading securities |
$ | 950 | $ | 1,248 | ||||
| Available-for-sale securities |
— | — | ||||||
|
|
|
|
|
|||||
| Total |
$ | 950 | $ | 1,248 | ||||
|
|
|
|
|
|||||
Trading securities are investments in ETFs. These instruments are generally traded in active, quoted and highly liquid markets and are therefore classified as Level 1 in the fair value hierarchy. AFS securities are investments in short-term investment grade corporate bonds and are classified as Level 2. Fair value is generally derived from observable bids for these Level 2 financial instruments.
AFS Securities
The following table summarizes unrealized gains, losses and fair value of the AFS securities:
| December 31, | ||||||||
| 2017 | 2016 | |||||||
| Cost |
$ | 65,237 | $ | 57,615 | ||||
| Gross unrealized gains in other comprehensive income |
— | — | ||||||
| Gross unrealized losses in other comprehensive income |
(634 | ) | (264 | ) | ||||
|
|
|
|
|
|||||
| Fair value |
$ | 64,603 | $ | 57,351 | ||||
|
|
|
|
|
|||||
All of the Company’s AFS securities are due within one year. The Company assesses the AFS securities for other-than-temporary impairment on a quarterly basis. No AFS securities were determined to be other-than-temporarily impaired for the years ending December 31, 2017 and 2016.
During the years ended December 31, 2017 and 2016, the Company received $91,095 and $6,002, respectively, of proceeds from the sale and maturity of available-for-sale securities and recognized gross realized losses of $1,132 and $0, respectively. These losses have been reclassified out of accumulated other comprehensive income and into the Consolidated Statements of Operations.
5. Securities Held-to-Maturity
The following table is a summary of the Company’s securities held-to-maturity:
| December 31, | ||||||||
| 2017 | 2016 | |||||||
| Federal agency debt instruments |
$ | 21,299 | $ | 22,496 | ||||
|
|
|
|
|
|||||
The following table summarizes unrealized gains, losses, and fair value of securities held-to-maturity:
| December 31, | ||||||||
| 2017 | 2016 | |||||||
| Cost/amortized cost |
$ | 21,299 | $ | 22,496 | ||||
| Gross unrealized gains |
9 | 13 | ||||||
| Gross unrealized losses |
(1,257 | ) | (1,353 | ) | ||||
|
|
|
|
|
|||||
| Fair value |
$ | 20,051 | $ | 21,156 | ||||
|
|
|
|
|
|||||
F-15
The Company assesses these securities for other-than-temporary impairment on a quarterly basis. No securities were determined to be other-than-temporarily impaired for the years ending December 31, 2017 and 2016. The Company does not intend to sell these securities and it is not more likely than not that the Company will be required to sell the securities before recovery of their amortized cost bases, which may be at maturity.
The following table sets forth the maturity profile of the securities held-to-maturity; however, these securities may be called prior to maturity date:
| December 31, | ||||||||
| 2017 | 2016 | |||||||
| Due within one year |
$ | 1,000 | $ | 3,994 | ||||
| Due one year through five years |
11 | 1,023 | ||||||
| Due five years through ten years |
6,027 | 4,031 | ||||||
| Due over ten years |
14,261 | 13,448 | ||||||
|
|
|
|
|
|||||
| Total |
$ | 21,299 | $ | 22,496 | ||||
|
|
|
|
|
|||||
6. Note Receivable
On December 29, 2017, the Company committed to provide up to $30,000 in additional working capital to AdvisorEngine pursuant to an unsecured promissory note (of which $22,000 is currently funded) (See Note 7). The majority of the funds were used by AdvisorEngine to acquire CRM Software, Inc., known as Junxure, a comprehensive client relationship management software and technology provider for financial advisors.
All principal amounts under the note bear interest from the date such amounts are advanced until repaid at a rate of 5% per annum, provided that immediately upon the occurrence and during the continuance of an event of default (as defined), interest will be increased to 10% per annum. All accrued and unpaid interest is treated as paid-in-kind (“PIK”) by capitalizing such amount and adding it to the principal amount of the original note. AdvisorEngine has the option to prepay the note, in whole or in part, at any time without premium or penalty. All borrowings under the promissory note mature on December 29, 2021.
In connection with providing funding to AdvisorEngine for the acquisition of Junxure, the Company secured an option to purchase the remaining equity interests in AdvisorEngine. The option was ascribed a fair value of $3,278 (See Note 7) which gave rise to original issue discount reducing the carrying value of the note.
The following is a summary of the outstanding note receivable balance at December 31, 2017:
| 2017 | ||||
| Note receivable (face value) |
$ | 22,000 | ||
| Less: Original issue discount, unamortized |
(3,278 | ) | ||
| Plus: Note issuance costs |
26 | |||
| Plus: PIK interest |
— | |||
|
|
|
|||
| Total note receivable, net |
$ | 18,748 | ||
|
|
|
|||
| Commitment remaining |
$ | 8,000 | ||
|
|
|
|||
The Company determined that an allowance for credit loss was not necessary at December 31, 2017 as the note receivable was recently issued and no adverse events or circumstances have occurred which may indicate that its carrying amount may not be recoverable. The carrying value of the note receivable at December 31, 2017 approximates fair value as the implied discount rate of the note is similar to observable high yield credit spreads.
The Company’s remaining commitment to provide working capital to AdvisorEngine is $8,000 at December 31, 2017 pursuant to the terms of the note. The additional funding is scheduled to be provided on June 30, 2018 and September 30, 2018 in the amounts of $5,000 and $3,000, respectively, if no event of default (as defined) has occurred and is continuing.
F-16
7. Investments, Carried at Cost
The following table sets forth the Company’s investments, carried at cost:
| December 31, 2017 |
December 31, 2016 |
|||||||
| AdvisorEngine – Preferred stock |
$ | 25,000 | $ | 20,000 | ||||
| AdvisorEngine – Option |
3,278 | — | ||||||
| Thesys. |
6,909 | — | ||||||
|
|
|
|
|
|||||
| Total |
$ | 35,187 | $ | 20,000 | ||||
|
|
|
|
|
|||||
AdvisorEngine
Preferred Stock
On November 18, 2016, the Company made a $20,000 strategic investment in AdvisorEngine, an end-to-end wealth management platform which enables individual customization of investment philosophies. The Company and AdvisorEngine also entered into an agreement whereby the Company’s asset allocation models are made available through AdvisorEngine’s open architecture platform and the Company actively introduces the platform to its distribution network. In consideration of its investment, the Company received 11,811,856 shares of Series A convertible preferred shares (“Series A Preferred”).
The Series A Preferred is convertible into common stock at the option of the Company and contains various rights and protections including a non-cumulative 6.0% dividend, payable if and when declared by the board of directors, and a liquidation preference that is senior to all other holders of capital stock of AdvisorEngine.
On April 27, 2017, the Company invested an additional $5,000 in AdvisorEngine to help facilitate AdvisorEngine’s acquisition of Kredible Technologies, Inc., a technology enabled, research-driven practice management firm designed to help advisors acquire new clients, and to continue to fuel AdvisorEngine’s growth, leadership and innovation in the advisor solutions space. The Company received 2,646,062 shares of Series A-1 convertible preferred stock which has substantially the same terms as the Series A Preferred.
The Company’s aggregate equity ownership interest in AdvisorEngine is approximately 47% (or 41% on a fully-diluted basis). The investment is accounted for under the cost method of accounting as it is not considered to be in-substance common stock and is assessed for impairment on a quarterly basis. No impairment existed at December 31, 2017 or 2016.
Option
On December 29, 2017, the Company secured an option to purchase the remaining equity interests in AdvisorEngine, in connection with its commitment to provide up to $30,000 of additional working capital (See Note 6). The option is for a period of approximately one year and is exercisable at a price derived from an agreed-upon enterprise valuation of AdvisorEngine. If exercised, closing of the acquisition would occur no later than January 15, 2019. The fair value of the option was determined to be $3,278, using a Monte Carlo simulation which was predominantly based on unobservable inputs and is therefore classified as Level 3. The enterprise value was derived from unobservable inputs including from a weighted average cost of capital (“WACC”) of 27% and an option volatility of 40%. An increase in the WACC would reduce AdvisorEngine’s enterprise value which would reduce the fair value of the option, whereas an increase in the option volatility would increase the fair value of the option.
The option is not accounted for as a derivative as it cannot be net settled and is not readily convertible to cash. Therefore, the option is accounted for under the cost method of accounting and is assessed for impairment on a quarterly basis. No impairment existed at December 31, 2017.
Thesys
On June 20, 2017, the Company was issued 7,797,533 newly authorized shares of Series Y preferred stock (“Series Y Preferred”) of Thesys in connection with the resolution of a dispute related to the Company’s ownership stake in Thesys (See Note 9). The Series Y Preferred represents current ownership of 18.9% of Thesys on a fully diluted basis (excluding certain reserved shares). In addition, the Company was issued a warrant to purchase 3,898,766 shares of Series Y Preferred.
The Series Y Preferred ranks pari passu in priority with Thesys’s current preferred stockholders, has a liquidation preference of $0.231 per share, contains various rights and protections and is convertible into common stock at the option of the Company. The warrant is exercisable for five years after closing, at varying exercise prices that increase over time and set at multiples of a pre-determined Thesys valuation (or new valuation if Thesys completes a qualified financing, as defined, within two years). If a claim is brought against Thesys or the Company relating to the settlement, the warrant will be exercisable for 100% of the number of shares of Series Y Preferred issued to the Company at closing.
F-17
The Company recorded the Series Y Preferred at its fair value of $6,909. The fair value was derived from an enterprise valuation of Thesys prepared as of April 30, 2017. The Thesys enterprise valuation was determined through a combination of a market approach (Guideline Public Company Method) and income approach (discounted cash flow analyses) applied to its business lines. These approaches are predominantly based on unobservable inputs and therefore the valuation is classified as Level 3. The table below presents the ranges and weighted averages of significant unobservable inputs used in these approaches to determine the enterprise value of Thesys.
| Market Approach(1) |
Range (Weighted Average) | |
| Revenue multiple |
0.9x | |
| Income Approach(1) |
Range (Weighted Average) | |
| Weighted average cost of capital (“WACC”) |
11.5% – 14.5% (12.6%) | |
| (1) | The approach and inputs selected varied, based upon the Thesys business line being valued. |
An increase in the revenue multiple would result in a higher enterprise value, whereas an increase in the WACC would reduce fair value.
The Series Y Preferred is not considered to be in-substance common stock and is therefore accounted for under the cost method of accounting and is assessed for impairment on a quarterly basis. The fair value of the warrant was determined to be insignificant. The warrant is not accounted for as a derivative as it cannot be net settled and is not readily convertible to cash.
8. Fixed Assets
The following table summarizes fixed assets:
| December 31, | ||||||||
| 2017 | 2016 | |||||||
| Equipment |
$ | 1,879 | $ | 1,739 | ||||
| Furniture and fixtures |
2,449 | 2,393 | ||||||
| Leasehold improvements |
11,037 | 10,877 | ||||||
| Less: Accumulated depreciation and amortization |
(4,672 | ) | (3,261 | ) | ||||
|
|
|
|
|
|||||
| Total |
$ | 10,693 | $ | 11,748 | ||||
|
|
|
|
|
|||||
9. Commitments and Contingencies
Contractual Obligations
The Company has entered into obligations under operating leases with initial non-cancelable terms in excess of one year for office space, telephone, and data services. Expenses recorded under these agreements for the years ended December 31, 2017, 2016, and 2015 were approximately $4,355, $4,293 and $3,447, respectively.
Future minimum lease payments with respect to non-cancelable operating leases at December 31, 2017 are approximately as follows:
| 2018 |
$ | 4,011 | ||
| 2019 |
3,564 | |||
| 2020 |
3,299 | |||
| 2021 |
2,955 | |||
| 2022 and thereafter |
21,300 | |||
|
|
|
|||
| Total |
$ | 35,129 | ||
|
|
|
AdvisorEngine
At December 31, 2017, the Company has a commitment to provide $8,000 of additional working capital to AdvisorEngine which is scheduled to be provided on June 30, 2018 and September 30, 2018 in the amounts of $5,000 and $3,000, respectively, if no event of default (as defined) has occurred and is continuing (See Note 6).
F-18
Letter of Credit
The Company collateralized its U.S. office lease through a standby letter of credit totaling $1,384. The collateral is included in cash and cash equivalents on the Company’s Consolidated Balance Sheets.
Settlement – Thesys
A few years ago, a dispute arose related to the Company’s ownership stake in Thesys. In March 2015, the Company was named a party in a lawsuit in the Delaware Court of Chancery pursuant to which a stockholder of Thesys sought to have the shares held by the Company invalidated. In August 2016, the court dismissed the claims brought against the Company and Thesys (as a nominal defendant), but the number of shares of Thesys owned by the Company remained in dispute. On June 20, 2017, the Company, Thesys and certain material stockholders of Thesys reached an agreement related to the dispute, pursuant to which (i) the litigation was dismissed; (ii) the parties released and agreed not to sue each other with respect to the related claims in the lawsuit; (iii) Thesys agreed to indemnify the Company against any such claims; (iv) the Company exchanged its current shares in Thesys for new shares of Thesys stock and a warrant in accordance with the terms of an equity exchange agreement as described below; and (v) the Company and Thesys entered into a stockholders agreement providing for certain rights and obligations of the Company and Thesys as described below.
Pursuant to the equity exchange agreement, the Company was issued shares of newly authorized preferred stock reflecting ownership of 19.99% of Thesys on a fully diluted basis (excluding certain reserved shares). The shares of preferred stock rank pari passu in priority with Thesys’s current preferred stockholders. In addition, Thesys issued the Company a warrant to purchase up to an additional 50% of the number of shares of preferred stock issued to the Company at closing, exercisable for five years after the closing, at varying exercise prices that increase over time and set at multiples of a pre-determined Thesys valuation (or a new valuation if Thesys completes a qualified financing, as defined, within two years). If a claim is brought against Thesys or the Company relating to the settlement, the warrant will be exercisable for 100% of the number of shares of preferred stock issued to the Company at closing. Pursuant to the stockholders agreement, the Company has the right to appoint one of five directors to Thesys’s board of directors, as well as additional customary rights, including (i) consent rights on certain transactions (e.g., related-party transactions and certain changes to organizational documents); (ii) pre-emptive rights on future issuances of shares, subject to customary carve-outs; (iii) information rights; and (iv) registration rights.
During the year ended December 31, 2017, the Company recorded a pre-tax gain of $6,909 representing the fair value of the Thesys preferred stock it received in connection with this settlement. The fair value of the warrant was determined to be insignificant. This amount has been recorded as settlement gain on the Consolidated Statements of Operations.
Contingencies
The Company may be subject to reviews, inspections and investigations by regulatory authorities as well as legal proceedings arising in the ordinary course of business. The Company is not currently party to any litigation that is expected to have a material adverse impact on its business, financial position, results of operations or cash flows.
10. Variable Interest Entity
VIEs are entities with any of the following characteristics: (i) the entity does not have enough equity to finance its activities without additional financial support, (ii) the equity holders, as a group, lack the characteristics of a controlling financial interest or (iii) the entity is structured with non-substantive voting rights.
The Company reassesses its initial evaluation of whether an entity is a VIE when certain reconsideration events occur. A reassessment was performed of AdvisorEngine in connection with the Company’s commitment to provide it with up to $30,000 of additional working capital, which occurred on December 29, 2017 (See Note 6). In connection with this assessment, the Company determined that AdvisorEngine had the characteristics of a VIE.
Consolidation of a VIE is required for the party deemed to be the primary beneficiary, if any. The primary beneficiary is the party who has both (a) the power to direct the activities of a VIE that most significantly impact the entity’s economic performance and (b) an obligation to absorb losses of the entity or a right to receive benefits from the entity that could potentially be significant to the entity. The Company is not the primary beneficiary of AdvisorEngine as it does not have the power to direct the activities that most significantly impact AdvisorEngine’s economic performance. Such power is conveyed through AdvisorEngine’s Board of Directors and the Company does not have control over the board.
F-19
The following table presents information about the Company’s variable interests in AdvisorEngine (a non-consolidated VIE):
| December 31, 2017 |
||||
| Carrying Amount—Assets |
||||
| Preferred stock |
$ | 25,000 | ||
| Note receivable—unsecured |
18,748 | |||
| Option |
3,278 | |||
|
|
|
|||
| Total carrying amount—Assets |
$ | 47,026 | ||
|
|
|
|||
| Maximum exposure to loss |
$ | 55,026 | ||
|
|
|
|||
The Company has a remaining commitment to provide working capital to AdvisorEngine of $8,000 at December 31, 2017 pursuant to the terms of the unsecured promissory note (See Note 6). The additional funding is scheduled to be provided on June 30, 2018 and September 30, 2018 in the amounts of $5,000 and $3,000, respectively, if no event of default (as defined) has occurred or is continuing.
11. Acquisition Payable
In April 2014, the Company acquired a 75% majority stake in its European business. Under the terms of the agreement, the remaining 25% was to be acquired on or about March 31, 2018. In May 2016, the Company accelerated the buyout of the remaining minority interest. Acquisition payment expense recognized during the year ended December 31, 2016 was $6,738, of which $5,993 was recorded in connection with the acceleration of the buyout. The remaining acquisition payable recorded on the Consolidated Balance Sheets was $0 and $3,537 at December 31, 2017 and 2016, respectively.
12. Related Party Transactions
The Company’s revenues are derived primarily from investment advisory agreements with related parties. Under these agreements, the Company has licensed to related parties the use of certain of its own indexes for the U.S. and Canadian WisdomTree ETFs and WisdomTree UCITS ETFs. The Board of Trustees and Board of Directors of the related parties are primarily responsible for overseeing the management and affairs of the U.S. and Canadian WisdomTree ETFs, Boost ETPs and WisdomTree UCITS ETFs for the benefit of their shareholders and have contracted with the Company to provide for general management and administration services. The Company is also responsible for certain expenses of the related parties, including the cost of transfer agency, custody, fund administration and accounting, legal, audit, and other non-distribution services, excluding extraordinary expenses, taxes and certain other expenses, which is included in fund management and administration on the Company’s Consolidated Statements of Operations. In exchange, the Company receives fees based on a percentage of the ETF average daily net assets. The advisory agreements may be terminated by the related parties upon notice. Certain officers of the Company also provide general management oversight of the related parties; however, these officers have no material decision making responsibilities and primarily implement the decisions of the Board of Trustees and Board of Directors of the related parties.
The following table summarizes accounts receivable from related parties which are included as a component of Accounts receivable on the Company’s Consolidated Balance Sheets:
| December 31, | ||||||||
| 2017 | 2016 | |||||||
| Receivable from WTT |
$ | 19,433 | $ | 16,506 | ||||
| Receivable from BI and WTI |
979 | 645 | ||||||
| Receivable from WTCS |
97 | 158 | ||||||
| Receivable from WTAMC |
87 | 40 | ||||||
|
|
|
|
|
|||||
| Total |
$ | 20,596 | $ | 17,349 | ||||
|
|
|
|
|
|||||
F-20
The following table summarizes revenues from advisory services provided to related parties:
| Year Ended December 31, | ||||||||||||
| 2017 | 2016 | 2015 | ||||||||||
| Advisory services provided to WTT |
$ | 215,513 | $ | 209,199 | $ | 293,788 | ||||||
| Advisory services provided to BI and WTI |
10,288 | 7,251 | 4,156 | |||||||||
| Advisory services provided to WTCS |
1,508 | 1,867 | — | |||||||||
| Advisory services provided to WTAMC |
466 | 148 | — | |||||||||
|
|
|
|
|
|
|
|||||||
| Total |
$ | 227,775 | $ | 218,465 | $ | 297,944 | ||||||
|
|
|
|
|
|
|
|||||||
The Company also has investments in certain WisdomTree ETFs of approximately $1,691 and $1,300 at December 31, 2017 and December 31, 2016, respectively. For the years ended December 31, 2017 and 2016, the Company recorded a gain from these investments of approximately $26 and loss of $12, respectively, within other income in the Consolidated Statements of Operations.
13. Stock-Based Awards
The Company grants equity awards to employees and directors which include restricted stock awards, restricted stock units and stock options. Stock options may be issued for terms of ten years and may vest after at least one year and have an exercise price equal to the Company’s stock price on the grant date. Restricted stock awards and restricted stock units are generally valued based on the Company’s stock price on the grant date. The Company estimates the fair value for stock options (when granted) using the Black-Scholes option pricing model. All restricted stock awards, restricted stock units and stock option awards require future service as a condition of vesting with certain awards subject to acceleration under certain conditions.
On June 20, 2016, the Company’s stockholders approved a new equity award plan under which the Company can issue up to 10,000,000 shares of common stock (less one share for every share granted under prior plans since March 31, 2016 and inclusive of shares available under the prior plans as of March 31, 2016) in the form of stock options and other stock-based awards. The Company also has issued from time to time stock-based awards outside a plan.
For the years ended December 31, 2017, 2016 and 2015, total stock-based compensation expense was $14,717, $14,892 and $10,900, respectively, and the related tax benefit recognized in the Consolidated Statements of Operations was $5,402, $5,324 and $4,149, respectively. Stock-based compensation expense for the year ended December 31, 2017 included $525 as a result of a modification to accelerate vesting of certain awards on December 29, 2017 made to 20 employees, which were originally scheduled to vest in January 2018.
The actual tax benefit realized for the tax deductions for share-based compensation was $7,684, $12,877 and $67,532 for the years ended December 31, 2017, 2016 and 2015, respectively.
A summary of unrecognized stock-based compensation expense and average remaining vesting period is as follows:
| December 31, 2017 | ||||||||
| Unrecognized Stock- Based Compensation |
Average Remaining Vesting Period |
|||||||
| Employees and directors |
$ | 16,715 | 1.70 | |||||
Stock Options
A summary of option activity is as follows:
| Options | Weighted-Average Exercise Price |
|||||||
| Outstanding January 1, 2015 |
5,330,070 | $ | 1.61 | |||||
| Granted |
— | — | ||||||
| Forfeitures/expirations |
— | — | ||||||
| Exercised |
(3,785,473 | ) | 1.19 | |||||
|
|
|
|
|
|||||
| Outstanding at December 31, 2015 |
1,544,597 | $ | 2.62 | |||||
| Granted |
— | — | ||||||
| Forfeitures/expirations |
— | — | ||||||
| Exercised |
(176,350 | ) | 1.11 | |||||
|
|
|
|
|
|||||
| Outstanding at December 31, 2016 |
1,368,247 | $ | 2.82 | |||||
F-21
| Options | Weighted-Average Exercise Price |
|||||||
| Granted |
— | — | ||||||
| Forfeitures/expirations |
— | — | ||||||
| Exercised |
(209,419 | ) | 3.17 | |||||
|
|
|
|
|
|||||
| Outstanding at December 31, 2017(1) |
1,158,828 | $ | 2.75 | |||||
|
|
|
|
|
|||||
| (1) | Expire on dates ranging from August 24, 2018 to November 15, 2021. |
The total intrinsic value of options exercised for the years ended December 31, 2017, 2016 and 2015 was $1,643, $1,794 and $76,329, respectively. Cash received from option exercise for the years ended December 31, 2017, 2016 and 2015 was $532, $195 and $4,520, respectively.
The following table summarizes information on stock options outstanding at December 31, 2017:
| Options Outstanding | Options Exercisable | |||||||||||||||||||||||
| Range of Exercise Prices |
Shares | Weighted- Average Remaining Life (Years) |
Weighted- Average Exercise Price |
Shares | Weighted- Average Remaining Life (Years) |
Weighted- Average Exercise Price |
||||||||||||||||||
| $0.70 – $0.70 |
415,000 | 1.1 | $ | 0.70 | 415,000 | 1.1 | $ | 0.70 | ||||||||||||||||
| $1.07 – $1.07 |
50,865 | 0.3 | 1.07 | 50,865 | 0.3 | 1.07 | ||||||||||||||||||
| $2.15 – $2.26 |
312,426 | 1.5 | 2.21 | 312,426 | 1.5 | 2.21 | ||||||||||||||||||
| $5.05 – $5.05 |
250,000 | 3.1 | 5.05 | 250,000 | 3.1 | 5.05 | ||||||||||||||||||
| $6.36 – $6.82 |
73,037 | 3.4 | 6.46 | 73,037 | 3.4 | 6.46 | ||||||||||||||||||
| $7.01 – $8.51 |
57,500 | 3.8 | 7.32 | 57,500 | 3.8 | 7.32 | ||||||||||||||||||
|
|
|
|
|
|
|
|
|
|
|
|
|
|||||||||||||
| 1,158,828 | 1.9 | $ | 2.75 | 1,158,828 | 1.9 | $ | 2.75 | |||||||||||||||||
|
|
|
|
|
|
|
|
|
|
|
|
|
|||||||||||||
At December 31, 2017, outstanding options for 1,158,828 shares (all of which were exercisable) had a remaining average contractual term of 1.9 years and an intrinsic value of $11,352.
Restricted Stock and Restricted Stock Units
The Company grants restricted stock awards and restricted stock units to employees and directors. All such awards require future service as a condition of vesting with certain awards subject to acceleration under certain conditions. Restricted stock awards and restricted stock units generally vest over three years.
A summary of restricted stock activity is as follows:
| Restricted Stock Awards | Restricted Stock Units | |||||||||||||||
| Shares | Weighted Average Grant Date Fair Value |
Shares | Weighted Average Grant Date Fair Value |
|||||||||||||
| Unvested Balance at January 1, 2015 |
1,513,939 | $ | 11.22 | — | $ | — | ||||||||||
| Granted |
886,413 | 19.72 | — | — | ||||||||||||
| Vested |
(753,917 | ) | 10.05 | — | — | |||||||||||
| Forfeited |
(25,709 | ) | 17.30 | — | — | |||||||||||
|
|
|
|
|
|
|
|
|
|||||||||
| Unvested Balance at December 31, 2015 |
1,620,726 | $ | 16.32 | — | $ | — | ||||||||||
| Granted |
1,687,553 | 11.19 | — | — | ||||||||||||
| Vested |
(846,386 | ) | 13.98 | — | — | |||||||||||
| Forfeited |
(25,439 | ) | 16.17 | — | — | |||||||||||
|
|
|
|
|
|
|
|
|
|||||||||
| Unvested Balance at December 31, 2016 |
2,436,454 | $ | 13.58 | — | $ | — | ||||||||||
| Granted |
1,068,550 | 10.51 | 7,231 | 10.49 | ||||||||||||
| Vested |
(1,641,870 | ) | 13.64 | — | — | |||||||||||
| Forfeited |
(46,468 | ) | 12.36 | (1,553 | ) | 10.83 | ||||||||||
|
|
|
|
|
|
|
|
|
|||||||||
| Unvested Balance at December 31, 2017 |
1,816,666 | $ | 11.75 | 5,678 | $ | 10.40 | ||||||||||
|
|
|
|
|
|
|
|
|
|||||||||
F-22
The aggregate fair value of awards that vested during the years ending December 31, 2017, 2016 and 2015 was $18,285, $9,842 and $13,362, respectively.
14. Employee Benefit Plans
The Company has a 401(k) savings plan covering all eligible employees in which the Company can make discretionary contributions from its profits. The amounts included in the table below are recorded in compensation expense in the Consolidated Statements of Operations.
A summary of discretionary contributions made by the Company is as follows:
| Year Ended December 31, | ||||||||||
| 2017 | 2016 | 2015 | ||||||||
| $ | 1,013 | $ | 934 | $ | 763 | |||||
|
|
|
|
|
|
|
|||||
15. Earnings Per Share
The following is a reconciliation of the basic and diluted earnings per share computation:
| Year Ended December 31, | ||||||||||||
| 2017 | 2016 | 2015 | ||||||||||
| Net income |
$ | 27,199 | $ | 26,155 | $ | 80,052 | ||||||
|
|
|
|
|
|
|
|||||||
| (shares in thousands) | ||||||||||||
| Shares of common stock and common stock equivalents: |
||||||||||||
| Weighted average common shares used in basic computation |
134,614 | 134,401 | 137,242 | |||||||||
| Dilutive effect of common stock equivalents |
1,389 | 1,138 | 1,583 | |||||||||
|
|
|
|
|
|
|
|||||||
| Weighted average common shares used in dilutive computation |
136,003 | 135,539 | 138,825 | |||||||||
|
|
|
|
|
|
|
|||||||
| Basic earnings per share |
$ | 0.20 | $ | 0.19 | $ | 0.58 | ||||||
| Diluted earnings per share |
$ | 0.20 | $ | 0.19 | $ | 0.58 | ||||||
In the table above, unvested share-based awards that have non-forfeitable rights to dividends or dividend equivalents are treated as a separate class of securities in calculating basic EPS.
Diluted earnings per share is calculated under both the treasury stock and two-class method and reflects the reduction in earnings per share assuming options or other contracts to issue common stock were exercised or converted into common stock (if dilutive). The calculation that results in the most dilutive earnings per share amount for common stock is reported in the Company’s consolidated financial statements. The Company excluded 1,593,000 and 996,000 common stock equivalents from its computation of diluted earnings per share for the years ended December 31, 2017 and 2016, respectively, as they were determined to be anti-dilutive. There were no anti-dilutive common stock equivalents excluded from the calculation of diluted earnings per share for the year ended December 31, 2015.
16. Income Taxes
The components of current and deferred income tax expense included in the Consolidated Statement of Operations for years ended December 31, 2017, 2016 and 2015 as determined in accordance with ASC 740, Income Taxes (“ASC 740”), are as follows:
| Year Ended December 31, | ||||||||||||
| 2017 | 2016 | 2015 | ||||||||||
| Current: |
||||||||||||
| Federal |
$ | 19,007 | $ | 14,515 | $ | 1,598 | ||||||
| State and local |
2,708 | 1,425 | 2,431 | |||||||||
| Foreign |
440 | 567 | 210 | |||||||||
|
|
|
|
|
|
|
|||||||
| $ | 22,155 | $ | 16,507 | $ | 4,239 | |||||||
|
|
|
|
|
|
|
|||||||
| Deferred: |
||||||||||||
| Federal |
$ | 7,947 | $ | 10,629 | $ | 46,784 | ||||||
| State and local |
1,105 | 2,296 | 6,233 | |||||||||
F-23
| Year Ended December 31, | ||||||||||||
| 2017 | 2016 | 2015 | ||||||||||
| Foreign |
(214 | ) | (25 | ) | (123 | ) | ||||||
|
|
|
|
|
|
|
|||||||
| $ | 8,838 | $ | 12,900 | $ | 52,894 | |||||||
|
|
|
|
|
|
|
|||||||
| Income tax expense from operations |
$ | 30,993 | $ | 29,407 | $ | 57,133 | ||||||
|
|
|
|
|
|
|
|||||||
A reconciliation of the statutory federal income tax rate and the Company’s effective rate is as follows:
| December 31, | ||||||||||||
| 2017 | 2016 | 2015 | ||||||||||
| Federal statutory rate |
35.0 | % | 35.0 | % | 35.0 | % | ||||||
| Change in valuation allowance—International |
9.2 | % | 8.2 | % | 0.9 | % | ||||||
| Blended state income tax rate, net of federal benefit |
3.8 | % | 4.2 | % | 4.1 | % | ||||||
| Non-deductible transaction costs |
2.7 | % | — | — | ||||||||
| Stock-based compensation tax shortfalls |
1.8 | % | — | — | ||||||||
| Re-measurement of net deferred tax assets – Rate change |
0.8 | % | — | — | ||||||||
| Acquisition expense |
— | 4.1 | % | 0.6 | % | |||||||
| Goodwill impairment |
— | 1.2 | % | — | ||||||||
| Other differences, net |
— | 0.2 | % | 1.0 | % | |||||||
|
|
|
|
|
|
|
|||||||
| Effective rate |
53.3 | % | 52.9 | % | 41.6 | % | ||||||
|
|
|
|
|
|
|
|||||||
Net Operating Losses – U.S.
The Company’s pre-tax federal net operating losses for tax purposes (“NOLs”) at December 31, 2017 was $3,671 which expire in 2024. The net operating loss carryforwards have been reduced by the impact of annual limitations described in the Internal Revenue Code Section 382 that arose as a result of an ownership change.
Net Operating Losses – International
The Company’s European and Canadian subsidiaries generated NOLs outside the U.S. These tax effected NOLs were $3,841, $4,551 and $2,051 at December 31, 2017, 2016 and 2015, respectively. The Company established a full valuation allowance related to these NOLs as it is more-likely-than-not that some portion, or all, of the deferred tax assets will not be realized.
Deferred Tax Assets (“DTAs”)
A summary of the components of the Company’s deferred tax assets at December 31, 2017 and 2016 are as follows:
| December 31, | ||||||||
| 2017 | 2016 | |||||||
| Deferred tax assets: |
|
|||||||
| NOLs – Foreign |
$ | 3,841 | $ | 4,551 | ||||
| Stock-based compensation |
1,474 | 5,382 | ||||||
| Deferred rent liability |
1,257 | 2,024 | ||||||
| NOLs – U.S. |
909 | 1,611 | ||||||
| Accrued expenses |
526 | 4,552 | ||||||
| Unrealized losses |
72 | 101 | ||||||
| Other |
416 | 227 | ||||||
|
|
|
|
|
|||||
| Deferred tax assets |
8,495 | 18,448 | ||||||
|
|
|
|
|
|||||
| Deferred tax liabilities: |
|
|||||||
| Unrealized gains |
1,718 | — | ||||||
| Fixed assets |
1,498 | 2,405 | ||||||
| Goodwill and intangible assets |
388 | 301 | ||||||
| Incentive compensation |
— | 1,365 | ||||||
|
|
|
|
|
|||||
| Deferred tax liabilities |
3,604 | 4,071 | ||||||
|
|
|
|
|
|||||
| Total deferred tax assets less deferred tax liabilities |
4,891 | 14,377 | ||||||
| Less: valuation allowance |
(3,841 | ) | (4,551 | ) | ||||
|
|
|
|
|
|||||
| Deferred tax assets, net |
$ | 1,050 | $ | 9,826 | ||||
|
|
|
|
|
|||||
F-24
U.S. Tax Reform
On December 22, 2017, the Tax Cuts and Jobs Act, or the TCJA, was enacted, which was the most comprehensive tax reform in more than 30 years. The sweeping modifications to the Internal Revenue Code include a significant reduction in the federal income tax rate (from 35% to 21%), change certain tax deductions including a disallowance for all executive compensation paid in excess of $1 million, create a territorial tax system with a one-time transition tax on previously deferred foreign earnings and require minimum taxes to be paid on future foreign earnings.
ASC 740 requires the effects of changes in tax rates and laws on deferred tax balances (including the effects of the one-time transition tax) to be recognized in the period in which the legislation is enacted. The remeasurement of our net DTAs using a statutory federal and state and local tax rate of approximately 25% resulted in a charge of $489. The one-time transition tax was not material as our international subsidiaries historically have generated losses. The Company’s accounting for the income tax effects of the TCJA is complete based on currently available guidance and interpretations.
Uncertain Tax Positions
The Company determined that it has no unrecognized tax benefits, or related interest and penalties, as of December 31, 2017 and 2016 as defined within ASC 740.
Income Tax Examinations
The Company is subject to U.S. federal income tax as well as income tax of multiple state, local and certain foreign jurisdictions. The Company is not currently under audit in any income tax jurisdictions.
Tax returns filed with each jurisdiction generally remain open to examination under the normal three-year statute of limitations. As of December 31, 2017, with few exceptions, the Company was no longer subject to income tax examinations by any taxing authority for years before 2014.
17. Shares Repurchased
On October 29, 2014, the Company’s Board of Directors authorized a three-year share repurchase program of up to $100,000. On April 27, 2016, the Board of Directors approved a $60,000 increase to the Company’s share repurchase program and extended the term through April 27, 2019. Included under this program are purchases to offset future equity grants made under the Company’s equity plans and are made in open market or privately negotiated transactions. This authority may be exercised from time to time and in such amounts as market conditions warrant, and subject to regulatory considerations. The timing and actual number of shares repurchased depends on a variety of factors including price, corporate and regulatory requirements, market conditions and other corporate liquidity requirements and priorities. The repurchase program may be suspended or terminated at any time without prior notice. Shares repurchased under this program are returned to the status of authorized and unissued on the Company’s books and records.
If the Company’s pending acquisition of ETFS is ultimately completed, its ability to freely repurchase shares of its common stock will be restricted. Under the terms of the credit agreement governing the credit facilities the Company plans to use to partially finance the acquisition of ETFS, share repurchases only will be permitted to the extent the Company complies with a leverage test and no event of default (as defined in the credit agreement) has occurred and is continuing at the time the share repurchase is made. However, the Company’s ability to purchase shares of its common stock withheld pursuant to the terms of equity awards granted to employees to satisfy tax withholding obligations will not be restricted.
During the years ended December 31, 2017, 2016 and 2015, the Company repurchased 697,664 shares, 3,778,932 shares and 1,190,356 shares of its common stock, respectively, under this program for an aggregate cost of $7,891, $39,379 and $24,116, respectively. Shares repurchased under this program were returned to the status of authorized and unissued on the Company’s books and records.
As of December 31, 2017, $88,614 remains under this program for future purchases.
F-25
18. Goodwill and Intangible Assets
Goodwill
Goodwill has been allocated to the Company’s U.S. Business reporting unit and is deductible for tax purposes. The Company has designated April 30th as its annual goodwill impairment testing date. The following table summarizes the goodwill activity during the period:
| U.S. Business Reporting Unit |
||||
| Balance at January 1, 2017 |
$ | 1,799 | ||
| Increases/(decreases) |
— | |||
|
|
|
|||
| Balance at December 31, 2017 |
$ | 1,799 | ||
|
|
|
|||
Goodwill was tested for impairment on April 30, 2017. The fair value of the reporting unit exceeded its carrying value and therefore no impairment was recognized.
Intangible Assets (Indefinite-Lived)
| Advisory Contracts (Questrade AUM) |
GCC Advisory Agreement |
Total | ||||||||||
| Balance at January 1, 2017 |
$ | — | $ | 9,953 | $ | 9,953 | ||||||
| Increases |
2,132 | — | 2,132 | |||||||||
| Decreases |
— | — | — | |||||||||
|
|
|
|
|
|
|
|||||||
| Total |
$ | 2,132 | $ | 9,953 | $ | 12,085 | ||||||
|
|
|
|
|
|
|
|||||||
Questrade ETFs
During the fourth quarter of 2017, the Company acquired a suite of eight Canadian listed ETFs from Questrade (the “Questrade ETFs”) with approximately CAD $99,108 (USD $77,403) in AUM at closing. The purchase price was CAD $2,675 (USD $2,132), all of which was allocated to the Company’s right to manage AUM in the form of advisory contracts. Most of the Questrade ETFs were merged into the Company’s existing Canadian listed ETFs. The intangible assets (which are deductible for tax purposes) were determined to have an indefinite useful life. The Company has designated November 30th as its annual impairment testing date for these intangible assets.
WisdomTree Continuous Commodity Index Fund
As part of the GreenHaven acquisition which occurred on January 1, 2016, the Company identified an intangible asset valued at $9,953 related to its customary advisory agreement with the GreenHaven Commodities ETF (renamed the WisdomTree Continuous Commodity Index Fund, or “GCC”). This intangible asset (which is deductible for tax purposes) was determined to have an indefinite useful life. The Company has designated November 30th as its annual impairment testing date for this indefinite-lived intangible asset.
During the fourth quarter of 2017, the Company performed its indefinite-lived intangible asset impairment test related to its customary advisory agreement with the WisdomTree Continuous Commodity Index Fund, or GCC. The results of this analysis identified no indicators of impairment to be recognized based upon a qualitative assessment.
19. Segment Reporting
The Company operates as an ETP sponsor and asset manager providing investment advisory services in the U.S., Europe, Canada and Japan. These activities are reported in the Company’s U.S. Business and International Business reportable segments. The U.S. Business segment includes the results of the Company’s U.S. operations and Japan sales office. The results of the Company’s European and Canadian operations are reported as the International Business segment.
Information concerning these reportable segments are as follows:
| Year Ended December 31, | ||||||||||||
| 2017 | 2016 | 2015 | ||||||||||
| Revenues (U.S. Business segment) |
||||||||||||
| Advisory fees |
$ | 217,021 | $ | 211,066 | $ | 293,788 | ||||||
| Settlement gain |
6,909 | — | — | |||||||||
| Other income |
2,949 | 1,424 | 931 | |||||||||
|
|
|
|
|
|
|
|||||||
| Total revenues (U.S. Business segment) |
$ | 226,879 | $ | 212,490 | $ | 294,719 | ||||||
|
|
|
|
|
|
|
|||||||
F-26
| Revenues (International Business segment) |
||||||||||||
| Advisory fees |
$ | 10,754 | $ | 7,399 | $ | 4,156 | ||||||
| Other (loss)/income |
(234 | ) | (443 | ) | 67 | |||||||
|
|
|
|
|
|
|
|||||||
| Total revenues (International Business segment) |
$ | 10,520 | $ | 6,956 | $ | 4,223 | ||||||
|
|
|
|
|
|
|
|||||||
| Total revenues |
$ | 237,399 | $ | 219,446 | $ | 298,942 | ||||||
|
|
|
|
|
|
|
|||||||
| Income/(loss) before taxes |
||||||||||||
| U.S. Business segment |
$ | 70,537 | $ | 74,721 | $ | 146,335 | ||||||
| International Business segment |
(12,345 | ) | (19,159 | ) | (9,150 | ) | ||||||
|
|
|
|
|
|
|
|||||||
| Total income before taxes |
$ | 58,192 | $ | 55,562 | $ | 137,185 | ||||||
|
|
|
|
|
|
|
Assets are not reported by segment as such information is not utilized by the chief operating decision maker. The vast majority of the Company’s assets are located in the U.S.
20. Subsequent Events
The Company has evaluated subsequent events through the date of issuance of the accompanying consolidated financial statements. There were no events requiring disclosure.
F-27
EXHIBIT INDEX
| Exhibit Number |
Description | |
| 101.INS | XBRL Instance Document | |
| 101.SCH | XBRL Taxonomy Extension Schema Document | |
| 101.CAL | XBRL Taxonomy Extension Calculation Linkbase Document | |
| 101.DEF | XBRL Taxonomy Extension Definition Linkbase Document | |
| 101.LAB | XBRL Taxonomy Extension Labels Linkbase Document | |
| 101.PRE | XBRL Taxonomy Extension Presentation Linkbase Document | |
SIGNATURES
Pursuant to the requirements of the Section 13 or 15(d) Securities Exchange Act of 1934, the Registrant has duly caused this report to be signed on its behalf by the undersigned hereunto duly authorized.
| WISDOMTREE INVESTMENTS, INC. | ||||||
| By: | /s/ JONATHAN L. STEINBERG | |||||
| Jonathan L. Steinberg | ||||||
| March 1, 2018 | Chief Executive Officer and Director | |||||
Pursuant to the requirements of the Securities Exchange Act of 1934, this report has been signed below by the following persons on behalf of the registrant and in the capacities indicated below on the 1st day of March, 2018.
| Signature |
Title | |
| /s/ JONATHAN L. STEINBERG Jonathan L. Steinberg |
President, Chief Executive Officer and Director (Principal Executive Officer) | |
| /s/ AMIT MUNI Amit Muni |
Executive Vice President—Finance and Chief Financial Officer (Principal Financial and Accounting Officer) | |
| /s/ MICHAEL STEINHARDT Michael Steinhardt |
Non-Executive Chairman of the Board | |
| /s/ STEVEN L. BEGLEITER Steven L. Begleiter |
Director | |
| /s/ ANTHONY BOSSONE Anthony Bossone |
Director | |
| /s/ BRUCE I. LAVINE Bruce I. Lavine |
Director | |
| /s/ WIN NEUGER Win Neuger |
Director | |
| /s/ FRANK SALERNO Frank Salerno |
Director | |