Table of Contents


UNITED STATES

SECURITIES AND EXCHANGE COMMISSION

Washington, D.C. 20549


Form 10-Q


(Mark One)

QUARTERLY REPORT PURSUANT TO SECTION 13 OR 15(d) OF THE SECURITIES EXCHANGE ACT OF 1934

For the quarterly period ended March 31, 2019

or


TRANSITION REPORT PURSUANT TO SECTION 13 OR 15(d) OF THE SECURITIES EXCHANGE ACT OF 1934

For the transition period from                      to                     .

Commission File Number 001-10932


WisdomTree Investments, Inc.

(Exact name of registrant as specified in its charter)


Delaware   13-3487784

(State or other jurisdiction of

incorporation or organization)


(IRS Employer

Identification No.)


245 Park Avenue, 35th Floor

New York, New York

  10167
(Address of principal executive offices)   (Zip Code)

212-801-2080

(Registrant’s telephone number, including area code)


Indicate by check mark whether the registrant (1) has filed all reports required to be filed by Section 13 or 15(d) of the Securities Exchange Act of 1934, as amended (the “Exchange Act”) during the preceding 12 months (or for such shorter period that the registrant was required to file such reports), and (2) has been subject to such filing requirements for the past 90 days.    Yes  ☒    No  ☐

Indicate by check mark whether the registrant has submitted electronically every Interactive Data File required to be submitted pursuant to Rule 405 of Regulation S-T (§232.405 of this chapter) during the preceding 12 months (or for such shorter period that the registrant was required to submit such files).    ☒  Yes    ☐  No

Indicate by check mark whether the registrant is a large accelerated filer, an accelerated filer, a non-accelerated filer, a smaller reporting company, or emerging growth company. See definitions of “large accelerated filer,” “accelerated filer,” “smaller reporting company” and “emerging growth company” in Rule 12b-2 of the Exchange Act.


Large accelerated filer


Accelerated filer


Non-accelerated filer


Smaller reporting company


Emerging growth company


If an emerging growth company, indicate by check mark if the registrant has elected not to use the extended transition period for complying with any new or revised financial accounting standards provided pursuant to Section 13(a) of the Exchange Act  ☐

Indicate by check mark whether the registrant is a shell company (as defined in Rule 12b-2 of the Exchange Act).    Yes  ☐    No  ☒

Securities registered pursuant to Section 12(b) of the Exchange Act:


Title of each class


Trading Symbol(s)


Name of each exchange on which registered

Common Stock, $0.01 par value   WETF   The NASDAQ Stock Market LLC

As of April 26, 2019, there were 155,053,303 shares of the registrant’s Common Stock, $0.01 par value per share, outstanding.


Table of Contents

WISDOMTREE INVESTMENTS, INC.

Form 10-Q

For the Quarterly Period Ended March 31, 2019

TABLE OF CONTENTS


     Page
Number
 

PART I: FINANCIAL INFORMATION

     4  

Item 1. Financial Statements

     4  

Item  2. Management’s Discussion and Analysis of Financial Condition and Results of Operations

     33  

Item 3. Quantitative and Qualitative Disclosures about Market Risk

     49  

Item 4. Controls and Procedures

     50  

PART II: OTHER INFORMATION

     50  

Item 1. Legal Proceedings

     50  

Item 1A. Risk Factors

     50  

Item 2. Unregistered Sales of Equity Securities and Use of Proceeds

     50  

Item 3. Defaults Upon Senior Securities

     51  

Item 4. Mine Safety Disclosures

     51  

Item 5. Other Information

     51  

Item 6. Exhibits

     52  


2


Table of Contents

CAUTIONARY NOTE REGARDING FORWARD-LOOKING STATEMENTS

This Quarterly Report on Form 10-Q contains forward-looking statements that are based on our management’s beliefs and assumptions and on information currently available to our management. Although we believe that the expectations reflected in these forward-looking statements are reasonable, these statements relate to future events or our future financial performance, and involve known and unknown risks, uncertainties and other factors that may cause our actual results, levels of activity, performance or achievements to be materially different from any future results, levels of activity, performance or achievements expressed or implied by these forward-looking statements.

In some cases, you can identify forward-looking statements by terminology such as “may,” “will,” “should,” “expects,” “intends,” “plans,” “anticipates,” “believes,” “estimates,” “predicts,” “potential,” “continue” or the negative of these terms or other comparable terminology. These statements are only predictions. You should not place undue reliance on forward-looking statements because they involve known and unknown risks, uncertainties and other factors, which are, in some cases, beyond our control and which could materially affect our results. Factors that may cause actual results to differ materially from current expectations include, among other things, those listed in the section entitled “Risk Factors” included in our Annual Report on Form 10-K for the fiscal year ended December 31, 2018. If one or more of these or other risks or uncertainties occur, or if our underlying assumptions prove to be incorrect, actual events or results may vary significantly from those implied or projected by the forward-looking statements. No forward-looking statement is a guarantee of future performance. You should read this Report and the documents that we reference in this Report and have filed with the Securities and Exchange Commission, or the SEC, as exhibits to this Report, completely and with the understanding that our actual future results may be materially different from any future results expressed or implied by these forward-looking statements.

In particular, forward-looking statements in this Report may include statements about:


anticipated trends, conditions and investor sentiment in the global markets and exchange traded products, or ETPs;


anticipated levels of inflows into and outflows out of our ETPs;


our ability to deliver favorable rates of return to investors;


competition in our business;


our ability to develop new products and services;


our ability to maintain current vendors or find new vendors to provide services to us at favorable costs;


our ability to successfully operate and expand our business in non-U.S. markets; and


the effect of laws and regulations that apply to our business.

The forward-looking statements in this Report represent our views as of the date of this Report. We anticipate that subsequent events and developments may cause our views to change. However, while we may elect to update these forward-looking statements at some point in the future, we have no current intention of doing so except to the extent required by applicable law. Therefore, these forward-looking statements do not represent our views as of any date other than the date of this Report.


3


Table of Contents

PART I: FINANCIAL INFORMATION


ITEM 1.

FINANCIAL STATEMENTS

WisdomTree Investments, Inc. and Subsidiaries

Consolidated Balance Sheets

(In Thousands, Except Per Share Amounts)


     March 31,
2019
    December 31,
2018
 
Assets    (unaudited)        

Current assets:


Cash and cash equivalents

   $ 78,942     $ 77,784  

Securities owned, at fair value

     6,419       8,873  

Accounts receivable

     28,136       25,834  

Income taxes receivable

     1,770       1,181  

Prepaid expenses

     4,037       4,441  

Other current assets

     164       163  


Total current assets

     119,468       118,276  

Fixed assets, net

     8,863       9,122  

Note receivable, net (Note 8)

     29,317       28,722  

Indemnification receivable (Note 21)

     31,593       34,876  

Securities held-to-maturity

     20,159       20,180  

Deferred tax assets, net

     3,998       7,042  

Investments, carried at cost (Note 9)

     28,080       28,080  

Right of use assets – operating leases (Note 14)

     19,446       —    

Goodwill (Note 23)

     85,856       85,856  

Intangible assets (Note 23)

     603,251       603,209  

Other noncurrent assets

     1,486       2,155  


Total assets

   $ 951,517     $ 937,518  


Liabilities and stockholders’ equity


Liabilities


Current liabilities:


Fund management and administration payable

   $ 26,921     $ 22,508  

Compensation and benefits payable

     9,214       18,453  

Deferred consideration – gold payments (Note 11)

     11,857       11,765  

Securities sold, but not yet purchased, at fair value

     1,338       1,698  

Operating lease liabilities (Note 14)

     3,651       —    

Accounts payable and other liabilities

     9,772       8,377  


Total current liabilities

     62,753       62,801  

Long-term debt (Note 12)

     195,174       194,592  

Deferred consideration – gold payments (Note 11)

     145,290       149,775  

Operating lease liabilities (Note 14)

     20,704       —    

Deferred rent payable

     —         4,570  

Other noncurrent liabilities (Note 21)

     31,593       34,876  


Total liabilities

     455,514       446,614  


Preferred stock – Series A Non-Voting Convertible, par value $0.01; 14.750 shares authorized, issued and outstanding (Note 13)

     132,569       132,569  


Contingencies (Note 15)


Stockholders’ equity


Preferred stock, par value $0.01; 2,000 shares authorized:

     —         —    

Common stock, par value $0.01; 250,000 shares authorized; issued and outstanding: 155,056 and 153,202 at March 31, 2019 and December 31, 2018, respectively

     1,551       1,532  

Additional paid-in capital

     364,717       363,655  

Accumulated other comprehensive income

     758       467  

Accumulated deficit

     (3,592     (7,319


Total stockholders’ equity

     363,434       358,335  


Total liabilities and stockholders’ equity

   $ 951,517     $ 937,518  


The accompanying notes are an integral part of these consolidated financial statements


4


Table of Contents

WisdomTree Investments, Inc. and Subsidiaries

Consolidated Statements of Operations

(In Thousands, Except Per Share Amounts)

(Unaudited)


     Three Months Ended March 31,  
     2019     2018  

Operating Revenues:


Advisory fees

   $ 64,840     $ 58,456  

Other income

     645       448  


Total revenues

     65,485       58,904  

Operating Expenses:


Compensation and benefits

     21,301       18,832  

Fund management and administration

     15,166       10,912  

Marketing and advertising

     2,680       3,195  

Sales and business development

     4,422       3,813  

Contractual gold payments (Note 11)

     3,098       —    

Professional and consulting fees

     1,482       1,636  

Occupancy, communications and equipment

     1,618       1,363  

Depreciation and amortization

     269       355  

Third-party distribution fees

     2,400       1,725  

Acquisition-related costs (Note 3)

     313       2,062  

Other

     2,053       1,790  


Total expenses

     54,802       45,683  


Operating income

     10,683       13,221  

Other Income/(Expenses):


Interest expense

     (2,892     —    

Gain on revaluation of deferred consideration – gold payments (Note 11)

     4,404       —    

Interest income

     779       962  

Impairment (Note 14)

     (572     —    

Other losses, net

     (4,627     (261


Income before taxes

     7,775       13,922  

Income tax (benefit)/expense

     (1,049     4,498  


Net income

   $ 8,824     $ 9,424  


Earnings per share—basic

   $ 0.05     $ 0.07  


Earnings per share—diluted

   $ 0.05     $ 0.07  


Weighted-average common shares—basic

     151,625       135,329  


Weighted-average common shares—diluted

     166,811       136,468  


Cash dividends declared per common share

   $ 0.03     $ 0.03  


The accompanying notes are an integral part of these consolidated financial statements


5


Table of Contents

WisdomTree Investments, Inc. and Subsidiaries

Consolidated Statements of Comprehensive Income

(In Thousands)

(Unaudited)


     Three Months Ended March 31,  
     2019      2018  

Net income

   $ 8,824      $ 9,424  

Other comprehensive income


Change in unrealized gains on available-for-sale debt securities, net of tax

     —          460  

Foreign currency translation adjustment

     291        412  


Other comprehensive income

     291        872  


Comprehensive income

   $ 9,115      $ 10,296  


The accompanying notes are an integral part of these consolidated financial statements


6


Table of Contents

WisdomTree Investments, Inc. and Subsidiaries

Consolidated Statements of Changes in Stockholders’ Equity

(In Thousands)

(Unaudited)


     For the Three Months Ended March 31, 2019  
     Common Stock     Additional
Paid-In
Capital
    Accumulated
Other
     Accumulated
Deficit
    Total  
     Shares
Issued
    Par
Value
    Comprehensive
Income
 

Balance—January 1, 2019

     153,202     $ 1,532     $ 363,655     $ 467      $ (7,319   $ 358,335  

Restricted stock issued and vesting of restricted stock units, net

     2,145       21       (21     —          —         —    

Shares repurchased

     (311     (2     (2,003     —          —         (2,005

Exercise of stock options, net

     20       —         14       —          —         14  

Stock-based compensation

     —         —         3,072       —          —         3,072  

Other comprehensive income

     —         —         —         291        —         291  

Dividends

     —         —         —         —          (5,097     (5,097

Net income

     —         —         —         —          8,824       8,824  


Balance—March 31, 2019

     155,056     $ 1,551     $ 364,717     $ 758      $ (3,592   $ 363,434  


     For the Three Months Ended March 31, 2018  
     Common Stock      Additional
Paid-In
Capital
    Accumulated
Other
     Accumulated
Deficit
    Total  
     Shares
Issued
    Par
Value
    Comprehensive
Income
 

Balance—January 1, 2018

     136,996     $ 1,370      $ 216,006     $ 291      $ (24,716   $ 192,951  

Restricted stock issued and vesting of restricted stock units, net

     667       7        (7     —          —         —    

Shares repurchased

     (60     —          (734     —          —         (734

Exercise of stock options, net

     148       1        53       —          —         54  

Stock-based compensation

     —         —          3,309       —          —         3,309  

Stock issuance costs

     —         —          (139     —          —         (139

Other comprehensive income

     —         —          —         872        —         872  

Dividends

     —         —          —         —          (4,132     (4,132

Net income

     —         —          —         —          9,424       9,424  


Balance—March 31, 2018

     137,751     $ 1,378      $ 218,488     $ 1,163      $ (19,424   $ 201,605  


The accompanying notes are an integral part of these consolidated financial statements


7


Table of Contents

WisdomTree Investments, Inc. and Subsidiaries

Consolidated Statements of Cash Flows

(In Thousands)

(Unaudited)


     Three Months Ended March 31,  
     2019     2018  

Cash flows from operating activities:


Net income

   $ 8,824     $ 9,424  

Adjustments to reconcile net income to net cash provided by/(used in) operating activities:


Advisory fees received in gold and other precious metals

     (11,389     —    

Gain on revaluation of deferred consideration

     (4,404     —    

Contractual gold payments

     3,098       —    

Stock-based compensation

     3,072       3,309  

Deferred income taxes

     3,048       (136

Amortization of right of use asset

     798       —    

Amortization of credit facility issuance costs

     711       —    

Paid-in-kind interest income (Note 8)

     (595     (416

Impairment

     572       —    

Depreciation and amortization

     269       355  

Other

     3       661  

Changes in operating assets and liabilities:


Securities owned, at fair value

     2,454       1,106  

Accounts receivable

     (1,939     606  

Income taxes receivable/payable

     (604     4,297  

Prepaid expenses

     419       (360

Gold and other precious metals

     7,975       —    

Other assets

     182       160  

Fund management and administration payable

     4,274       (1,744

Compensation and benefits payable

     (9,250     (22,003

Securities sold, but not yet purchased, at fair value

     (360     (950

Operating lease liabilities

     (881     —    

Accounts payable and other liabilities

     1,575       855  


Net cash provided by/(used in) operating activities

     7,852       (4,836


Cash flows from investing activities:


Purchase of fixed assets

     (7     (17

Proceeds from held-to-maturity securities maturing or called prior to maturity

     18       32  

Proceeds from sales and maturities of debt securities available-for-sale

     —         60,498  


Net cash provided by investing activities

     11       60,513  


Cash flows from financing activities:


Dividends paid

     (5,097     (4,132

Shares repurchased

     (2,005     (734

Proceeds from exercise of stock options

     14       54  


Net cash used in financing activities

     (7,088     (4,812


Increase in cash flow due to changes in foreign exchange rate

     383       593  


Net increase in cash and cash equivalents

     1,158       51,458  

Cash and cash equivalents—beginning of period

     77,784       54,193  


Cash and cash equivalents—end of period

   $ 78,942     $ 105,651  


Supplemental disclosure of cash flow information:


Cash paid for taxes

   $ 707     $ 339  


Cash paid for interest

   $ 2,224     $ —    


NON-CASH ACTIVITIES

On January 1, 2019, the Company recognized a right-of-use asset and lease liability of $19,827 and $24,817, respectively, upon the implementation of Accounting Standards Update 2016-02 Leases. See Note 14 for additional information.

The accompanying notes are an integral part of these consolidated financial statements


8


Table of Contents

WisdomTree Investments, Inc. and Subsidiaries

Notes to Consolidated Financial Statements

(In Thousands, Except Share and Per Share Amounts)

1. Organization and Description of Business

WisdomTree Investments, Inc., through its global subsidiaries (collectively, “WisdomTree” or the “Company”), is an exchange-traded product (“ETP”) sponsor and asset manager headquartered in New York. WisdomTree offers ETPs covering equity, commodity, fixed income, leveraged and inverse, currency and alternative strategies. The Company has the following wholly-owned operating subsidiaries:


WisdomTree Asset Management, Inc. is a New York based investment adviser registered with the SEC, providing investment advisory and other management services to the WisdomTree Trust (“WTT”) and WisdomTree exchange-traded funds (“ETFs”). The WisdomTree ETFs are issued in the U.S. by WTT. WTT, a non-consolidated third party, is a Delaware statutory trust registered with the SEC as an open-end management investment company. The Company has licensed to WTT the use of certain of its own indexes on an exclusive basis for the WisdomTree ETFs in the U.S.


ETFS Management Company (Jersey) Limited (“ManJer”) is a Jersey based management company providing management services to nine issuers (the “ETFS Issuers”) in respect of the ETPs issued and listed by the ETFS Issuers covering commodity, currency and leveraged-and-inverse strategies.


Boost Management Limited (“BML”) is a Jersey based management company providing management services to Boost Issuer PLC (“BI”) in respect of the Boost ETPs issued by BI. BI, a non-consolidated third party, is a public limited company domiciled in Ireland.


WisdomTree Management Limited (“WML”) is an Ireland based management company providing management services to WisdomTree Issuer plc (“WTI”) in respect of the WisdomTree UCITS ETFs issued by WTI. WTI, a non-consolidated third party, is a public limited company domiciled in Ireland.


WisdomTree UK Limited (“WTUK”) is a U.K. based company registered with the Financial Conduct Authority currently providing distribution and support services to ManJer, BML and WML.


WisdomTree Europe Limited is a U.K. based company which is the legacy distributor of the Boost ETPs and WisdomTree UCITS ETFs. These services are now provided directly by WTUK. WisdomTree Europe Limited is no longer regulated and does not provide any regulated services.


WisdomTree Ireland Limited is an Ireland based company authorized by the Central Bank of Ireland providing distribution services to ManJer, BML and WML.


WisdomTree Asset Management Canada, Inc. (“WTAMC”) is a Canada based investment fund manager registered with the Ontario Securities Commission providing fund management services to locally-listed WisdomTree Canadian ETFs.


WisdomTree Commodity Services, LLC (“WTCS”) is a New York based company that serves as the managing owner and commodity pool operator of the WisdomTree Continuous Commodity Index Fund. WTCS is registered with the Commodity Futures Trading Commission and is a member of the National Futures Association.

Acquisition of ETFS

On April 11, 2018, the Company acquired the European exchange-traded commodity, currency and leveraged-and-inverse business (“ETFS”) of ETFS Capital Limited (“ETFS Capital”, formerly known as ETF Securities Limited). This acquisition is referred to throughout the consolidated financial statements as the ETFS Acquisition. See Note 3 for additional information.

Restructuring of Distribution Strategy in Japan

In July 2018, the Company determined to restructure its distribution strategy in Japan and has expanded its existing relationship with Premia Partners Company Limited to manage distribution of the Company’s ETFs in Japan. As a result, WisdomTree Japan Inc. (“WTJ”) has ceased operations and is in the process of being liquidated. During the three months ended March 31, 2019 and 2018, WTJ reported an operating loss of $430 and $1,232, respectively. WTJ also recognized an impairment expense of $572 in connection with the termination of its office lease on March 31, 2019.


9


Table of Contents

2. Significant Accounting Policies

Basis of Presentation

These consolidated financial statements have been prepared in conformity with U.S. generally accepted accounting principles (“GAAP”) and in the opinion of management reflect all adjustments, consisting of only normal recurring adjustments, necessary for a fair statement of financial condition, results of operations, and cash flows for the periods presented. The consolidated financial statements include the accounts of the Company’s wholly-owned subsidiaries. All intercompany accounts and transactions have been eliminated in consolidation.

The financial results of ETFS are included in the Company’s consolidated financial statements since the acquisition date, April 11, 2018 (See Note 3).

Certain accounts in the consolidated financial statements for the three months ended March 31, 2018 have been reclassified to conform to the current year’s consolidated financial statement presentation. The following table summarizes these reclassifications which had no effect on previously reported net income.


Operating Revenues:    Three Months
Ended
March 31, 2018
 

Advisory fees (previously reported)

   $ 58,756  

Other ETP fees reclassified to Other income

     (300


Advisory fees (currently reported)

   $ 58,456  


Other income (previously reported)

   $ 849  

Other ETP fees reclassified from Advisory fees

     300  

Interest income reclassified to Other Income/(Expenses)

     (962

Realized and unrealized losses reclassified to Other losses, net

     261  


Other income (currently reported)

   $ 448  


Total revenues (currently reported)

   $ 58,904  


Other Income/(Expenses):


Interest income reclassified from operating revenues

   $ 962  


Other losses, net (previously reported)

   $ —  

Realized and unrealized losses reclassified from operating revenues

     (261


Other losses, net (currently reported)

   $ (261


Consolidation

The Company consolidates entities in which it has a controlling financial interest. The Company determines whether it has a controlling financial interest in an entity by first evaluating whether the entity is a voting interest entity (“VOE”) or a variable interest entity (“VIE”). The usual condition for a controlling financial interest in a VOE is ownership of a majority voting interest. If the Company has a majority voting interest in a VOE, the entity is consolidated. The Company has a controlling financial interest in a VIE when the Company has a variable interest that provides it with (i) the power to direct the activities of the VIE that most significantly impact the VIE’s economic performance and (ii) the obligation to absorb losses of the VIE or the right to receive benefits from the VIE that could potentially be significant to the VIE.

The Company reassesses its evaluation of whether an entity is a VIE when certain reconsideration events occur.

Segment and Geographic Information

The Company operates as an ETP sponsor and asset manager providing investment advisory services globally. These activities are reported in the Company’s U.S. Business and International Business reportable segments. The International Business reportable segment includes the results of the Company’s European operations and Canadian operations.

The financial results of ETFS are included in the International Business reportable segment as of the acquisition date.


10


Table of Contents

Foreign Currency Translation

Assets and liabilities of subsidiaries whose functional currency is not the U.S. dollar are translated based on the end of period exchange rates from local currency to U.S. dollars. Results of operations are translated at the average exchange rates in effect during the period. The impact of the foreign currency translation adjustment is included in the Consolidated Statements of Comprehensive Income as a component of other comprehensive income.    

Use of Estimates

The preparation of the Company’s consolidated financial statements in conformity with U.S. GAAP requires management to make estimates and assumptions that affect the reported amounts of assets and liabilities as of the balance sheet dates and the reported amounts of revenues and expenses for the periods presented. Actual results could differ materially from those estimates.

Revenue Recognition

The Company earns substantially all of its revenue in the form of advisory fees from its ETPs and recognizes this revenue over time, as the performance obligation is satisfied. ETP advisory fees are based on a percentage of the ETPs’ average daily net assets. Progress is measured using the practical expedient under the output method resulting in the recognition of revenue in the amount for which the Company has a right to invoice.

Contractual Gold Payments

Contractual gold payments are measured and paid monthly based upon the average daily spot price of gold (See Note 11).

Marketing and Advertising

Advertising costs, including media advertising and production costs, are expensed when incurred.

Depreciation and Amortization

Depreciation is provided for using the straight-line method over the estimated useful lives of the related assets as follows:


Equipment

     5 years  

Furniture and fixtures

     15 years  

Leasehold improvements are amortized over the term of their respective leases or service lives of the improvements, whichever is shorter. Fixed assets are recorded at cost less accumulated depreciation and amortization.

Stock-Based Awards

Accounting for stock-based compensation requires the measurement and recognition of compensation expense for all equity awards based on estimated fair values. Stock-based compensation is measured based on the grant-date fair value of the award and is amortized over the relevant service period. Forfeitures are recognized when they occur.

Third-Party Distribution Fees

The Company pays a percentage of its advisory fee revenues based on incremental growth in AUM, subject to caps or minimums, to marketing agents to sell WisdomTree ETFs and for including WisdomTree ETFs on third-party customer platforms.

Cash and Cash Equivalents

The Company considers all highly liquid investments with an original maturity of 90 days or less at the time of purchase to be classified as cash equivalents. The Company maintains deposits with financial institutions in an amount that is in excess of federally insured limits.

Accounts Receivable and Allowance for Doubtful Accounts

Accounts receivable are customer and other obligations due under normal trade terms. An allowance for doubtful accounts is not provided since, in the opinion of management, all accounts receivable recorded are deemed current and collectible.


11


Table of Contents

Impairment of Long-Lived Assets

The Company performs a review for the impairment of long-lived assets when events or changes in circumstances indicate that the estimated undiscounted future cash flows expected to be generated by the assets are less than their carrying amounts or when other events occur which may indicate that the carrying amount of an asset may not be recoverable.

Note Receivable

Note receivable is accounted for on an amortized cost basis, net of original issue discount. Interest income is accrued over the term of the note using the effective interest method. The Company performs a review for the impairment of the note receivable on a quarterly basis and provides for an allowance for credit losses if all or a portion of the note is determined to be uncollectible.

Securities Owned and Securities Sold, but not yet Purchased (at fair value)

Securities owned and securities sold, but not yet purchased are securities classified as either trading or available-for-sale. These securities are recorded on their trade date and are measured at fair value. All equity securities are classified by the Company as trading. Debt securities are classified based primarily on the Company’s intent to hold or sell the security. Changes in the fair value of securities classified as trading are reported in other income in the period the change occurs. Unrealized gains and losses of securities classified as available-for-sale are included in other comprehensive income. Once sold, amounts reclassified out of accumulated other comprehensive income and into earnings are determined using the specific identification method. Available-for-sale securities are assessed for impairment on a quarterly basis.

Securities Held-to-Maturity

The Company accounts for certain of its investments as held-to-maturity on a trade date basis, which are recorded at amortized cost. For held-to-maturity investments, the Company has the intent and ability to hold investments to maturity and it is not more-likely-than-not that the Company will be required to sell the investments before recovery of their amortized cost bases, which may be maturity. On a quarterly basis, the Company reviews its portfolio of investments for impairment. If a decline in fair value is deemed to be other-than-temporary, the security is written down to its fair value through earnings.

Investments, Carried at Cost

The Company accounts for equity investments that do not have a readily determinable fair value as cost method investments under the measurement alternative prescribed within Accounting Standards Update (“ASU”) 2016-01, Financial Instruments – Recognition and Measurement of Financial Assets and Financial Liabilities, to the extent such investments are not subject to consolidation or the equity method. Under the measurement alternative, these financial instruments are carried at cost, less any impairment (assessed quarterly), plus or minus changes resulting from observable price changes in orderly transactions for an identical or similar investment of the same issuer. In addition, income is recognized when dividends are received only to the extent they are distributed from net accumulated earnings of the investee. Otherwise, such distributions are considered returns of investment and are recorded as a reduction of the cost of the investment.

Goodwill

Goodwill is the excess of the fair value of the purchase price over the fair values of the identifiable net assets at the acquisition date. The Company tests its goodwill for impairment at least annually and at the time of a triggering event requiring re-evaluation, if one were to occur, in accordance with ASU 2017-04, Intangibles-Goodwill and Other (Topic 350): Simplifying the Test for Goodwill Impairment. The Company early adopted the revised guidance for the impairment tests performed after January 1, 2017. Under the revised guidance, goodwill is considered impaired when the estimated fair value of the reporting unit that was allocated the goodwill is less than its carrying value. If the estimated fair value of such reporting unit is less than its carrying value, goodwill impairment is recognized based on that difference, not to exceed the carrying amount of goodwill. A reporting unit is an operating segment or a component of an operating segment provided that the component constitutes a business for which discrete financial information is available and management regularly reviews the operating results of that component.

For impairment testing purposes, goodwill has been allocated to the Company’s U.S. Business reporting unit which is assessed annually for impairment on April 30th. In addition, goodwill arising from the ETFS Acquisition (See Note 3) has been allocated to the European Business reporting unit, included within the International Business reportable segment and is assessed annually for impairment on November 30th. When performing its goodwill impairment test, the Company considers a qualitative assessment, when appropriate, and the income approach, market approach and its market capitalization when determining the fair value of its reporting units.


12


Table of Contents

Intangible Assets

Indefinite-lived intangible assets are tested for impairment at least annually and are also reviewed for impairment whenever events or changes in circumstances indicate that the carrying amount of an asset may not be recoverable. Indefinite-lived intangible assets are impaired if their estimated fair values are less than their carrying values.

Finite-lived intangible assets, if any, are amortized over their estimated useful life, which is the period over which the assets are expected to contribute directly or indirectly to the future cash flows of the Company. These intangible assets are tested for impairment at the time of a triggering event, if one were to occur. Finite-lived intangible assets may be impaired when the estimated undiscounted future cash flows generated from the assets are less than their carrying amounts.

The Company may rely on a qualitative assessment when performing its intangible asset impairment test. Otherwise, the impairment evaluation is performed at the lowest level of reasonably identifiable cash flows independent of other assets. The annual impairment testing date for all of the Company’s intangible assets is November 30th.

Leases

Effective January 1, 2019, the Company accounts for its lease obligations in accordance with Accounting Standards Codification (“ASC”) Topic 842, Leases (“ASC 842”), which requires the recognition of both (i) a lease liability equal to the present value of the remaining lease payments and (ii) an offsetting right-of-use asset (See Note 14). The remaining lease payments are discounted using the rate implicit in the lease, if known, or otherwise the Company’s incremental borrowing rate. After lease commencement, right-of-use assets are assessed for impairment and otherwise are amortized over the remaining lease term on a straight-line basis. These recognition requirements are not applied to short-term leases which are those with a lease term of 12 months or less. Instead, lease payments associated with short-term leases are recognized as an expense on a straight-line basis over the lease term.

ASC 842 also provides a practical expedient which allows for consideration in a contract to be accounted for as a single lease component rather than allocated between lease and non-lease components. The Company has elected to apply this practical expedient to all lease contracts, where applicable.

Upon adoption of ASC 842 on January 1, 2019, the Company applied the transitional practical expedients to its outstanding leases and therefore the Company did not reassess (i) whether any expired or existing contracts are or contain leases; (ii) the lease classification for any expired or existing leases and; (iii) initial direct costs for any existing leases. The Company also elected to apply the new lease requirements at the effective date, rather than the beginning of the earliest comparative period presented.

Deferred Consideration – Gold Payments

Deferred consideration represents the present value of an obligation to pay gold to a third party into perpetuity and is measured using forward-looking gold prices and a selected discount rate (See Note 11). Changes in the fair value of this obligation are reported as gain/(loss) on revaluation of deferred consideration – gold payments on the Company’s Consolidated Statements of Operations.

Long-Term Debt

Long-term debt is carried at amortized cost, net of debt issuance costs. Interest expense is recognized using the effective interest method and includes amortization of debt issuance costs over the life of the debt.

Earnings per Share

Basic earnings per share (“EPS”) is computed by dividing net income available to common stockholders by the weighted-average number of common shares outstanding for the period. Net income available to common stockholders represents net income of the Company reduced by an allocation of earnings to participating securities. The preferred stock issued in connection with the ETFS Acquisition (see Note 13) and unvested share-based payment awards that contain non-forfeitable rights to dividends or dividend equivalents (whether paid or unpaid) are participating securities and are included in the computation of EPS pursuant to the two-class method. Share-based payment awards that do not contain such rights are not deemed participating securities and are included in diluted shares outstanding (if dilutive) under the treasury stock method. Diluted EPS reflects the reduction in earnings per share assuming dilutive options or other dilutive contracts to issue common stock were exercised or converted into common stock. Diluted EPS is calculated under the treasury stock and if-converted method and the two-class method. The calculation that results in the most dilutive EPS amount for the common stock is reported in the Company’s consolidated financial statements.


13


Table of Contents

Income Taxes

The Company accounts for income taxes using the liability method, which requires the determination of deferred tax assets and liabilities based on the differences between the financial and tax bases of assets and liabilities using the enacted tax rates in effect for the year in which differences are expected to reverse. Deferred tax assets are reduced by a valuation allowance if, based on the weight of available evidence, it is more-likely-than-not that some portion or all the deferred tax assets will not be realized.

Tax positions are evaluated utilizing a two-step process. The Company first determines whether any of its tax positions are more-likely-than-not to be sustained upon examination, based solely on the technical merits of the position. Once it is determined that a position meets this recognition threshold, the position is measured as the largest amount of benefit that is greater than 50% likely of being realized upon ultimate settlement. The Company records interest expense and penalties related to tax expenses as income tax expense.

Non-income based taxes are recorded as part of other liabilities and other expenses.

Recently Issued Accounting Pronouncements

In June 2016, the FASB issued ASU 2016-13, Financial Instruments-Credit Losses (Topic 326) – Measurement of Credit Losses on Financial Instruments (ASU 2016-13). The main objective of the standard is to provide financial statement users with more decision-useful information about the expected credit losses on financial instruments and other commitments to extend credit held by a reporting entity at each reporting date. In issuing this standard, the FASB is responding to criticism that today’s guidance delays recognition of credit losses. The standard will replace today’s “incurred loss” approach with an “expected loss” model. The new model, referred to as the current expected credit loss (“CECL”) model, will apply to: (1) financial assets subject to credit losses and measured at amortized cost, and (2) certain off-balance sheet credit exposures. The standard is applicable to loans, accounts receivable, trade receivables, and other financial assets measured at amortized cost, loan commitments and certain other off-balance sheet credit exposures, debt securities (including those held-to-maturity) and other financial assets measured at fair value through other comprehensive income, and beneficial interests in securitized financial assets. The CECL model does not apply to available-for-sale debt securities. For available-for-sale debt securities with unrealized losses, entities will measure credit losses in a manner similar to what they do today, except that the credit losses will be recognized as allowances rather than reductions in the amortized cost of the securities. Accordingly, the new methodology will be utilized when assessing the Company’s financial instruments for impairment. As a result, entities will recognize improvements to estimated credit losses immediately in earnings rather than as interest income over time, as they do today. The ASU also simplifies the accounting model for purchased credit-impaired debt securities and loans. ASU 2016-13 also expands the disclosure requirements regarding an entity’s assumptions, models, and methods for estimating the allowance for loan and lease losses. ASU 2016-13 is effective for years beginning after December 15, 2019, including interim periods within those fiscal years under a modified retrospective approach. Early adoption is permitted for the periods beginning after December 15, 2018. The Company is currently evaluating the impact that this standard will have on its consolidated financial statements and plans to adopt this standard on January 1, 2020.

In August 2018, the FASB issued ASU 2018-13, Fair Value Measurement (Topic 820) – Disclosure Framework – Changes to the Disclosure Requirements for Fair Value Measurement (ASU 2018-13), which modifies the disclosure requirements on fair value measurements, including removing the requirement to disclose (1) the amount of and reasons for transfers between Level 1 and Level 2 of the fair value hierarchy, (2) the policy for timing of transfers between levels and (3) the valuation processes for Level 3 fair value measurements. ASU 2018-13 also added new disclosures including the requirement to disclose (a) the changes in unrealized gains and losses for the period included in other comprehensive income for recurring Level 3 fair value measurements held at the end of the reporting period and (b) the range and weighted average of significant unobservable inputs used to develop Level 3 fair value measurements. ASU 2018-13 is effective for fiscal years (and interim reporting periods within those years) beginning after December 15, 2019 and early adoption is permitted. This standard will only impact the disclosures pertaining to fair value measurements. The Company plans to adopt this standard on January 1, 2020.

3. Business Combination

Summary

On April 11, 2018, the Company acquired from ETFS Capital its European exchange-traded commodity, currency and short-and-leveraged business for a purchase price consisting of $253,000 in cash, and a fixed number of shares of the Company’s capital stock, consisting of (i) 15,250,000 shares of common stock (the “Common Shares”) and (ii) 14,750 shares of Series A Non-Voting Convertible Preferred Stock (the “Preferred Shares”), which are convertible into an aggregate of 14,750,000 shares of common stock. ETFS Capital is subject to lock-up, standstill and voting restrictions and received registration rights with respect to the Common Shares and shares issuable upon conversion of the Preferred Shares.

Also on April 11, 2018 and in connection with the acquisition, the Company entered into a credit agreement, pursuant to which the lenders extended a $200,000 term loan (the “Term Loan”) and made available a $50,000 revolving credit facility (the “Revolver” and, together with the Term Loan, the “Credit Facility”) (See Note 12).


14


Table of Contents

Purchase Price Allocation

The ETFS Acquisition has been accounted for under the acquisition method of accounting in accordance with ASC Topic 805, Business Combinations, which requires an allocation of the consideration paid by the Company to the identifiable assets and liabilities of ETFS based on the estimated fair values as of the closing date of the acquisition. An allocation of the consideration transferred is presented below and includes the Company’s valuation of the fair value of tangible and intangible assets acquired and liabilities assumed.

The following table summarizes the allocation of the purchase price as of the acquisition date:


Purchase price


Preferred Shares issued

     14,750  

Conversion ratio

     1,000  


Common stock equivalents

     14,750,000  

Common Shares issued

     15,250,000  


Total shares issued

     30,000,000  

WisdomTree stock price(1)

   $ 9.00  


Equity portion of purchase price

   $ 270,000  

Cash portion of purchase price


Term Loan (See Note 12)

     200,000  

Cash on hand

     53,000  


Purchase price

     523,000  

Deferred consideration (See Note 11)

     172,746  


Total

   $ 695,746  

Allocation of consideration


Cash and cash equivalents

     13,687  

Receivables and other current assets

     14,069  

Intangible assets(2)

     601,247  

Other current liabilities

     (17,314


Fair value of net assets acquired

     611,689  


Goodwill resulting from the ETFS Acquisition (3)

   $ 84,057  


(1)

The closing price of the Company’s common stock on April 10, 2018, the trading day prior to the closing date of the acquisition.

(2)

Represents purchase price allocated to customary advisory agreements. The fair value of the intangible assets was determined using an income approach (discounted cash flow analysis) which relied upon significant unobservable inputs including a revenue growth multiple of 3% to 4% and a weighted average cost of capital of 11.6%. These intangible assets were determined to have an indefinite useful life and are not deductible for tax purposes. A deferred tax liability associated with these intangible assets was not recognized as the intangibles arose in Jersey, a jurisdiction where the Company is subject to a zero percent tax rate.

(3)

Goodwill arising from the ETFS Acquisition represents the value of synergies created from combining the operations of ETFS and the Company. The goodwill is not deductible for tax purposes as the transaction was structured as a stock acquisition occurring in the United Kingdom.

Acquisition-Related Costs

During the three months ended March 31, 2019 and 2018, the Company incurred acquisition-related costs of $313 and $2,062, respectively.


15


Table of Contents

Supplemental Unaudited Pro Forma Financial Information

The following table presents unaudited pro forma financial information of the Company as if the ETFS Acquisition had been consummated on January 1, 2017. The information was derived from the historical financial results of the Company and ETFS for all periods presented and was adjusted to give effect to pro forma events that are directly attributable to the acquisition, factually supportable and expected to have a continuing impact on the combined results following the acquisition.


    Three Months
Ended

March 31, 2018
     

Revenues

  $ 79,771  

Net income

  $ 11,243   (including a loss on revaluation of deferred consideration of $2,555)

Significant adjustments to the unaudited pro forma financial information above include the recognition of interest expense associated with the Credit Facility for the periods presented, eliminating acquisition-related costs directly attributable to the acquisition and adjusting consolidated income tax expense based upon the Company’s anticipated normalized consolidated effective tax rate.

The unaudited pro forma financial information above is not necessarily indicative of what the combined results of the Company would have been had the acquisition been completed as of January 1, 2017 and does not purport to project the future results of the combined company. In addition, the unaudited pro forma financial information does not reflect any future planned cost savings initiatives following the completion of the acquisition.

4. Cash and Cash Equivalents

Cash and cash equivalents of approximately $34,029 and $34,398 at March 31, 2019 and December 31, 2018, respectively, were held at one financial institution. At March 31, 2019 and December 31, 2018, cash equivalents were approximately $566 and $24, respectively.

In addition, certain of our subsidiaries of our International Business segment are required to maintain a minimum level of net liquid assets, which was $12,164 and $11,005 at March 31, 2019 and December 31, 2018, respectively. These requirements are generally satisfied by cash on hand.

5. Fair Value Measurements

The fair value of financial instruments is defined as the price that would be received to sell an asset or paid to transfer a liability (i.e., “the exit price”) in an orderly transaction between market participants at the measurement date. ASC 820, Fair Value Measurements, establishes a hierarchy for inputs used in measuring fair value that maximizes the use of observable inputs and minimizes the use of unobservable inputs by requiring that the most observable inputs be used when available. Observable inputs are inputs that market participants would use in pricing the asset or liability developed based on market data obtained from independent sources. Unobservable inputs reflect assumptions that market participants would use in pricing the asset or liability developed based on the best information available in the circumstances. The hierarchy is broken down into three levels based on the transparency of inputs as follows:


Level 1      Quoted prices for identical instruments in active markets.
Level 2      Quoted prices for similar instruments in active markets; quoted prices for identical or similar instruments in markets that are not active; and model-derived valuations whose inputs are observable or whose significant value drivers are observable.
Level 3      Instruments whose significant drivers are unobservable.

The availability of observable inputs can vary from product to product and is affected by a wide variety of factors, including, for example, the type of product, whether the product is new and not yet established in the marketplace, and other characteristics particular to the transaction. To the extent that valuation is based on models or inputs that are less observable or unobservable in the market, the determination of fair value requires more judgment. Accordingly, the degree of judgment exercised by management in determining fair value is greatest for instruments categorized in Level 3. In certain cases, the inputs used to measure fair value may fall into different levels of the fair value hierarchy. In such cases, for disclosure purposes, the level in the fair value hierarchy within which the fair value measurement in its entirety falls is determined based on the lowest level input that is significant to the fair value measurement in its entirety.

The tables below summarize the categorization of the Company’s assets and liabilities measured at fair value. During the three months ended March 31, 2019 and 2018, there were no transfers between Levels 1, 2 and 3.


16


Table of Contents
     March 31, 2019  
     Total      Level 1      Level 2      Level 3  

Assets:


Recurring fair value measurements:


Cash equivalents

   $ 566      $ 566      $ —        $ —  

Securities owned, at fair value

     6,419        6,419        —          —    


Total

   $ 6,985      $  6,985      $ —        $ —  


Liabilities:


Recurring fair value measurements:


Deferred consideration (Note 11)

   $ 157,147      $ —      $  —        $ 157,147  

Securities sold, but not yet purchased

     1,338        1,338        —          —    


Total

   $ 158,485      $ 1,338      $  —      $ 157,147  


     December 31, 2018  
     Total      Level 1      Level 2      Level 3  

Assets:


Recurring fair value measurements:


Cash equivalents

   $ 24      $ 24      $ —      $ —  

Securities owned, at fair value

     8,873        8,873        —          —    


Total

   $ 8,897      $ 8,897      $ —        $ —  


Non-recurring fair value measurements:


Thesys – Series Y preferred stock(1)

   $ 3,080      $ —      $  —      $ 3,080  


Total

   $ 3,080      $ —      $  —      $ 3,080  


Liabilities:


Recurring fair value measurements:


Deferred consideration (Note 11)

   $  161,540      $ —      $  —      $  161,540  

Securities sold, but not yet purchased

     1,698        1,698        —          —    


Total

   $ 163,238      $ 1,698      $  —      $ 161,540  


(1)

Fair value determined on December 31, 2018 (See Note 9).

Recurring Fair Value Measurements—Methodology

Cash Equivalents (Note 4) – These financial assets represent cash invested in highly liquid investments with original maturities of less than 90 days. These investments are valued at par, which approximates fair value, and are considered Level 1.

Securities Owned/Sold but Not Yet Purchased (Note 6) – Securities owned and sold, but not yet purchased are investments in ETFs. ETFs are generally traded in active, quoted and highly liquid markets and are therefore classified as Level 1 in the fair value hierarchy.


17


Table of Contents

Deferred Consideration – Deferred consideration represents the present value of an obligation to pay gold into perpetuity and was measured at March 31, 2019 using forward-looking gold prices ranging from $1,303 per ounce to $2,394 per ounce ($1,294 per ounce to $2,621 per ounce at December 31, 2018) which are extrapolated from the last observable price (beyond 2024), discounted at a rate of 10% and includes a perpetual growth rate of 1.5%. This obligation is classified as Level 3 as the discount rate, perpetual growth rate and extrapolated forward-looking gold prices are significant unobservable inputs. An increase in forward-looking gold prices would result in an increase in deferred consideration, whereas an increase in the discount rate would reduce the fair value. See Note 11 for additional information.

The following table presents a reconciliation of beginning and ending balances of recurring fair value measurements classified as Level 3:


     Three Months Ended
March 31,
 
     2019      2018  

Deferred consideration (See Note 11)


Beginning balance

   $ 161,540      $ —    

Net realized losses/(gains)(1)

     3,098        —    

Net unrealized losses/(gains)(2)

     (4,404      —    

Settlements

     (3,087      —    


Ending balance

   $ 157,147      $  —    


(1)

Recorded as contractual gold payments expense on the Company’s Consolidated Statements of Operations.

(2)

Recorded as gain on revaluation of deferred consideration – gold payments on the Company’s Consolidated Statements of Operations.

6. Securities Owned/Sold but Not Yet Purchased

The following table is a summary of the Company’s securities owned and securities sold but not yet purchased:


     March 31,
2019
     December 31,
2018
 

Securities Owned


Trading securities

   $ 6,419      $ 8,873  


Securities Sold, but not yet Purchased


Trading securities

   $ 1,338      $ 1,698  


The Company had no available-for-sale debt securities at March 31, 2019 and December 31, 2018. During the three months ended March 31, 2018, the Company received $60,498 of proceeds from the sale and maturity of available-for-sale debt securities and recognized gross realized losses of $716. Those losses were reclassified out of accumulated other comprehensive income and into the Consolidated Statements of Operations.

7. Securities Held-to-Maturity

The following table is a summary of the Company’s securities held-to-maturity:


     March 31,
2019
     December 31,
2018
 

Federal agency debt instruments (amortized cost)

   $ 20,159      $ 20,180  


18


Table of Contents

The following table summarizes unrealized gains, losses, and fair value (classified as Level 2 within the fair value hierarchy) of securities held-to-maturity:


     March 31,
2019
     December 31,
2018
 

Cost/amortized cost

   $ 20,159      $ 20,180  

Gross unrealized gains

     6        5  

Gross unrealized losses

     (1,083      (1,679


Fair value

   $ 19,082      $ 18,506  


The Company assesses these securities for other-than-temporary impairment on a quarterly basis. No securities were determined to be other-than-temporarily impaired at March 31, 2019 or December 31, 2018. The Company does not intend to sell these securities and it is not more likely than not that the Company will be required to sell the securities before recovery of their amortized cost bases, which may be maturity.

The following table sets forth the maturity profile of the securities held-to-maturity; however, these securities may be called prior to maturity date:


     March 31,
2019
     December 31,
2018
 

Due within one year

   $ —        $ —    

Due one year through five years

     —          —    

Due five years through ten years

     7,519        7,521  

Due over ten years

     12,640        12,659  


Total

   $ 20,159      $ 20,180  


8. Note Receivable

The Company has an outstanding unsecured promissory note from AdvisorEngine Inc. (“AdvisorEngine”). All principal amounts under the note bear interest from the date such amounts are advanced until repaid at a rate of 5% per annum, provided that immediately upon the occurrence and during the continuance of an event of default (as defined), interest will be increased to 10% per annum. All accrued and unpaid interest is treated as paid-in-kind (“PIK”) by capitalizing such amount and adding it to the principal amount of the original note. AdvisorEngine has the option to prepay the note, in whole or in part, at any time without premium or penalty. All borrowings under the promissory note mature on December 29, 2021.

The following is a summary of the outstanding note receivable balance:


     March 31,
2019
     December 31,
2018
 

Note receivable (face value)

   $ 30,000      $ 30,000  

Less: Original issue discount (“OID”), unamortized

     (2,378      (2,582

Plus: PIK interest

     1,695        1,304  


Total note receivable, net

   $ 29,317      $ 28,722  


During the three months ended March 31, 2019 and March 31, 2018, the Company recognized interest income of $595 and $416, respectively, which included OID amortization and accrued PIK interest. The Company determined that an allowance for credit loss was not necessary at March 31, 2019 and December 31, 2018 as there have been no adverse events or circumstances since the note was issued which may indicate that its carrying amount may not be recoverable. The fair value of the note receivable (classified as Level 2 within the fair value hierarchy and determined using high yield credit spreads) was $28,802 and $27,618 at March 31, 2019 and December 31, 2018, respectively.


19


Table of Contents

9. Investments, Carried at Cost

The following table sets forth the Company’s investments, carried at cost:


     March 31,
2019
     December 31,
2018
 

AdvisorEngine – Preferred stock

   $ 25,000      $ 25,000  

Thesys Group, Inc. (“Thesys”)

     3,080        3,080  


Total

   $ 28,080      $ 28,080  


AdvisorEngine

Preferred Stock

The Company owns approximately 46% (or 41% on a fully-diluted basis) of AdvisorEngine, a digital wealth management platform, through strategic investments totaling $25,000. In consideration of its investment, the Company received 11,811,856 shares and 2,646,062 shares of Series A and Series A-1 convertible preferred stock, respectively. The Series A and Series A-1 preferred shares have substantially the same terms, are convertible into common stock at the option of the Company and contain various rights and protections including a non-cumulative 6.0% dividend, payable if and when declared by the board of directors, and a liquidation preference that is senior to all other holders of capital stock of AdvisorEngine. The Company and AdvisorEngine also entered into an agreement whereby the Company’s asset allocation models are made available through AdvisorEngine’s open architecture platform and the Company actively introduces the platform to its distribution network.

The investment is accounted for under the cost method of accounting as it is not considered to be in-substance common stock. The Company quantitatively assessed its investment for impairment at December 31, 2018. The table below presents the ranges and weighted averages of significant unobservable inputs used in this assessment:


     Range (Weighted Average)  

Market Approach


Revenue multiple

     4.7x - 5.4x (5.0x)  

Income Approach


Weighted average cost of capital (“WACC”)

     26.0%  

An increase in the revenue multiple would result in a higher enterprise value, whereas an increase in the WACC would reduce fair value. The results of the quantitative assessment noted no impairment at December 31, 2018. In addition, no impairment existed at March 31, 2019 based upon a qualitative assessment. There were also no observable price changes during the applicable reporting periods.

Thesys

On June 20, 2017, the Company was issued 7,797,533 newly authorized shares of Series Y preferred stock (“Series Y Preferred”) of Thesys in connection with the resolution of a dispute related to the Company’s ownership stake in Thesys. The Series Y Preferred represents current ownership of approximately 19% of Thesys on a fully diluted basis (excluding certain reserved shares). In addition, the Company was issued a warrant to purchase 3,898,766 shares of Series Y Preferred.

The Series Y Preferred ranks pari passu in priority with Thesys’s current preferred stockholders, has a liquidation preference of $0.231 per share, contains various rights and protections and is convertible into common stock at the option of the Company. The warrant is exercisable for five years after closing, at varying exercise prices that increase over time and set at multiples of a pre-determined Thesys valuation (or new valuation if Thesys completes a qualified financing, as defined, within two years). If a claim is brought against Thesys or the Company relating to the settlement, the warrant will be exercisable for 100% of the number of shares of Series Y Preferred issued to the Company at closing.

The Series Y Preferred is accounted for under the cost method of accounting as it is not considered to be in-substance common stock. The Company quantitatively assessed its investment for impairment at December 31, 2018. The table below presents the ranges and weighted averages of significant unobservable inputs used in this assessment:


20


Table of Contents
     Range (Weighted Average)  

Income Approach(1)


Weighted average cost of capital (“WACC”)

     3.8% - 15.5% (14.1%)  


(1)

The inputs selected varied, based upon the Thesys business line being valued. An increase in the WACC would result in a lower enterprise value.

The quantitative assessment performed resulted in the recognition of an impairment in the fourth quarter of 2018. No additional impairment was recognized at March 31, 2019 based upon a qualitative assessment. There were also no observable price changes during the applicable reporting periods.

The carrying value of the Series Y Preferred was $3,080 at March 31, 2019 and December 31, 2018. The fair value of the warrant was determined to be insignificant. The warrant is not accounted for as a derivative as it cannot be net settled and is not readily convertible to cash.

10. Fixed Assets, net

The following table summarizes fixed assets:


     March 31,
2019
     December 31,
2018
 

Equipment

   $ 2,284      $ 2,244  

Furniture and fixtures

     2,218        2,218  

Leasehold improvements

     10,982        10,964  

Less: accumulated depreciation and amortization

     (6,621      (6,304


Total

   $ 8,863      $ 9,122  


11. Deferred Consideration

Deferred consideration represents an obligation the Company assumed in connection with the ETFS Acquisition. The obligation is for fixed payments to ETFS Capital of physical gold bullion equating to 9,500 ounces of gold per year through March 31, 2058 and then subsequently reduced to 6,333 ounces of gold continuing into perpetuity (“Contractual Gold Payments”).

The Contractual Gold Payments are paid from advisory fee income generated by any Company-sponsored financial product backed by physical gold and are subject to adjustment and reduction for declines in advisory fee income generated by such products, with any reduction remaining due and payable until paid in full. ETFS Capital’s recourse is limited to such advisory fee income and it has no recourse back to the Company for any unpaid amounts that exceed advisory fees earned. ETFS Capital ultimately has the right to claw back Gold Bullion Securities Ltd. (a physically backed gold ETP issuer) if the Company fails to remit any amounts due.

The Company determined the present value of the deferred consideration of $157,147 and $161,540 at March 31, 2019 and December 31, 2018, respectively, using forward-looking gold prices which were extrapolated from the last observable price (beyond 2024), discounted at a rate of 10.0%. Current and long-term amounts payable at March 31, 2019 were $11,857 and $145,290, respectively.

During the three months ended March 31, 2019, the Company recognized Contractual Gold Payments expense of $3,098, arising from the fixed payments of physical gold bullion of 2,375 ounces and the unwinding of the discount (representing the increase in the carrying amount of the deferred consideration for the passage of time). A gain on the revaluation of deferred consideration of $4,404 was recognized during the three months ended March 31, 2019 due to flattening of the forward-looking gold curve as compared to the forward-looking gold curve on December 31, 2018, the date on which the deferred consideration was last measured.

See Note 5 for a reconciliation of changes in the deferred consideration balances.

12. Long-Term Debt

On April 11, 2018 and in connection with the ETFS Acquisition, the Company entered into the Credit Facility pursuant to which the lenders extended a $200,000 Term Loan and made available a $50,000 Revolver. Interest on the Term Loan accrues at an annual rate equal to LIBOR, plus up to 2.00% (commencing at LIBOR, plus 1.75%), and interest on the Revolver accrues at an annual rate equal to LIBOR, plus up to 1.50% (commencing at LIBOR, plus 1.25%), in each case, with the exact interest rate margin determined based on the Total Leverage Ratio (as defined below). The Revolver is also subject to a facility fee equal to an annual rate of up to 0.50% of the actual daily amount of the aggregate commitments (whether used or unused) under the Revolver, with the exact facility fee rate determined based on the Total Leverage Ratio. The Credit Facility matures on April 11, 2021. The Term Loan does not amortize and the entire principal balance is due in a single payment on the maturity date.


21


Table of Contents

The following table provides a summary of the Company’s outstanding borrowings under the Credit Facility:


     March 31, 2019      December 31, 2018  
     Term Loan     Revolver      Term Loan     Revolver  

Amount borrowed

   $ 200,000     $ —      $ 200,000     $ —  

Unamortized issuance costs

     (4,826     1,066        (5,408     1,195  


Carrying amount

   $ 195,174     $ 1,066    $ 194,592     $ 1,195


Effective interest rate(1)

     5.47     n/a        5.09     n/a  


(1)

Includes amortization of issuance costs.

During the three months ended March 31, 2019, the Company recognized $2,892 of interest expense on the Credit Facility. Unamortized issuance costs related to the Revolver of $1,066 and $1,195 at March 31, 2019 and December 31, 2018, respectively, are included within other noncurrent assets on the Consolidated Balance Sheet. The fair value of the Company’s long-term debt (classified as Level 2 within the fair value hierarchy) was $194,876 and $196,126 at March 31, 2019 and December 31, 2018, respectively.

The credit agreement includes a financial covenant that requires that the Company maintain a Total Leverage Ratio (as defined below), calculated as of the last day of each fiscal quarter, equal to or less than the ratio set forth opposite such fiscal quarter:


Fiscal Quarter Ending

   Total Leverage Ratio  

March 31, 2019

     2.75:1.00  

June 30, 2019

     2.50:1.00  

September 30, 2019

     2.50:1.00  

December 31, 2019

     2.50:1.00  

March 31, 2020

     2.25:1.00  

June 30, 2020

     2.25:1.00  

September 30, 2020 and each subsequent fiscal quarter ending on or before the maturity date

     2.00:1.00  

Total Leverage Ratio means, as of the last day of any fiscal quarter, the ratio of Consolidated Total Debt of the Company and its restricted subsidiaries (as defined in the credit agreement) as of such date to Consolidated EBITDA of the Company and its restricted subsidiaries (as defined in the credit agreement) for the four consecutive fiscal quarters ended on such date.

The Company’s obligations under the Term Loan and Revolver are unconditionally guaranteed by the Company and certain of its subsidiaries and secured by substantially all of the present and future property and assets of the Company and such subsidiaries, in each case, subject to customary exceptions and exclusions.

The credit agreement contains customary affirmative covenants for transactions of this type and other affirmative covenants agreed to by the parties, including, among others, the provision of annual and quarterly financial statements and compliance certificates, maintenance of property, insurance, compliance with laws and environmental matters. The credit agreement contains customary negative covenants, including among others, restrictions on the incurrence of indebtedness, granting of liens, making investments and acquisitions, paying dividends, repurchasing equity interests of the Company, entering into affiliate transactions and asset sales. The credit agreement also provides for a number of customary events of default, including, among others, payment, bankruptcy, covenant, representation and warranty, change of control and judgment defaults.

The Company is in compliance with its covenants under the credit agreement.

13. Preferred Shares

On April 10, 2018, the Company filed a Certificate of Designations of Series A Non-Voting Convertible Preferred Stock with the Secretary of State of the State of Delaware establishing the rights, preferences, privileges, qualifications, restrictions, and limitations relating to the Preferred Shares. The Preferred Shares are intended to provide ETFS Capital with economic rights equivalent to the Company’s common stock on an as-converted basis. The Preferred Shares have no voting rights, are not transferable and have the same priority with regard to dividends, distributions and payments as the common stock.

As described in the Certificate of Designations, the Company will not issue, and ETFS Capital does not have the right to require the Company to issue, any shares of common stock upon conversion of the Preferred Shares, if, as a result of such conversion, ETFS Capital (together with certain attribution parties) would beneficially own more than 9.99% of the Company’s outstanding common stock immediately after giving effect to such conversion.


22


Table of Contents

In connection with the completion of the ETFS Acquisition, the Company issued 14,750 Preferred Shares, which are convertible into an aggregate of 14,750,000 shares of common stock. The fair value of this consideration was $132,750, based on the closing price of the Company’s common stock on April 10, 2018 of $9.00 per share, the trading day prior to the closing of the acquisition.

The following is a summary of the Preferred Share balance:


     March 31,
2019
     December 31,
2018
 

Issuance of Preferred Shares

   $ 132,750      $ 132,750  

Less: Issuance costs

     (181      (181


Preferred Shares – carrying value

   $ 132,569      $ 132,569  


Temporary equity classification is required for redeemable instruments for which redemption triggers are outside of the issuer’s control. ETFS Capital has the right to redeem all the Preferred Shares specified to be converted during the period of time specified in the Certificate of Designations in the event that: (a) the number of shares of the Company’s common stock authorized by its certificate of incorporation is insufficient to permit the Company to convert all of the Preferred Shares requested by ETFS Capital to be converted; or (b) ETFS Capital does not, upon completion of a change of control of the Company, receive the same amount per Preferred Share as it would have received had each outstanding Preferred Share been converted into common stock immediately prior to the change of control. However, the Company will not be obligated to make any such redemption payments to the extent such payments would be a breach of any covenant or obligation the Company owes to any of its secured creditors or is otherwise prohibited by applicable law.

Any such redemption will be at a price per Preferred Share equal to the dollar volume-weighted average price for a share of common stock for the 30-trading day period ending on the date of such attempted conversion or change of control, as applicable, multiplied by 1,000. Such redemption payment will be made in one payment no later than 10 business days following the last day of the Company’s first fiscal quarter that begins on a date following the date ETFS Capital exercises such redemption right.

The carrying amount of the Preferred Shares was not adjusted as it was not probable that the Preferred Shares would become redeemable.

14. Leases

The Company has entered into operating leases for its corporate headquarters and other office facilities, financial data terminals and equipment. The Company has no finance leases.

Upon the adoption of ASC 842 on January 1, 2019, the Company recognized a right-of-use asset and lease liability of $19,827 and $24,817, respectively. The right-of-use asset was equal to the lease liability, less accrued lease payments and remaining unamortized lease incentives.

The following table provides additional information regarding the Company’s leases:


     Three Months Ended March 31,  
     2019     2018  

Lease cost:


Operating lease cost

   $ 798     $ 743  

Short-term lease cost

     389       284  


Total lease cost

   $ 1,187     $ 1,027  


Other information:


Cash paid for amounts included in the measurement of operating liabilities (operating leases)

   $ 881       n/a  


Right-of-use assets obtained in exchange for new operating lease liabilities

     n/a       n/a  


Weighted-average remaining lease term (in years) – operating leases

     10.0       n/a  


Weighted-average discount rate – operating leases

     6.3     n/a  


None of the Company’s leases include variable payments, residual value guarantees or any restrictions or covenants relating to the Company’s ability to pay dividends or incur additional financing obligations.

The Company’s lease of its headquarters, which expires on August 20, 2029, includes an option to extend for an additional five years. Rent payable under the option is equal to the fair market rent of the premise as determined by the landlord approximately six


23


Table of Contents

months prior to the commencement of the extension term. The lease also includes a cancellation option which is effective on August 21, 2024 and requires notice to be provided to the landlord at least 12 months prior. Triggering this option requires a cancellation payment of $4,236. The cancellation and extension options were not reasonably certain of being exercised and were therefore not recognized as part of the right-of-use asset and lease liability.

Other leases also include extension, automatic renewal and termination provisions. These provisions were also not reasonably certain of being exercised and were therefore not recognized as part of the right-of-use asset and lease liability.

The following table discloses future minimum lease payments at March 31, 2019 with respect to the Company’s operating lease liabilities:


Remainder of 2019

   $ 2,723  

2020

     3,695  

2021

     2,958  

2022

     2,958  

2023

     2,958  

2024 and thereafter

     17,641  


Total future minimum lease payments (undiscounted)

   $ 32,933  


The following table reconciles the future minimum lease payments (disclosed above) at March 31, 2019 to the operating lease liabilities recognized in the Company’s Consolidated Balance Sheet:


Amounts recognized in the Company’s Consolidated Balance Sheet


Lease liability – short term

   $ 3,651  

Lease liability – long term

     20,704  


Subtotal

     24,355  

Difference between undiscounted and discounted cash flows

     8,578  


Total future minimum lease payments (undiscounted)

   $ 32,933  


The following table discloses the future minimum lease payments at March 31, 2018 (prior period), which is required as the Company elected to apply the new lease requirements at the effective date, rather than the beginning of the earliest comparative period presented:


Remainder of 2018

   $ 3,072  

2019

     3,764  

2020

     3,516  

2021

     3,146  

2022

     2,958  

2023 and thereafter

     20,599  


Total future minimum lease payments (undiscounted)

   $ 37,055  


Lease Termination – Japan Office

The Company recognized an impairment expense of $572 in connection with the termination of its Japan office lease.

Letter of Credit

The Company collateralized its U.S. office lease through a standby letter of credit totaling $1,384. The collateral is included in cash and cash equivalents on the Company’s Consolidated Balance Sheets.


24


Table of Contents

15. Contingencies

The Company may be subject to reviews, inspections and investigations by regulatory authorities as well as legal proceedings arising in the ordinary course of business. The Company is not currently party to any litigation that is expected to have a material adverse impact on its business, financial position, results of operations or cash flows.

16. Variable Interest Entity

VIEs are entities with any of the following characteristics: (i) the entity does not have enough equity to finance its activities without additional financial support; (ii) the equity holders, as a group, lack the characteristics of a controlling financial interest; or (iii) the entity is structured with non-substantive voting rights. The Company determined that AdvisorEngine has the characteristics of a VIE.

Consolidation of a VIE is required for the party deemed to be the primary beneficiary, if any. The primary beneficiary is the party who has both (a) the power to direct the activities of a VIE that most significantly impact the entity’s economic performance and (b) an obligation to absorb losses of the entity or a right to receive benefits from the entity that could potentially be significant to the entity. The Company is not the primary beneficiary of AdvisorEngine as it does not have the power to direct the activities that most significantly impact AdvisorEngine’s economic performance. Such power is conveyed through AdvisorEngine’s board of directors and the Company does not have control over the board.

The following table presents information about the Company’s variable interests in AdvisorEngine (a non-consolidated VIE):


     March 31,
2019
     December 31,
2018
 

Carrying Amount - Assets


Preferred stock

   $ 25,000      $ 25,000  

Note receivable - unsecured

     29,317        28,722  


Total carrying amount - Assets

   $ 54,317      $ 53,722  


Maximum exposure to loss

   $ 54,317      $ 53,722  


17. Revenues from Contracts with Customers

The following table presents the Company’s total revenues categorized as revenues from contracts with customers and other sources of revenues:


     Three Months Ended  
     March 31,
2019
     March 31,
2018
 

Revenues from contracts with customers:


Advisory fees

   $ 64,840      $ 58,456  

Other

     645        448  


Total operating revenues

   $ 65,485      $ 58,904  


The Company recognizes revenues from contracts with customers when the performance obligation is satisfied, which is when the promised goods or services are transferred to the customer. A good or service is considered to be transferred when the customer obtains control, which is represented by the transfer of rights with regard to the good or service. Transfer of control happens either over time or at a point in time. When a performance obligation is satisfied over time, an entity is required to select a single method of measuring progress for each performance obligation that depicts the entity’s performance in transferring control of goods or services to the customer.


25


Table of Contents

Substantially all the Company’s revenues from contracts with customers are derived primarily from investment advisory agreements with related parties (See Note 18). These advisory fees are recognized over time, are earned from the Company’s ETPs and are calculated based on a percentage of the ETPs’ average daily net assets. There is no significant judgment in calculating amounts due which are invoiced monthly in arrears and are not subject to any potential reversal. Progress is measured using the practical expedient under the output method resulting in the recognition of revenue in the amount for which the Company has a right to invoice.

There are no contract assets or liabilities that arise in connection with the recognition of advisory fee revenue. In addition, there are no costs incurred to obtain or fulfill the contracts with customers, all of which are investment advisory agreements with related parties.

See Note 18 for further information including disaggregation of advisory fee revenue and amounts due from customers, all of which are derived from related parties. Advisory fee revenues are also reported by segment as disclosed in Note 24.

18. Related Party Transactions

The Company’s revenues are derived primarily from investment advisory agreements with related parties. Under these agreements, the Company has licensed to related parties the use of certain of its own indexes for the U.S. and Canadian WisdomTree ETFs and WisdomTree UCITS ETFs. The Board of Trustees and Board of Directors (including certain officers of the Company) of the related parties are primarily responsible for overseeing the management and affairs of the entities for the benefit of their stakeholders and have contracted with the Company to provide for general management and administration services. The Company is also responsible for certain expenses of the related parties, including the cost of transfer agency, custody, fund administration and accounting, legal, audit, and other non-distribution services, excluding extraordinary expenses, taxes and certain other expenses, which is included in fund management and administration on the Company’s Consolidated Statements of Operations. In exchange, the Company receives fees based on a percentage of the ETFs’ average daily net assets. The advisory agreements may be terminated by the related parties upon notice.

The following table summarizes accounts receivable from related parties which are included as a component of accounts receivable on the Company’s Consolidated Balance Sheets:


     March 31,
2019
     December 31,
2018
 

Receivable from WTT

   $ 15,036      $ 14,678  

Receivable from ETFS Issuers

     8,786        8,779  

Receivable from BI and WTI

     1,004        951  

Receivable from WTAMC

     189        167  

Receivable from WTCS

     97        95  


Total

   $ 25,112      $ 24,670  


The following table summarizes revenues from advisory services provided to related parties:


     Three Months Ended  
     March 31,
2019
     March 31,
2018
 

Advisory services provided to WTT

   $ 42,223      $ 55,202  

Advisory services provided to ETFS Issuers

     19,273        —    

Advisory services provided to BI and WTI

     2,504        2,626  

Advisory services provided to WTAMC

     546        311  

Advisory services provided to WTCS

     294        317  


Total

   $ 64,840      $ 58,456  


The Company also has investments in certain WisdomTree ETFs of approximately $4,940 and $7,117 at March 31, 2019 and December 31, 2018, respectively. Gains related to these ETFs for the three months ended March 31, 2019 and 2018 were $353 and $9, respectively.


26


Table of Contents

19. Stock-Based Awards

On June 20, 2016, the Company’s stockholders approved a new equity award plan under which the Company can issue up to 10,000,000 shares of common stock (less one share for every share granted under prior plans since March 31, 2016 and inclusive of shares available under the prior plans as of March 31, 2016) in the form of stock options and other stock-based awards. The Company also has issued from time to time stock-based awards outside a plan.

The Company grants equity awards to employees and directors which include restricted stock awards (“RSAs”), restricted stock units (“RSUs”), performance-based restricted stock units (“PRSUs”) and stock options. Certain awards described below are subject to acceleration under certain conditions.


Stock options:    Generally issued for terms of ten years and may vest after at least one year of service and have an exercise price equal to the Company’s stock price on the grant date. The Company estimates the fair value of stock options (when granted) using the Black-Scholes option pricing model.
RSAs/RSUs:    Awards are valued based on the Company’s stock price on grant date and generally vest ratably over three years.
PRSUs:    These awards cliff vest three years from grant date and contain a market condition whereby the number of PRSUs ultimately vesting is tied to how the Company’s total shareholder return (“TSR”) compares to a peer group of other publicly traded asset managers over the three-year period. A Monte Carlo simulation is used to value these awards.
   The number of PRSUs vesting ranges from 0% to 200% of the target number of PRSUs granted, as follows:
  

•  If the relative TSR is below the 25th percentile, then 0% of the target number of PRSUs granted will vest;


•  If the relative TSR is at the 25th percentile, then 50% of the target number of PRSUs granted will vest; and


•  If the relative TSR is above the 25th percentile, then linear scaling is applied such that the percent of the target number of PRSUs vesting is 100% at the 50th percentile and capped at 200% of the target number of PRSUs granted for performance at the 100th percentile.

For the three months ended March 31, 2019 and 2018, total stock-based compensation expense was $3,072 and $3,309, respectively.

A summary of unrecognized stock-based compensation expense and average remaining vesting period is as follows:


     March 31, 2019  
     Unrecognized Stock-
Based
Compensation
     Average
Remaining
Vesting Period
 

Employees and directors restricted stock awards

   $ 24,012        2.48  

A summary of stock options, restricted stock and restricted stock unit activity for the three months ended March 31, 2019 is as follows:


     Stock
Options
     RSAs      RSUs      PRSUs  

Balance at January 1, 2019

     570,537        1,957,102        9,494        —    

Granted

     —          2,233,878        35,283        270,872 (1) 

Exercised/vested

     (20,000      (827,721      (4,341      —    

Forfeitures

     —          (93,194      —          —    


Balance at March 31, 2019

     550,537        3,270,065        40,436        270,872 (1) 


(1)

Represents the target number of PRSUs granted and outstanding. The number of PRSUs that ultimately vest ranges from 0% to 200% of this amount. A Monte Carlo simulation was used to value these awards using the following assumptions for the Company and the peer group: (i) beginning 90-day average stock prices; (ii) valuation date stock prices; (iii) historical stock price volatilities ranging from 22% to 42% (average 28%); (iv) correlation coefficients based upon the price data used to calculate the historical volatilities; (v) a risk free interest rate of 2.56%; and (vi) an expected dividend yield of 0%.


27


Table of Contents

20. Earnings Per Share

The following tables set forth reconciliations of the basic and diluted earnings per share computations for the periods presented:


     Three Months Ended March 31,  
Basic Earnings per Share    2019      2018  

Net income

   $ 8,824      $ 9,424  

Less: Income distributed to participating securities

     (544      (71

Less: Undistributed income allocable to participating securities

     (391      (85


Net income available to common stockholders

   $ 7,889      $ 9,268  

Weighted average common shares (in thousands)

     151,625        135,329  


Basic earnings per share

   $ 0.05      $ 0.07  


     Three Months Ended March 31,  
Diluted Earnings per Share    2019      2018  

Net income

   $ 8,824      $ 9,424  


Weighted Average Diluted Shares (in thousands):


Weighted average common shares

     151,625        135,329  

Dilutive effect of common stock equivalents

     15,186        1,139  


Weighted average diluted shares

     166,811        136,468  


Diluted earnings per share

   $ 0.05      $ 0.07  


Diluted earnings per share is calculated under both the treasury stock and if-converted method and the two-class method and reflects the reduction in earnings per share assuming options or other contracts to issue common stock were exercised or converted into common stock (if dilutive). The calculation that results in the most dilutive earnings per share amount for common stock is reported in the Company’s consolidated financial statements. The Company excluded 3,495,080 and 1,101,513 common stock equivalents from its computation of diluted earnings per share for the three months ended March 31, 2019 and 2018, respectively, as they were determined to be anti-dilutive.

21. Income Taxes

Effective Income Tax Rate – Three Months Ended March 31, 2019 and March 31, 2018

The Company’s effective income tax rate for the three months ended March 31, 2019 of negative 13.5% resulted in an income tax benefit of $1,049. The Company’s effective income tax rate differs from the federal statutory tax rate of 21% primarily due to a $4,309 reduction in unrecognized tax benefits, a non-taxable gain on revaluation of deferred consideration and a lower tax rate on foreign earnings, partly offset by a valuation allowance on foreign net operating losses, tax shortfalls associated with the vesting and exercise of stock-based compensation awards and state and local income taxes.

The Company’s effective income tax rate for the three months ended March 31, 2018 of 32.3% resulted in income tax expense of $4,498. The Company’s effective income tax rate differs from the federal statutory tax rate of 21% primarily due to a valuation allowance on foreign net operating losses and state and local income taxes, partly offset by tax windfalls associated with the vesting and exercise of stock-based compensation awards.


28


Table of Contents

Deferred Tax Assets

A summary of the components of the Company’s deferred tax assets at March 31, 2019 and December 31, 2018 are as follows:


     March 31,
2019
     December 31,
2018
 

Deferred tax assets:


NOLs – Foreign

   $ 8,222      $ 6,605  

Goodwill and intangible assets

     1,794        1,841  

Accrued expenses

     1,358        2,699  

Stock-based compensation

     1,189        2,673  

Net lease liability

     1,172        1,184  

Capital losses

     794        794  

NOLs – U.S.

     635        762  

Other

     37        40  


Deferred tax assets

     15,201        16,598  


Deferred tax liabilities:


Fixed assets and prepaid assets

     1,439        1,433  

Unrealized gains

     748        724  


Deferred tax liabilities

     2,187        2,157  


Total deferred tax assets less deferred tax liabilities

     13,014        14,441  

Less: valuation allowance

     (9,016      (7,399


Deferred tax assets, net

   $ 3,998      $ 7,042  


Net Operating Losses – U.S.

The Company’s pre-tax federal net operating losses for tax purposes (“NOLs”) at March 31, 2019 were $2,622 which expire in 2024. The net operating loss carryforwards have been reduced by the impact of annual limitations described in Internal Revenue Code Section 382 that arose as a result of an ownership change.

The Company’s pre-tax capital loss at March 31, 2019 was $3,278. A full valuation allowance was established as it is more-likely-than-not that some portion, or all, of the deferred tax assets will not be realized.

Net Operating Losses – Foreign

Certain of the Company’s European subsidiaries and its Canadian subsidiary generated NOLs outside the U.S. These tax effected NOLs were $8,222 and $6,605 at March 31, 2019 and December 31, 2018, respectively. The Company established a full valuation allowance related to these NOLs as it is more-likely-than-not that some portion, or all, of the deferred tax assets will not be realized. Approximately $4,050 of these NOLs at March 31, 2019 expire between the years 2036 and 2039. The remainder is carried forward indefinitely.

Uncertain Tax Positions

Tax positions are evaluated utilizing a two-step process. The Company first determines whether any of its tax positions are more-likely-than-not to be sustained upon examination, based solely on the technical merits of the position. Once it is determined that a position meets this recognition threshold, the position is measured as the largest amount of benefit that is greater than 50% likely of being realized upon ultimate settlement.

In connection with the ETFS Acquisition, the Company accrued a liability for uncertain tax positions and interest and penalties at the acquisition date. The table below sets forth the aggregate changes in the balance of these gross unrecognized tax benefits for the three months ended March 31, 2019:


     Total      Unrecognized
Tax Benefits
     Interest and
Penalties
 

Balance on January 1, 2019

   $ 34,876    $ 28,101    $ 6,775

Decrease—Lapse of statute of limitations

     (4,309      (2,999      (1,310

Increases

     101        —          101  

Foreign currency translation(1)

     925        745        180  


Balance at March 31, 2019

   $ 31,593      $ 25,847      $ 5,746  


(1)

The gross unrecognized tax benefits were accrued in British pounds sterling.

The Company also recorded an offsetting indemnification asset provided by ETFS Capital as part of its agreement to indemnify the Company for any potential claims, for which an amount is being held in escrow. ETFS Capital has also agreed to provide additional collateral by maintaining a minimum working capital balance up to a stipulated amount. The decrease resulting from the lapsing of the statute of limitations of $4,309 was recorded as an income tax benefit and an equal and offsetting amount to reduce the indemnification asset was recorded in other losses, net.


29


Table of Contents

The gross unrecognized tax benefits and interest and penalties totaling $31,593 at March 31, 2019 are included in other non-current liabilities on the Consolidated Balance Sheet. It is expected that the amount of unrecognized tax benefits will change in the next 12 months; however, the Company does not expect the change to have a material impact on its consolidated financial statements.

At March 31, 2019, there were $25,847 of unrecognized tax benefits that, if recognized, would impact the effective tax rate. The recognition of any unrecognized tax benefits would result in an equal and offsetting adjustment to the indemnification asset which would be recorded in income before taxes due to the indemnity for any potential claims.

Income Tax Examinations

The Company is subject to U.S. federal income tax as well as income tax of multiple state, local and certain foreign jurisdictions. The Company’s federal tax return and ManJer’s tax return (a Jersey-based subsidiary) for the year ended December 31, 2016 are currently under review by the relevant tax authorities. The Company is indemnified by ETFS Capital for any potential exposure associated with ManJer’s tax return under audit.

The Company is not currently under audit in any other income tax jurisdictions. As of March 31, 2019, with few exceptions, the Company was no longer subject to income tax examinations by any taxing authority for years before 2015.

Undistributed Earnings of Foreign Subsidiaries

The Company recognizes deferred tax liabilities for withholding taxes that may become payable, where applicable, upon the distribution of earnings and profits from foreign subsidiaries unless considered permanent in duration. As of March 31, 2019, the Company considers all undistributed foreign earnings and profits to be permanent in duration.

22. Shares Repurchased

On April 24, 2019, the Company’s Board of Directors extended the term of the Company’s share repurchase program for three years through April 27, 2022. Included under this program are purchases to offset future equity grants made under the Company’s equity plans and purchases made in open market or privately negotiated transactions. This authority may be exercised from time to time and in such amounts as market conditions warrant, and subject to the terms of the credit agreement described below and regulatory considerations. The timing and actual number of shares repurchased will depend on a variety of factors including price, corporate and regulatory requirements, market conditions and other corporate liquidity requirements and priorities. The repurchase program may be suspended or terminated at any time without prior notice. Shares repurchased under this program are returned to the status of authorized and unissued on the Company’s books and records.

As more fully disclosed in Note 3, the Company completed the ETFS Acquisition on April 11, 2018. To partially finance the acquisition, the Company entered into a credit agreement which contains customary negative covenants, including, among others, a covenant which may restrict the Company’s ability to repurchase equity interests. Share repurchases only are permitted to the extent the Total Leverage Ratio (as defined in the credit agreement) does not exceed 1.75 to 1.00 and no event of default (as defined in the credit agreement) has occurred and is continuing at the time the share repurchase is made. However, the Company’s ability to purchase shares of its common stock withheld pursuant to the terms of equity awards granted to employees to satisfy tax withholding obligations is not restricted.

During the three months ended March 31, 2019 and March 31, 2018, the Company repurchased 311,213 shares and 60,508 shares of its common stock, respectively, under this program for an aggregate cost of $2,005 and $734, respectively.

As of March 31, 2019, $83,724 remains under this program for future purchases.

23. Goodwill and Intangible Assets

Goodwill

The table below sets forth goodwill by reporting unit. Goodwill allocated to the U.S. Business reporting unit is tested annually for impairment on April 30th. Goodwill allocated to the European Business reporting unit is tested annually for impairment on November 30th:


     Reporting Unit         
     European
Business(1)
     U.S. Business      Total  

Balance at January 1, 2019

   $ 84,057      $ 1,799      $ 85,856  

Changes

     —          —          —    


Balance at March 31, 2019

   $ 84,057      $ 1,799      $ 85,856  


(1)

The European Business is included in the Company’s International Business reportable segment.


30


Table of Contents

The goodwill allocated to the European Business reporting unit is not deductible for tax purposes as the transaction was structured as a stock acquisition occurring in the United Kingdom. The goodwill allocated to the U.S. Business reporting unit is deductible for tax purposes.

Intangible Assets (Indefinite-Lived)


     Advisory
Agreements

(ETFS)
     Advisory
Agreements
(Questrade AUM)
     Total  

Balance at January 1, 2019

   $ 601,247      $ 1,962      $ 603,209  

Foreign currency translation

     —          42        42  


Balance at March 31, 2019

   $ 601,247      $ 2,004      $ 603,251  


ETFS

In connection with the ETFS Acquisition which was completed on April 11, 2018 (see Note 3), the Company identified intangible assets valued at $601,247 related to the right to manage AUM through customary advisory agreements. The fair value of the intangible assets was determined using an income approach (discounted cash flow analysis) which relied upon significant unobservable inputs including a revenue growth multiple of 3% to 4% and a weighted average cost of capital of 11.6%. The intangible assets were determined to have indefinite useful lives and are not deductible for tax purposes. The Company has designated November 30th as its annual impairment testing date for these intangible assets.

Questrade ETFs

During the fourth quarter of 2017, the Company acquired eight Canadian-listed ETFs from Questrade, Inc. (the “Questrade ETFs”). The purchase price was CAD $2,675 (USD $2,132), all of which was allocated to the Company’s right to manage AUM in the form of advisory contracts. These intangible assets are translated based on the end of period exchange rates from local currency to U.S. dollars.

Most of the Questrade ETFs were merged into the Company’s existing Canadian-listed ETFs. The intangible assets (which are deductible for tax purposes) were determined to have an indefinite useful life. The Company has designated November 30th as its annual impairment testing date for these intangible assets.

24. Segment Reporting

The Company operates as an ETP sponsor and asset manager providing investment advisory services globally. These activities are reported in the Company’s U.S. Business and International Business reportable segments. The U.S. Business segment includes the results of the Company’s U.S. operations and wind down costs associated with the Japan sales office. The results of the Company’s European and Canadian operations are reported as the International Business segment.

Information concerning these reportable segments are as follows:


     Three Months Ended March 31,  
     2019      2018  

U.S. Business Segment


Operating revenues


Advisory fees

   $ 42,517      $ 55,518  

Other income

     106        147  


Total operating revenues

   $ 42,623      $ 55,665  


Total operating expenses

   $ (37,176    $ (39,030


Other income/(expenses)


Interest expense

   $ (192    $ —    

Interest income

     779        962  

Impairment

     (572      —    

Other gains/(losses), net

     145        (226


Total other income/(expenses)

   $ 160      $ 736  


Total income before taxes (U.S. Business Segment)

   $ 5,607      $ 17,371  


31


Table of Contents
     Three Months Ended March 31,  
     2019      2018  

International Business Segment (1)


Operating revenues


Advisory fees

   $ 22,323      $ 2,938  

Other income

     539        301  


Total operating revenues

   $ 22,862      $ 3,239  


Total operating expenses

   $ (17,626    $ (6,653


Other income/(expenses)


Interest expense

   $ (2,700    $ —    

Gain on revaluation of deferred consideration

     4,404        —    

Other losses, net

     (4,772      (35


Total other income/(expenses)

   $ (3,068    $ (35


Total income/(loss) before taxes (International Business Segment)

   $ 2,168      $ (3,449


Income/(loss) before taxes


U.S. Business segment

   $ 5,607      $ 17,371  

International Business segment

     2,168        (3,449


Total income before taxes

   $ 7,775      $ 13,922  


Assets are not reported by segment as such information is not utilized by the chief operating decision maker.


(1)

The financial results of ETFS are included in the International Business reportable segment as of April 11, 2018.

25. Subsequent Events

Convertible Note - AdvisorEngine

On April 11, 2019, the Company participated in a private convertible note financing round of AdvisorEngine by advancing $1,540 in consideration for a convertible note, which was issued as part of a series of convertible notes pursuant to a Convertible Note Purchase Agreement entered into between AdvisorEngine, the Company and the other purchasers thereto. The convertible note bears interest at a rate of 3% per annum, with all or any unpaid portion being treated as PIK by capitalizing such amount and adding it to the principal amount outstanding, is unsecured, and matures on April 11, 2021. All principal (and, at the option of AdvisorEngine if not paid in cash, accrued interest) under the convertible note will automatically convert into a class or series of preferred stock substantially identical to that issued in a qualified financing (as defined therein), but at a price per share equal to 80% of the price per share sold in such transaction. In the event of a corporate transaction (as defined therein) the convertible note would be repaid in cash from the proceeds of such transaction in the amount of 1.5 times the outstanding principal amount, plus any accrued and unpaid interest. If neither a qualified financing nor a corporate transaction occur prior to the maturity date, the convertible note is repaid at a rate of 1.25 times the outstanding principal amount, plus accrued and unpaid interest. The convertible note may not be prepaid by AdvisorEngine without the prior consent of the requisite holders (which includes the Company).


32


Table of Contents

ITEM 2. MANAGEMENT’S DISCUSSION AND ANALYSIS OF FINANCIAL CONDITION AND RESULTS OF OPERATIONS

The following discussion and analysis of our financial condition and results of operations should be read together with our consolidated financial statements and the related notes and the other financial information included elsewhere in this Report. In addition to historical consolidated financial information, the following discussion contains forward-looking statements that reflect our plans, estimates and beliefs. Our actual results could differ materially from those discussed in the forward-looking statements. Factors that could cause or contribute to these differences include those discussed below. For a more complete description of the risks noted above and other risks that could cause our actual results to materially differ from our current expectations, please see Item 1A “Risk Factors” in our Annual Report on Form 10-K for the fiscal year ended December 31, 2018. We assume no obligation to update or revise publicly any forward-looking statements, whether as a result of new information, future events or otherwise, unless required by law.

Executive Summary

Introduction

We are the only publicly-traded asset management company that focuses exclusively on exchange-traded products, or ETPs, and are one of the leading ETP sponsors in the world based on assets under management, or AUM, with AUM of $58.9 billion globally as of March 31, 2019. An ETP is a pooled investment vehicle that holds a basket of securities, financial instruments or other assets and generally seeks to track (index-based) or outperform (actively managed) the performance of a broad or specific equity, fixed income or alternatives market segment, commodity or currency (or an inverse or multiple thereof). ETPs are listed on an exchange with their shares traded in the secondary market at market prices, generally at approximately the same price as the net asset value of their underlying components. ETP is an umbrella term that includes exchange-traded funds, or ETFs, exchange-traded notes and exchange-traded commodities.

We focus on creating ETFs for investors that offer thoughtful innovation, smart engineering and redefined investing. We have launched many first-to-market ETFs in the United States and pioneered alternative weighting and performance methods commonly referred to as “smart beta.” However, our U.S. listed ETFs are not beta, but rather an investment innovation we call “Modern Alpha.” Our Modern Alpha approach combines the outperformance potential of active management with the benefits of passive management to offer investors cost-effective ETFs that are built to perform.

Through our operating subsidiaries, we provide investment advisory and other management services to our ETPs collectively offering ETPs covering equity, commodity, fixed income, leveraged and inverse, currency and alternative strategies. In exchange for providing these services, we receive advisory fee revenues based on a percentage of the ETPs’ average daily AUM. Our expenses are predominantly related to selling, operating and marketing our ETPs. We have contracted with third parties to provide certain operational services for the ETPs. We distribute our ETPs through all major channels within the asset management industry, including brokerage firms, registered investment advisers, institutional investors, private wealth managers and discount brokers primarily through our sales force. Our sales efforts are not directed towards the retail segment but rather are directed towards financial or investment advisers that act as intermediaries between the end-client and us.

We strive to deliver a better investing experience through innovative solutions. Continued investments in technology-enabled services and the launch of our Advisor Solutions program in October 2017, which includes portfolio construction, asset allocation, practice management services and wealth management technology, have been made to differentiate us in the market, expand our distribution and further enhance our relationships with financial advisors.

We were incorporated under the laws of the state of Delaware on September 19, 1985 as Financial Data Systems, Inc.

Acquisition of ETFS

In April 2018, we acquired the European exchange-traded commodity, currency and short-and-leveraged business, or ETFS, of ETFS Capital Limited, or ETFS Capital. Throughout this report, we refer to the acquired business as ETFS and the acquisition as the ETFS Acquisition. ETFS had approximately $17.6 billion of AUM as of April 10, 2018. Following the ETFS Acquisition we became the largest global independent ETP provider based on AUM, with significant scale and presence in the U.S. and Europe, the two largest ETP markets.

Industry Developments

In April 2019, the Securities and Exchange Commission approved a form of non-transparent active ETFs that will not be required to disclose their holdings daily, as most ETFs currently are required to do. While market commentators believe there may be increased competition in the ETF industry as some of the largest asset managers who previously did not want to disclose fund holdings on a daily basis may now enter the ETF space, we believe transparency in holdings is one of the hallmarks and benefits of the ETF structure. Further, these non-transparent ETFs may face distribution challenges from gatekeepers and platforms that have been accustomed to greater transparency and it is also unclear how the decreased transparency will impact the liquidity of these non-transparent ETFs.


33


Table of Contents

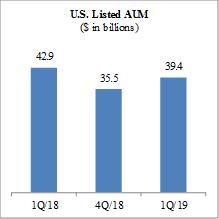
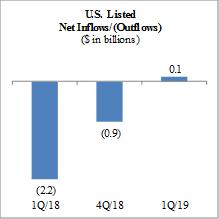
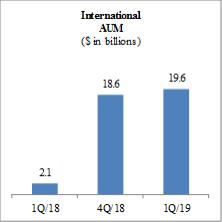
Assets Under Management

WisdomTree ETPs

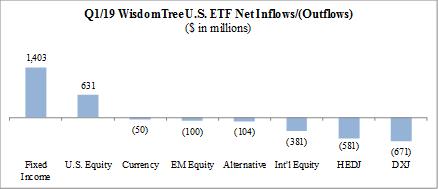
A significant portion of our AUM historically has been held in ETFs that invest in foreign securities. Therefore, our AUM and revenues are affected by movements in global capital markets and the strengthening or weakening of the U.S. dollar against other currencies. Over the last few years, concentrations in HEDJ, our European equity ETF which hedges exposure to the euro, and DXJ, our Japanese equity ETF which hedges exposure to the yen, have declined dramatically as negative investor sentiment toward these products has led to considerable net outflows. While reduced, our exposure to these two ETFs remains significant and therefore the strengthening of the euro or yen against the U.S. dollar, the decline in European or Japanese equity markets, or political or other market risks in either of these markets, may have an adverse effect on our results.

The chart below sets forth the asset mix of our ETPs at March 31, 2018, December 31, 2018 and March 31, 2019:


LOGO

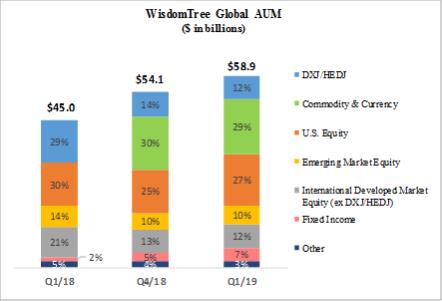
The ETFS Acquisition diversified our investment theme concentrations by adding commodity exposures, predominantly gold, that historically have been negatively correlated with HEDJ and DXJ. While we therefore may experience improved stability of AUM and lower overall AUM volatility, we can provide no assurance that this will be the case.

Market Environment

Performance of the U.S. and European markets recovered from prior quarter volatility as monetary policies in these markets became more accommodative and as concerns over U.S. trade policies toward China dissipated. Emerging markets posted strong returns, led by China, while the Japan markets also performed favorably although somewhat muted as compared to other markets. The price of gold, which experienced bouts of volatility, ultimately remained largely unchanged.

The S&P 500 rose 13.6%, MSCI EAFE (local currency) rose 10.7%, MSCI Emerging Markets Index (U.S. dollar) rose 12.0% and gold prices rose 1.1% during the first quarter of 2019. In addition, the European and Japan equity markets both appreciated with the MSCI EMU Index rising 9.9% and MSCI Japan Index rising 7.7%, respectively, in local currency terms for the quarter. Also, the U.S. dollar strengthened 0.5% versus the yen and 2.0% versus the euro during the quarter.

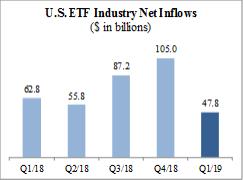
U.S. Listed ETF Industry Flows

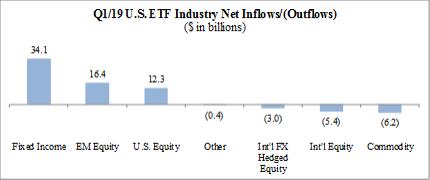
As the charts below reflect, U.S. listed ETF net flows for the three months ended March 31, 2019 were $47.8 billion. Fixed income, emerging market equity and U.S. equity gathered the majority of those flows.


34


Table of Contents

LOGO LOGO

Source: Bloomberg, Investment Company Institute, WisdomTree.

International ETP Industry Flows

As the charts below reflect, international ETP net flows were $32.8 billion for the three months ended March 31, 2019. Fixed income and equities gathered the majority of those flows.


LOGO LOGO

Source: Morningstar

Business Segments

We operate as an ETP sponsor and asset manager providing investment advisory services globally. These activities are reported in our U.S. Business and International Business segments.

U.S. Business Segment

Our U.S. Business segment included our Japan sales office, WTJ, which engaged in selling our U.S. listed ETFs to Japanese institutions. In July 2018, we determined to restructure our distribution strategy in Japan and expanded our existing relationship with Premia Partners Company Limited to manage distribution of our ETFs in Japan. As a result, WTJ has ceased operations and is in the process of being liquidated. During the three months ended March 31, 2018 and 2019, WTJ reported operating losses of $1.2 million and $0.4 million, respectively. WTJ also recognized an impairment expense of $0.6 million in connection with the termination of its office lease on March 31, 2019.

International Business Segment

The International Business segment includes our European business (which now includes ETFS) and our Canadian business.


35


Table of Contents

Our Operating and Financial Results

U.S. Business Segment

Our U.S. listed ETFs’ AUM increased from $35.5 billion at December 31, 2018 to $39.4 billion at March 31, 2019 primarily due to market appreciation.


LOGO LOGO LOGO

International Business Segment

Our international ETPs’ AUM increased from $18.6 billion at December 31, 2018 to $19.6 billion at March 31, 2019 due to market appreciation and net inflows.


LOGO LOGO


36


Table of Contents

LOGO

Consolidated Operating Results

The following table sets forth our revenues and net income/(loss) for the most recent five quarters. Results for the three months ended March 31, 2018 have been reclassified to conform with our current presentation. These reclassifications had no effect on previously reported net income. The results of the second, third and fourth quarters of 2018 have previously been restated.


LOGO


Revenues – We recorded operating revenues of $65.5 million during the three months ended March 31, 2019, up 11.2% from the three months ended March 31, 2018 primarily due to the ETFS Acquisition, partly offset by lower average AUM of our U.S. Business segment.


Expenses – Total operating expenses increased 20.0% from the three months ended March 31, 2018 to $54.8 million primarily due to expenses associated with the ETFS acquired business.


Other Income/(Expenses) – Other income/(expenses) includes interest income and interest expense, gains/(losses) on revaluation of deferred consideration, impairments and other gains and losses.


Net income – Net income decreased 6.4% from the three months ended March 31, 2018 to $8.8 million.


37


Table of Contents

Key Operating Statistics

The following table presents key operating statistics that serve as indicators for the performance of our business:


     Three Months Ended  
     March 31,
2019
    December 31,
2018
    March 31,
2018
 

U.S. LISTED ETFs (in millions)


Beginning of period assets

   $ 35,486     $ 41,556     $ 46,827  

Inflows/(outflows)

     147       (893     (2,167

Market appreciation/(depreciation)

     3,820       (5,177     (1,729

Fund closures

     (87     —         (45


End of period assets

   $ 39,366     $ 35,486     $ 42,886  


Average assets during the period

   $ 38,061     $ 38,246     $ 45,618  

Average ETF advisory fee during the period

     0.45     0.47     0.49

Number of ETFs – end of the period

     77       85       81  

INTERNATIONAL LISTED ETPs (in millions)


Beginning of period assets

   $ 18,608     $ 17,587     $ 2,110  

Inflows/(outflows)

     414       1,138       (47

Market appreciation/(depreciation)

     545       (117     12  


End of period assets

   $ 19,567     $ 18,608     $ 2,075  


Average assets during the period

   $ 19,616     $ 18,175     $ 2,106  

Average ETP advisory fee during the period

     0.47     0.47     0.57

Number of ETPs—end of period

     457       452       99  

PRODUCT CATEGORIES (in millions)


Commodity & Currency


Beginning of period assets

   $ 16,251     $ 15,039     $ 445  

Inflows/(outflows)

     227       984       (28

Market appreciation/(depreciation)

     358       228       (1


End of period assets

   $ 16,836     $ 16,251     $ 416  


Average assets during the period

   $ 17,027     $ 15,658     $ 426  

U.S. Equity


Beginning of period assets

   $ 13,334     $ 15,187     $ 14,234  

Inflows/(outflows)

     632       394       47  

Market appreciation/(depreciation)

     1,914       (2,247     (922


End of period assets

   $ 15,880     $ 13,334     $ 13,359  


Average assets during the period

   $ 14,947     $ 14,291     $ 14,122  

International Developed Market Equity


Beginning of period assets

   $ 14,532     $ 19,590     $ 25,950  

Inflows/(outflows)

     (1,553     (2,384     (2,704

Market appreciation/(depreciation)

     1,438       (2,674     (814


End of period assets

   $ 14,417     $ 14,532     $ 22,432  


Average assets during the period

   $ 14,525     $ 16,962     $ 24,435  

Emerging Market Equity


Beginning of period assets

   $ 5,278     $ 5,346     $ 5,887  

Inflows/(outflows)

     (84     233       425  

Market appreciation/(depreciation)

     536       (301     (23


End of period assets

   $ 5,730     $ 5,278     $ 6,289  


Average assets during the period

   $ 5,502     $ 5,148     $ 6,259  


38


Table of Contents
     Three Months Ended  
     March 31,
2019
     December 31,
2018
     March 31,
2018
 

Fixed Income


Beginning of period assets

   $ 2,570      $ 1,721      $ 862  

Inflows/(outflows)

     1,418        880        253  

Market appreciation/(depreciation)

     35        (31      (14


End of period assets

   $ 4,023      $ 2,570      $ 1,101  


Average assets during the period

   $ 3,511      $ 2,140      $ 1,014  

Leveraged & Inverse


Beginning of period assets

   $ 1,282      $ 1,445      $ 930  

Inflows/(outflows)

     67        (1      (135

Market appreciation/(depreciation)

     70        (162      77  


End of period assets

   $ 1,419      $ 1,282      $ 872  


Average assets during the period

   $ 1,408      $ 1,393      $ 877  

Alternatives


Beginning of period assets

   $ 755      $ 674      $ 582  

Inflows/(outflows)

     (141      178        (70

Market appreciation/(depreciation)

     14        (97      (20


End of period assets

   $ 628      $ 755      $ 492  


Average assets during the period

   $ 666      $ 712      $ 547  

Closed ETPs


Beginning of period assets

   $ 92      $ 141      $ 47  

Inflows/(outflows)

     (5      (39      (2

Market appreciation/(depreciation)

     —          (10      —    

Fund closures

     (87      —          (45


End of period assets

   $ —      $ 92      $ —    


Average assets during the period

   $ 91      $ 117      $ 44  

Headcount – U.S. Business Segment

     141        153        157  

Headcount – International Segment

     75        75        34  

Note: Previously issued statistics may be restated due to fund closures and trade adjustments

Source: Investment Company Institute, Bloomberg, WisdomTree


39


Table of Contents

Three Months Ended March 31, 2019 Compared to Three Months Ended March 31, 2018

Selected Operating and Financial Information


     Three Months Ended
March 31,
     Change      Percent
Change
 
     2019      2018  

Global AUM (in millions)


Average global AUM

   $ 57,677      $ 47,724      $ 9,953        20.9


Operating Revenues (in thousands)


Advisory fees

   $ 64,840      $ 58,456      $ 6,384        10.9

Other income

     645        448        197        44.0


Total revenues

   $ 65,485      $ 58,904      $ 6,581        11.2


Average Global AUM

Our average global AUM increased 20.9% from $47.7 billion at March 31, 2018 to $57.7 billion at March 31, 2019 primarily due to the ETFS Acquisition and net inflows into certain of our ETFs. These increases were partly offset by outflows from HEDJ and DXJ and market depreciation.

Operating Revenues

Advisory fees

Advisory fee revenues increased 10.9% from $58.4 million during the three months ended March 31, 2018 to $64.8 million in the comparable period in 2019 primarily due to the ETFS Acquisition, partly offset by lower average AUM of our U.S. Business segment. Our average global ETP advisory fee has declined 4 basis points, from 0.50% to 0.46% during the three months ended March 31, 2019 due to the ETFS Acquisition and changes in product mix.

Other income

Other income increased 44.0% from $0.4 million during the three months ended March 31, 2018 to $0.6 million in the comparable period in 2019 primarily due to creation/redemption fees earned from the ETFS exchange-traded products.

Operating Expenses


     Three Months Ended
March 31,
     Change      Percent
Change
 
(in thousands)    2019      2018  

Compensation and benefits

   $ 21,301      $ 18,832      $ 2,469        13.1

Fund management and administration

     15,166        10,912        4,254        39.0

Marketing and advertising

     2,680        3,195        (515      (16.1 %) 

Sales and business development

     4,422        3,813        609        16.0

Contractual gold payments

     3,098        —          3,098        n/a  

Professional and consulting fees

     1,482        1,636        (154      (9.4 %) 

Occupancy, communications and equipment

     1,618        1,363        255        18.7

Depreciation and amortization

     269        355        (86      (24.2 %) 

Third-party distribution fees

     2,400        1,725        675        39.1

Acquisition-related costs

     313        2,062        (1,749      (84.8 %) 

Other

     2,053        1,790        263        14.7


Total expenses

   $ 54,802      $ 45,683      $ 9,119        20.0


     Three Months Ended
March 31,
 

As a Percent of Revenues:

   2019     2018  

Compensation and benefits

     32.5     32.0

Fund management and administration

     23.2     18.5

Marketing and advertising

     4.1     5.4

Sales and business development

     6.8     6.5


40


Table of Contents
     Three Months Ended
March 31,
 

As a Percent of Revenues:

   2019     2018  

Contractual gold payments

     4.7     n/a  

Professional and consulting fees

     2.3     2.8

Occupancy, communications and equipment

     2.4     2.3

Depreciation and amortization

     0.4     0.6

Third-party distribution fees

     3.7     2.9

Acquisition-related costs

     0.5     3.5

Other

     3.1     3.1


Total expenses

     83.7     77.6


Compensation and benefits

Compensation and benefits expense increased 13.1% from $18.8 million during the three months ended March 31, 2018 to $21.3 million in the comparable period in 2019 primarily due to higher compensation expense of our International Business segment associated with the ETFS Acquisition and severance expense of $2.0 million, partly offset by lower headcount costs. Headcount of our U.S. Business segment was 157 and our International Business segment was 34 at March 31, 2018 compared to 141 and 75, respectively, at March 31, 2019.

Fund management and administration

Fund management and administration expense increased 39.0% from $10.9 million during the three months ended March 31, 2018 to $15.2 million in the comparable period in 2019 due to higher average AUM of our International Business segment primarily associated with the ETFS Acquisition. We had 81 U.S. listed ETFs and 99 International listed ETPs at March 31, 2018 compared to 77 U.S. listed ETFs and 457 International listed ETPs at March 31, 2019.

Marketing and advertising

Marketing and advertising expense decreased 16.1% from $3.2 million during the three months ended March 31, 2018 to $2.7 million in the comparable period in 2019 primarily due to lower spending of our U.S. Business segment.

Sales and business development

Sales and business development expense increased 16.0% from $3.8 million during the three months ended March 31, 2018 to $4.4 million in the comparable period in 2019 due to sales related activities of the ETFS acquired business.

Contractual gold payments

Contractual gold payments expense was $3.1 million during the three months ended March 31, 2019, which was associated with the payment of 2,375 ounces of gold at an average daily spot price of $1,304 per ounce.

Professional and consulting fees

Professional and consulting fees decreased 9.4% from $1.6 million during the three months ended March 31, 2018 to $1.5 million in the comparable period in 2019 due to lower spending on corporate consulting-related expenses.

Occupancy, communications and equipment

Occupancy, communications and equipment expense increased 18.7% from $1.4 million during the three months ended March 31, 2018 to $1.6 million in the comparable period in 2019 due to additional office space associated with the ETFS Acquisition.

Depreciation and amortization

Depreciation and amortization expense decreased 24.2% from $0.4 million during the three months ended March 31, 2018 to $0.3 million primarily due to the closure of our office in Japan.

Third-party distribution fees

Third-party distribution fees increased 39.1% from $1.7 million during the three months ended March 31, 2018 to $2.4 million in the comparable period in 2019 primarily due to one-time fees for a platform relationship.


41


Table of Contents

Acquisition-related costs

Acquisition-related costs decreased 84.8% from $2.1 million during the three months ended March 31, 2018 to $0.3 million in the comparable period in 2019 as the integration of ETFS is essentially complete.

Other

Other expenses increased 14.7% from $1.8 million during the three months ended March 31, 2018 to $2.1 million in the comparable period in 2019 primarily due to higher International Business segment office expenses associated with an increase in headcount from the ETFS Acquisition.

Other Income/(Expenses)


     Three Months Ended
March 31,
     Change      Percent
Change
 
(in thousands)    2019      2018  

Interest expense

   $ (2,892    $ —      $ (2,892      n/a  

Gain on revaluation of deferred consideration

     4,404        —          4,404        n/a  

Interest income

     779        962        (183      (19.0 %) 

Impairment

     (572      —          (572      n/a  

Other losses, net

     (4,627      (261      (4,366      n/a  


Total other income/(expenses)

   $ (2,908    $ 701      $ (3,609      n/a  


     Three Months Ended March 31,  

As a Percent of Revenues:

   2019     2018  

Interest expense

     (4.4 %)      n/a  

Gain on revaluation of deferred consideration

     6.7     n/a  

Interest income

     1.2     1.6

Impairment

     (0.9 %)      n/a  

Other losses, net

     (7.0 %)      (0.4 %) 


Total other income/(expenses)

     (4.4 %)      1.2


Interest expense

Interest expense for the three months ended March 31, 2019 of $2.9 million was incurred principally in connection with our $200.0 million term loan, or the Term Loan, to facilitate the ETFS Acquisition. Our effective interest rate during the period was 5.5% and includes our cost of borrowing and amortization of issuance costs.

Gain on revaluation of deferred consideration

We recognized a gain on revaluation of deferred consideration of $4.4 million during the three months ended March 31, 2019 as the forward-looking gold curve flattened when compared to the forward-looking curve on December 31, 2018, the date on which the deferred consideration was last measured. The magnitude of the gain is highly correlated to the magnitude of the change in the forward-looking price of gold. See Note 11 to our Consolidated Financial Statements for further information.

Interest income

Interest income decreased 19.0% from the three months ended March 31, 2018 to $0.8 million in the comparable period in 2019 due to the maturity of our short-term investment grade portfolio in the first quarter of 2018, partly offset by paid-in-kind, or PIK, interest on a note receivable from AdvisorEngine Inc.

Impairment

We recognized an impairment of $0.6 million during the three months ended March 31, 2019 in connection with the termination of our Japan office lease.


42


Table of Contents

Other losses, net

Other losses, net were $0.3 million and $4.6 million during the three months ended March 31, 2018 and 2019, respectively. Included in the loss recognized during the three months ended March 31, 2019 is a charge of $4.3 million arising from the release of a tax-related indemnification asset upon the expiration of the statute of limitations. The indemnification arose from the ETFS Acquisition. An equal and offsetting benefit has been recognized in income tax expense. In addition, gains and losses generally arise from the sale of gold earned from management fees paid by our physically-backed gold ETPs, foreign exchange fluctuations, securities owned and other miscellaneous items.

Income tax

Our effective income tax rate for the three months ended March 31, 2019 of negative 13.5% resulted in an income tax benefit of $1.0 million. Our effective income tax rate differs from the federal statutory rate of 21% primarily due a $4.3 million reduction in unrecognized tax benefits, the non-taxable gain on revaluation of deferred consideration and a lower tax rate on foreign earnings, partly offset by a valuation allowance applied to foreign net operating losses, tax shortfalls associated with the vesting and exercise of stock-based compensation awards and state and local income taxes.

Our effective income tax rate for the three months ended March 31, 2018 of 32.3% resulted in income tax expense of $4.5 million. Our effective income tax rate differs from the federal statutory tax rate of 21% primarily due to a valuation allowance on foreign net operating losses and state and local income taxes, partly offset by tax windfalls associated with the vesting and exercise of stock-based compensation awards.


43


Table of Contents

Segment Results

The table below presents the net revenues, operating expenses and income before taxes of our U.S. Business and International Business reportable segments (in thousands, except for average assets during the period, which are in millions).


     Three Months Ended March 31,  
     2019     2018  

U.S. Business Segment


Operating revenues


Advisory fees

   $ 42,517     $ 55,518  

Other income

     106       147  


Total operating revenues

   $ 42,623     $ 55,665  


Total operating expenses

   $ (37,176   $ (39,030


Other income/(expenses)


Interest expense

   $ (192   $ —    

Interest income

     779       962  

Impairment

     (572     —    

Other gains/(losses), net

     145       (226


Total other income

   $ 160     $ 736  


Total income before taxes (U.S. Business Segment)

   $ 5,607     $ 17,371  


Average assets during the period (in millions)

   $ 38,061     $ 45,618  

Average ETF advisory fee during the period

     0.45     0.49

International Business Segment


Operating revenues


Advisory fees

   $ 22,323     $ 2,938  

Other income

     539       301  


Total operating revenues

   $ 22,862     $ 3,239  


Total operating expenses

   $ (17,626   $ (6,653


Other income/(expenses)


Interest expense

   $ (2,700   $ —    

Gain on revaluation of deferred consideration

     4,404       —    

Other losses, net

     (4,772     (35


Total other expenses

   $ (3,068   $ (35


Total income/(loss) before taxes (International Business Segment)

   $ 2,168     $ (3,449


Average assets during the period (in millions)

   $ 19,616     $ 2,106  

Average ETP advisory fee during the period

     0.47     0.57

Income/(loss) before taxes


U.S. Business segment

   $ 5,607     $ 17,371  

International Business segment

     2,168       (3,449


Total income before taxes

   $ 7,775     $ 13,922  


44


Table of Contents

Three Months Ended March 31, 2019 Compared to Three Months Ended March 31, 2018

U.S. Business segment

Operating revenues of the U.S. Business segment decreased 23.4% from $55.7 million during the three months ended March 31, 2018 to $42.6 million in the comparable period in 2019. The decrease was attributable to net outflows from HEDJ and DXJ, market depreciation and lower average U.S. listed ETF advisory fees due to a change in product mix. These decreases were partly offset by net inflows into certain of our U.S. listed ETFs. Our average U.S. advisory fee was 0.49% and 0.45% during the three months ended March 31, 2018 and 2019, respectively.

Operating expenses of the U.S. Business segment decreased 4.8% from $39.0 million during the three months ended March 31, 2018 to $37.2 million in the comparable period in 2019 due primarily to lower acquisition-related costs, lower marketing and advertising expense, lower fund management and administration expense, lower professional fees and lower incentive compensation. These decreases were partly offset by higher third-party distribution fees and severance expense of $2.0 million. Headcount of our U.S. Business segment was 157 and 141 at March 31, 2018 and 2019, respectively.

Other income/(expenses) of the U.S. Business segment were $0.2 million during the three months ended March 31, 2019, which was comprised of interest income of $0.8 million and other net gains of $0.2 million, partly offset by an impairment of ($0.6) million recognized in connection with the termination of our Japan office lease and interest expense of ($0.2) million. Other income/(expenses) for the three months ended March 31, 2018 were $0.7 million and were comprised of interest income of $0.9 million, partly offset by other net losses of ($0.2) million.

International Business segment

Operating revenues of the International Business segment increased 605.8% from $3.2 million during the three months ended March 31, 2018 to $22.9 million in the comparable period in 2019. This increase was attributable to higher average AUM associated with the ETFS Acquisition.

Operating expenses of the International Business segment increased 164.9% from $6.7 million during the three months ended March 31, 2018 to $17.6 million in the comparable period in 2019 primarily due to the ETFS Acquisition. Fund management and administration expense and compensation expense increased due to higher average AUM and higher headcount, respectively. Sales and business development expense increased due to sales related activities of the ETFS acquired business. In addition, during the three months ended March 31, 2019 we recognized contractual gold payment expense of $3.1 million.

Other income/(expenses) of our International Business segment were ($3.1) million during the three months ended March 31, 2019, which was comprised of a loss of ($4.3) million arising from the reduction of a tax-related indemnification asset upon the expiration of the statute of limitations, interest expense of ($2.7) million and other net losses of ($0.4) million. These losses were partly offset by a gain on revaluation of deferred consideration of $4.4 million.

Liquidity and Capital Resources

The following table summarizes key data regarding our liquidity, capital resources and use of capital to fund our operations:


     March 31,
2019
     December 31,
2018
 

Balance Sheet Data (in thousands):


Cash and cash equivalents

   $ 78,942      $ 77,784  

Accounts receivable

     28,136        25,834  

Securities held-to-maturity

     20,159        20,180  

Securities owned, at fair value

     6,419        8,873  


Total: Liquid assets

     133,656        132,671  

Less: Total current liabilities

     (62,753      (62,801


Subtotal

     70,903        69,870  

Plus: Revolving credit facility—undrawn

     50,000        50,000  


Total: Available liquidity

   $ 120,903      $ 119,870  


45


Table of Contents
     Three Months Ended March 31,  
     2019      2018  

Cash Flow Data (in thousands):


Operating cash flows

   $ 7,852      $ (4,836

Investing cash flows

     11        60,513  

Financing cash flows

     (7,088      (4,812

Foreign exchange rate effect

     383        593  


Increase in cash and cash equivalents

   $ 1,158      $ 51,458  


Liquidity

We consider our available liquidity to be our liquid assets and available borrowings under our revolving credit facility, less our current liabilities. Liquid assets consist of cash and cash equivalents, accounts receivable, securities held-to-maturity and securities owned, at fair value. Our securities owned, at fair value are highly liquid investments. Certain securities are accounted for as held-to-maturity securities and we have the intention and ability to hold them to maturity. However, these securities are also readily traded and, if needed, could be sold for liquidity. Accounts receivable are current assets and primarily represent receivables from advisory fees we earn from our ETPs. Our current liabilities consist primarily of payments owed to vendors and third parties in the normal course of business, deferred consideration and accrued incentive compensation for employees.

See the section below titled “Credit Facility” for a discussion of our revolving credit facility.

Cash and cash equivalents increased $1.1 million during the three months ended March 31, 2019 due to net cash provided by operating activities of $7.9 million and $0.3 million from changes in foreign exchange rates. These increases were partly offset by $5.1 million used to pay dividends on our common stock and $2.0 million used to repurchase our common stock.

Cash and cash equivalents increased $51.5 million during the three months ended March 31, 2018 due to $60.5 million from sales and maturities of debt securities available for sale and $0.6 million from changes in foreign exchange rates. These increases were partly offset by $4.8 million of net cash used in operating activities, $4.1 million used to pay dividends on our common stock and $0.7 million used to repurchase our common stock.

Credit Facility

On April 11, 2018 and in connection with the ETFS Acquisition, we entered into a credit agreement with Credit Suisse AG and certain other lenders. Under the credit agreement, the lenders extended us a $200.0 million Term Loan, the net cash proceeds of which were used, together with other cash on hand, to complete the acquisition and pay certain related fees, costs and expenses, and made a $50.0 million revolving credit facility, or the Revolver, available to us for revolving borrowings from time to time for working capital, capital expenditures and general corporate purposes. The Term Loan, together with the Revolver, are referred to herein as the Credit Facility.

Interest on the Term Loan accrues at an annual rate equal to LIBOR, plus up to 2.00% (commencing at LIBOR, plus 1.75%), and interest on the Revolver accrues at an annual rate equal to LIBOR, plus up to 1.50% (commencing at LIBOR, plus 1.25%), in each case, with the exact interest rate margin determined based on the Total Leverage Ratio (as defined below). The Revolver is also subject to a facility fee equal to an annual rate of up to 0.50% of the actual daily amount of the aggregate commitments (whether used or unused) under the Revolver, with the exact facility fee rate determined based on the Total Leverage Ratio. The Credit Facility matures on April 11, 2021. The Term Loan does not amortize and the entire principal balance is due in a single payment on the maturity date.

The credit agreement governing the terms of the Credit Facility includes a financial covenant that requires that we maintain a Total Leverage Ratio, calculated as of the last day of each fiscal quarter, equal to or less than the ratio set forth opposite such fiscal quarter:


Fiscal Quarter Ending

   Total Leverage Ratio  

March 31, 2019

     2.75:1.00  

June 30, 2019

     2.50:1.00  

September 30, 2019

     2.50:1.00  

December 31, 2019

     2.50:1.00  

March 31, 2020

     2.25:1.00  

June 30, 2020

     2.25:1.00  

September 30, 2020 and each subsequent fiscal quarter ending on or before the maturity date

     2.00:1.00  


46


Table of Contents

Total Leverage Ratio means, as of the last day of any fiscal quarter, the ratio of Consolidated Total Debt of ours and our restricted subsidiaries (as defined in the credit agreement) as of such date to Consolidated EBITDA of ours and our restricted subsidiaries (as defined in the credit agreement) for the four consecutive fiscal quarters ended on such date.

The credit agreement contains customary affirmative covenants for transactions of this type and other affirmative covenants agreed to by the parties, including, among others, the provision of annual and quarterly financial statements and compliance certificates, maintenance of property, insurance, compliance with laws and environmental matters. The credit agreement contains customary negative covenants, including among others, restrictions on the incurrence of indebtedness, granting of liens, making investments and acquisitions, paying dividends, repurchasing equity interests of ours, entering into affiliate transactions and asset sales. The credit agreement also provides for a number of customary events of default, including, among others, payment, bankruptcy, covenant, representation and warranty, change of control and judgment defaults.

We are in compliance with our covenants under the credit agreement.

Capital Resources

Our principal source of financing is our operating cash flow. We believe that current cash flows generated by our operating activities and existing cash balances should be sufficient for us to fund our operations for at least the next 12 months. In addition, we have access to the Revolver for working capital, capital expenditures and general corporate purposes. No amounts are currently outstanding under the Revolver.

Use of Capital

Our business does not require us to maintain a significant cash position. However, certain of our subsidiaries of our International Business segment are required to maintain a minimum level of net liquid assets, which at March 31, 2019 was approximately $12.2 million in the aggregate. Notwithstanding these net liquid asset requirements, we expect that our main uses of cash will be to fund the ongoing operations of our business. Also, as part of our capital management, we maintain a capital return program which includes a $0.03 per share quarterly cash dividend and authority to purchase our common stock through April 27, 2022, including purchases to offset future equity grants made under our equity plans. As previously mentioned, under the terms of the credit agreement, we are subject to various covenants including compliance with the Total Leverage Ratio. A quarterly dividend payment in excess of $0.03 per share and repurchases of our common stock (excluding purchases of our common stock withheld pursuant to the terms of equity awards granted to employees to satisfy tax withholding obligations) are permitted only to the extent the Total Leverage Ratio does not exceed 1.75 to 1.00 and no event of default (as defined in the credit agreement) has occurred and is continuing at the time the cash dividend payment or stock repurchase is made.

During the three months ended March 31, 2019, we repurchased 311,213 shares of our common stock under the repurchase program for an aggregate cost of $2.0 million. At March 31, 2019, $83.7 million remained under this program for future purchases.

Contractual Obligations

The following table summarizes our future cash payments associated with contractual obligations as of March 31, 2019:


     Total      Payments Due by Period  
   (in thousands)  
   Less than 1
year
     1 to 3 years      3 to 5 years      More than 5
years
 

Term Loan

   $ 200,000      $ —        $ 200,000      $ —        $ —    

Operating leases

     32,933        2,723        9,611        5,995        14,604  


Total

   $ 232,933      $ 2,723      $ 209,611      $ 5,995      $ 14,604  


Off-Balance Sheet Arrangements

We do not have any off-balance sheet financing or other arrangements and have neither created nor are party to any special-purpose or off-balance sheet entities for the purpose of raising capital, incurring debt or operating our business.


47


Table of Contents

Critical Accounting Policies

Business Combinations

We account for business combinations under the acquisition method of accounting in accordance with Accounting Standards Codification Topic 805, Business Combinations, which requires an allocation of the consideration we paid to the identifiable assets, intangible assets and liabilities based on the estimated fair values as of the closing date of the acquisition. The excess of the fair value of purchase price over the fair values of these identifiable assets, intangible assets and liabilities is recorded as goodwill.

Goodwill and Intangible Assets

Goodwill is the excess of the fair value of the purchase price over the fair values of the identifiable net assets at the acquisition date. We test our goodwill for impairment at least annually and at the time of a triggering event requiring re-evaluation, if one were to occur, in accordance with Accounting Standards Update, or ASU, 2017-04 Intangibles-Goodwill and Other (Topic 350): Simplifying the Test for Goodwill Impairment. We early adopted the revised guidance for impairment tests performed after January 1, 2017. Under the revised guidance, goodwill is considered impaired when the estimated fair value of the reporting unit that was allocated the goodwill is less than its carrying value. If the estimated fair value of such reporting unit is less than its carrying value, goodwill impairment is recognized based on that difference, not to exceed the carrying amount of goodwill. A reporting unit is an operating segment or a component of an operating segment provided that the component constitutes a business for which discrete financial information is available and management regularly reviews the operating results of that component.

For impairment testing purposes, goodwill has been allocated to our U.S. Business reporting unit which is assessed annually for impairment on April 30th. In addition, goodwill arising from the ETFS Acquisition (See Note 3 to our Consolidated Financial Statements) has been allocated to the European Business reporting unit included in the International Business reportable segment and assessed annually for impairment on November 30th. When performing our goodwill impairment test, we consider a qualitative assessment, when appropriate, and the income approach, market approach and our market capitalization when determining the fair value of our reporting units.

Indefinite-lived intangible assets are tested for impairment at least annually and are reviewed for impairment whenever events or changes in circumstances indicate that the carrying amount of an asset may not be recoverable. Indefinite-lived intangible assets are impaired if their estimated fair value is less than their carrying value. We may rely on a qualitative assessment when performing our intangible asset impairment test. Otherwise, the impairment evaluation is performed at the lowest level of reasonably identifiable cash flows independent of other assets. The annual impairment testing date for all our intangible assets is November 30th.

Investments, Carried at Cost

We account for equity investments that do not have a readily determinable fair value as cost method investments under the measurement alternative prescribed within ASU 2016-01, Financial Instruments – Recognition and Measurement of Financial Assets and Financial Liabilities, to the extent such investments are not subject to consolidation or the equity method. Under the measurement alternative, these financial instruments are carried at cost, less any impairment (assessed quarterly), plus or minus changes resulting from observable price changes in orderly transactions for an identical or similar investment of the same issuer. In addition, income is recognized when dividends are received only to the extent they are distributed from net accumulated earnings of the investee. Otherwise, such distributions are considered returns of investment and are recorded as a reduction of the cost of the investment.

Revenue Recognition

We earn substantially all of our revenue in the form of advisory fees from our ETPs and recognize this revenue over time, as the performance obligation is satisfied. ETP advisory fees are based on a percentage of the ETPs’ average daily net assets. Progress is measured using the practical expedient under the output method resulting in the recognition of revenue in the amount for which we have a right to invoice.

Recently Issued Accounting Pronouncements

In June 2016, the FASB issued ASU 2016-13, Financial Instruments-Credit Losses (Topic 326) – Measurement of Credit Losses on Financial Instruments (ASU 2016-13). The main objective of the standard is to provide financial statement users with more decision-useful information about the expected credit losses on financial instruments and other commitments to extend credit held by a reporting entity at each reporting date. In issuing this standard, the FASB is responding to criticism that today’s guidance delays recognition of credit losses. The standard will replace today’s “incurred loss” approach with an “expected loss” model. The new model, referred to as the current expected credit loss (“CECL”) model, will apply to: (1) financial assets subject to credit losses and measured at amortized cost, and (2) certain off-balance sheet credit exposures. The standard is applicable to loans, accounts receivable, trade receivables, and other financial assets measured at amortized cost, loan commitments and certain other off-balance sheet credit exposures, debt securities (including those held-to-maturity) and other financial assets measured at fair value through


48


Table of Contents

other comprehensive income, and beneficial interests in securitized financial assets. The CECL model does not apply to available-for-sale debt securities. For available-for-sale debt securities with unrealized losses, entities will measure credit losses in a manner similar to what they do today, except that the credit losses will be recognized as allowances rather than reductions in the amortized cost of the securities. Accordingly, the new methodology will be utilized when assessing our financial instruments for impairment. As a result, entities will recognize improvements to estimated credit losses immediately in earnings rather than as interest income over time, as they do today. The ASU also simplifies the accounting model for purchased credit-impaired debt securities and loans. ASU 2016-13 also expands the disclosure requirements regarding an entity’s assumptions, models, and methods for estimating the allowance for loan and lease losses. ASU 2016-13 is effective for years beginning after December 15, 2019, including interim periods within those fiscal years under a modified retrospective approach. Early adoption is permitted for the periods beginning after December 15, 2018. We are currently evaluating the impact that this standard will have on our consolidated financial statements and plan to adopt this standard on January 1, 2020.

In August 2018, the FASB issued ASU 2018-13, Fair Value Measurement (Topic 820) – Disclosure Framework – Changes to the Disclosure Requirements for Fair Value Measurement (ASU 2018-13), which modifies the disclosure requirements on fair value measurements, including removing the requirement to disclose (1) the amount of and reasons for transfers between Level 1 and Level 2 of the fair value hierarchy, (2) the policy for timing of transfers between levels and (3) the valuation processes for Level 3 fair value measurements. ASU 2018-13 also added new disclosures including the requirement to disclose (a) the changes in unrealized gains and losses for the period included in other comprehensive income for recurring Level 3 fair value measurements held at the end of the reporting period and (b) the range and weighted average of significant unobservable inputs used to develop Level 3 fair value measurements. ASU 2018-13 is effective for fiscal years (and interim reporting periods within those years) beginning after December 15, 2019 and early adoption is permitted. This standard will only impact the disclosures pertaining to fair value measurements. We plan to adopt this standard on January 1, 2020.

ITEM 3. QUANTITATIVE AND QUALITATIVE DISCLOSURES ABOUT MARKET RISK

The following information, together with information included in other parts of this Management’s Discussion and Analysis of Financial Condition and Results of Operations, describes key aspects of our market risk.

Market Risk

Market risk to us generally represents the risk of changes in the value of our ETPs that results from fluctuations in securities or commodity prices, foreign currency exchange rates against the U.S. dollar, and interest rates. Nearly all our revenues are derived from advisory agreements for the WisdomTree ETPs. Under these agreements, the advisory fee we receive is based on the average market value of the assets in the WisdomTree ETP portfolios we manage.

Fluctuations in the value of the ETPs are common and are generated by numerous factors such as market volatility, the overall economy, inflation, changes in investor strategies and sentiment, availability of alternative investment vehicles, government regulations and others. Accordingly, changes in any one or a combination of these factors may reduce the value of investment securities and, in turn, the underlying AUM on which our revenues are earned. These declines may cause investors to withdraw funds from our ETPs in favor of investments that they perceive as offering greater opportunity or lower risk, thereby compounding the impact on our revenues. We believe challenging and volatile market conditions will continue to be present in the foreseeable future.

Interest Rate Risk

We invest our corporate cash in short-term interest earning assets, primarily money market instruments at a commercial bank, federal agency debt instruments and other securities which totaled $27.4 million and $25.8 million as of December 31, 2018 and March 31, 2019, respectively. We do not anticipate that changes in interest rates will have a material impact on our financial condition, operating results or cash flows.

In addition, in connection with the ETFS Acquisition, we obtained a $250.0 million Credit Facility consisting of a $200.0 million Term Loan and $50.0 million Revolver. Interest rate risk is not significant as borrowings under these facilities accrue interest at variable rates (See Note 12 to our Consolidated Financial Statements).

Exchange Rate Risk

Over the last few years, we have expanded our business globally and are subject to currency translation exposure on the results of our non-U.S. operations, primarily in Europe and Canada. Foreign currency translation risk is the risk that exchange rate gains or losses arise from translating foreign entities’ statements of earnings and balance sheets from functional currency to our reporting currency (the U.S. dollar) for consolidation purposes. Historically we generated the vast majority of our revenues and expenses in the U.S. dollar. However, upon completion of the ETFS Acquisition our exposure to exchange rate risk has increased. While the advisory fees earned by ETFS are predominantly in U.S. dollars (and also paid in gold ounces, as described below), expenses for corporate overhead are generally incurred in British pounds. Currently, we do not enter into derivative financial instruments aimed at offsetting certain exposures in the statement of operations or the balance sheet but may seek to do so in the future.


49


Table of Contents

Exchange rate risk associated with the euro and Canadian dollar is not considered to be significant.

Commodity Price Risk

The completion of the ETFS Acquisition has provided us with an industry leading position in European-listed gold and commodity products. Fluctuations in the prices of commodities that are linked to certain of these ETPs could have a material adverse effect on ETFS’s AUM and revenues. In addition, a portion of the advisory fee revenues we receive on our ETPs backed by gold are paid in gold ounces. In addition, we pay gold ounces to satisfy our deferred consideration obligation that we assumed in connection with the ETFS Acquisition (See Note 11 to our Consolidated Financial Statements). While we may readily sell the gold that we earn under these advisory contracts, we still may maintain a position. We currently do not enter into arrangements to hedge against fluctuations in the price of gold and any hedging we may undertake in the future may not be cost-effective or sufficient to hedge against this gold exposure.

ITEM 4. CONTROLS AND PROCEDURES

Evaluation of Disclosure Controls and Procedures

As of March 31, 2019, our management, with the participation of our Chief Executive Officer, Chief Financial Officer and Chief Accounting Officer, evaluated the effectiveness of our disclosure controls and procedures pursuant to Rule 13a-15(b) promulgated under the Securities Exchange Act of 1934, as amended, or the Exchange Act. Based upon that evaluation, our Chief Executive Officer, Chief Financial Officer and Chief Accounting Officer concluded that, as of March 31, 2019, our disclosure controls and procedures were effective at a reasonable assurance level in ensuring that material information required to be disclosed by us in the reports that we file or submit under the Exchange Act is recorded, processed, summarized and reported within the time periods specified in the rules, regulations and forms of the SEC, including ensuring that such material information is accumulated by and communicated to our management, including our Chief Executive Officer, Chief Financial Officer and Chief Accounting Officer, as appropriate to allow timely decisions regarding required disclosure. See “Changes in Internal Control over Financial Reporting” below for a discussion regarding the ETFS Acquisition which we completed on April 11, 2018 (See Note 3 to our Consolidated Financial Statements).

Changes in Internal Control over Financial Reporting

As of the date of this Report, we are in the process of completing the integration of the acquired operations of ETFS into our overall internal control over financial reporting, or ICFR, and have deferred our assessment of the ICFR related to ETFS, which constituted 2% and 7% of total and net assets, respectively, at March 31, 2019, and 30% of revenues for the three months then ended.

Notwithstanding the ETFS Acquisition, during the quarter ended March 31, 2019, there were no changes in our internal control over financial reporting that have materially affected, or are reasonably likely to materially affect, our internal control over financial reporting.

PART II: OTHER INFORMATION

ITEM 1. LEGAL PROCEEDINGS

None.

ITEM 1A. RISK FACTORS

You should carefully consider the information set forth in this Report, as well as the information in Part 1, Item 1A. “Risk Factors” in our Annual Report on Form 10-K for the fiscal year ended December  31, 2018.

ITEM 2. UNREGISTERED SALES OF EQUITY SECURITIES AND USE OF PROCEEDS

Recent sales of Unregistered Securities

None.

Use of Proceeds

Not applicable.


50


Table of Contents

Purchases of Equity Securities by the Issuer and Affiliated Purchasers

The following table provides information with respect to purchases made by or on behalf of us or any “affiliated purchaser” of shares of our common stock.


Period

   Total Number
of Shares
Purchased
     Average Price
Paid Per Share
     Total Number of
Shares Purchased
as
Part of Publicly
Announced Plans
or
Programs(1)
     Approximate
Dollar
Value of
Shares that
May Yet Be
Purchased
Under the
Plans or
Programs
 
                          (in thousands)  

January 1, 2019 to January 31, 2019

     304,809      $ 6.43        304,809     

February 1, 2019 to February 28, 2019

     —        $ —        —       

March 1, 2019 to March 31, 2019

     6,404      $ 7.06        6,404     


Total

     311,213      $ 6.44        311,213      $ 83,724  


(1)

On April 24, 2019, our Board of Directors extended the term of our share repurchase program for three years through April 27, 2022. During the three months ended March 31, 2019, we repurchased 311,213 shares of our common stock under this program for an aggregate cost of approximately $2.0 million. As of March 31, 2019, $83.7 million remained under this program for future purchases. Under the terms of the credit agreement, share repurchases are permitted only to the extent the Total Leverage Ratio does not exceed 1.75 to 1.00 and no event of default (as defined in the credit agreement) has occurred and is continuing at the time the stock repurchase is made. However, our ability to purchase shares of our common stock withheld pursuant to the terms of equity awards granted to employees to satisfy tax withholding obligations is not restricted.

ITEM 3. DEFAULTS UPON SENIOR SECURITIES

None.

ITEM 4. MINE SAFETY DISCLOSURES

Not applicable.

ITEM 5. OTHER INFORMATION

None.


51


Table of Contents

ITEM 6. EXHIBITS


Exhibit No.


Description

3.1   Amended and Restated Certificate of Incorporation (incorporated by reference to Exhibit 3.1 of the Registrant’s Registration Statement on Form 10, filed with the SEC on March 31, 2011)
3.2   Certificate of Designations of Series A Non-Voting Convertible Preferred Stock of the Registrant (incorporated by reference to Exhibit 3.1 of the Registrant’s Current Report on Form 8-K filed with the SEC on April 13, 2018)
3.3   Second Amended and Restated Bylaws (incorporated by reference to Exhibit 3.1 of the Registrant’s Current Report on Form 8-K, filed with the SEC on February 26, 2019)
4.1   Specimen Common Stock Certificate (incorporated by reference to Exhibit 4.1 of the Registrant’s Registration Statement on Form 10, filed with the SEC on March 31, 2011)
4.2   Amended and Restated Stockholders Agreement among the Registrant and certain investors dated December  21, 2006 (incorporated by reference to Exhibit 4.2 of the Registrant’s Registration Statement on Form 10, filed with the SEC on March 31, 2011)
4.3   Securities Purchase Agreement among the Registrant and certain investors dated December  21, 2006 (incorporated by reference to Exhibit 4.3 of the Registrant’s Registration Statement on Form 10, filed with the SEC on March 31, 2011)
4.4   Securities Purchase Agreement among the Registrant and certain investors dated October  15, 2009 (incorporated by reference to Exhibit 4.4 of the Registrant’s Registration Statement on Form 10, filed with the SEC on March 31, 2011)
4.5   Third Amended and Restated Registration Rights Agreement dated October  15, 2009 (incorporated by reference to Exhibit 4.5 of the Registrant’s Registration Statement on Form 10, filed with the SEC on March 31, 2011)
4.6   Investor Rights Agreement, dated April  11, 2018, between the Registrant and ETF Securities Limited (incorporated by reference to Exhibit 4.1 of the Registrant’s Current Report on Form 8-K filed with the SEC on April 13, 2018)
10.1   Share Sale Agreement among the Registrant, WisdomTree International and ETF Securities Limited dated November  13, 2017 (incorporated by reference to Exhibit 4.6 of the Registrant’s Annual Report on Form 10-K filed with the SEC on March 1, 2018)
10.2   Waiver and Variation Agreement, dated April  11, 2018, by and among the Registrant, WisdomTree International and ETF Securities Limited (incorporated by reference to Exhibit 10.2 of the Registrant’s Current Report on Form 8-K filed with the SEC on April  13, 2018)
10.3   Credit Agreement, dated April  11, 2018, by and among the Registrant, WisdomTree International, certain subsidiaries of the Company as guarantors, the lenders party thereto and Credit Suisse AG, Cayman Islands Branch, as administrative agent, collateral agent, L/C Issuer and lender (incorporated by reference to Exhibit 10.1 of the Registrant’s Current Report on Form 8-K filed with the SEC on April 13, 2018)
31.1 (1)   Certification of Chief Executive Officer and Principal Executive Officer pursuant to Rule 13a-14 of the Exchange Act
31.2 (1)   Certification of Chief Financial Officer and Principal Financial Officer pursuant to Rule 13a-14 of the Exchange Act
31.3 (1)   Certification of Chief Accounting Officer and Principal Accounting Officer pursuant to Rule 13a-14 of the Exchange Act
32 (1)   Section 1350 Certification


52


Table of Contents

Exhibit No.


Description

101 (1)   Financial Statements from the Quarterly Report on Form 10-Q of the Company for the three months ended March 31, 2019, formatted in XBRL: (i) Consolidated Balance Sheets at March 31, 2019 and December 31, 2018; (ii) Consolidated Statements of Operations and Comprehensive Income for the three months ended March 31, 2019 and March 31, 2018 (Unaudited); (iii) Consolidated Statements of Changes in Stockholders’ Equity for the three months ended March 31, 2019 and March 31, 2018 (Unaudited) (iv) Consolidated Statements of Cash Flows for the three months ended March 31, 2019 and March 31, 2018 (Unaudited); and (v) Notes to Consolidated Financial Statements, as blocks of text and in detail.
101.INS (1)   XBRL Instance Document
101.SCH (1)   XBRL Taxonomy Extension Schema Document
101.CAL (1)   XBRL Taxonomy Extension Calculation Linkbase Document
101.DEF (1)   XBRL Taxonomy Extension Definition Linkbase Document
101.LAB (1)   XBRL Taxonomy Extension Label Linkbase Document
101.PRE (1)   XBRL Taxonomy Extension Presentation Linkbase Document


(1)

Filed herewith.


53


Table of Contents

SIGNATURE

Pursuant to the requirements of the Securities Exchange Act of 1934, the registrant has duly caused this Report to be signed on its behalf by the undersigned thereunto duly authorized on this 9th day of May 2019.


WISDOMTREE INVESTMENTS, INC.
By:  

/s/ Jonathan Steinberg

  Jonathan Steinberg
 

President and Chief Executive Officer

(Principal Executive Officer)

WISDOMTREE INVESTMENTS, INC.
By:  

/s/ Amit Muni

  Amit Muni
 

Chief Financial Officer

(Principal Financial Officer)

WISDOMTREE INVESTMENTS, INC.
By:  

/s/ Bryan Edmiston

  Bryan Edmiston
 

Chief Accounting Officer

(Principal Accounting Officer)


54