false2019Q20000880631--12-31Represents payments during the period April 11, 2018 through June 30, 2018. 0000880631 2019-01-01 2019-06-30 0000880631 2019-06-30 0000880631 2018-12-31 0000880631 2019-04-01 2019-06-30 0000880631 2018-04-01 2018-06-30 0000880631 2018-01-01 2018-06-30 0000880631 2018-01-01 2018-12-31 0000880631 2016-05-21 2016-06-20 0000880631 2019-01-01 2019-03-31 0000880631 2018-04-11 0000880631 2018-04-01 2018-04-11 0000880631 2019-01-01 0000880631 2018-06-30 0000880631 2019-07-25 0000880631 2019-03-31 0000880631 2018-03-31 0000880631 2017-12-31 0000880631 wetf:UnsecuredNoteReceivableMember 2019-01-01 2019-06-30 0000880631 wetf:ConvertibleNoteReceivableMember 2019-01-01 2019-06-30 0000880631 wetf:ThesysGroupIncMember 2019-01-01 2019-06-30 0000880631 wetf:AdvisorEngineMember 2019-01-01 2019-06-30 0000880631 wetf:USBusinessSegmentMember us-gaap:ReportableSubsegmentsMember 2019-01-01 2019-06-30 0000880631 wetf:EuropeanBusinessSegmentMember us-gaap:ReportableSubsegmentsMember 2019-01-01 2019-06-30 0000880631 wetf:EmployeesAndDirectorsMember 2019-01-01 2019-06-30 0000880631 us-gaap:EquipmentMember 2019-01-01 2019-06-30 0000880631 us-gaap:FurnitureAndFixturesMember 2019-01-01 2019-06-30 0000880631 wetf:ThreeYearShareRepurchaseProgramMember 2019-01-01 2019-06-30 0000880631 wetf:AdvisorEngineMember us-gaap:ConvertiblePreferredStockMember us-gaap:SeriesAPreferredStockMember 2019-01-01 2019-06-30 0000880631 us-gaap:NotesReceivableMember 2019-01-01 2019-06-30 0000880631 wetf:WisdomTreeTrustMember wetf:AdvisoryServicesMember 2019-01-01 2019-06-30 0000880631 wetf:ETFSIssuersMember wetf:AdvisoryServicesMember 2019-01-01 2019-06-30 0000880631 wetf:BoostIssuerPLCAndWisdomtreeIssuerplcMember wetf:AdvisoryServicesMember 2019-01-01 2019-06-30 0000880631 wetf:WisdomtreeAssetManagementCanadaIncMember wetf:AdvisoryServicesMember 2019-01-01 2019-06-30 0000880631 wetf:WisdomtreeCommodityServicesLlcMember wetf:AdvisoryServicesMember 2019-01-01 2019-06-30 0000880631 wetf:AdvisoryServicesMember 2019-01-01 2019-06-30 0000880631 wetf:USBusinessSegmentMember 2019-01-01 2019-06-30 0000880631 wetf:InternationalBusinessSegmentMember 2019-01-01 2019-06-30 0000880631 wetf:USBusinessSegmentMember us-gaap:InvestmentAdvisoryManagementAndAdministrativeServiceMember 2019-01-01 2019-06-30 0000880631 wetf:InternationalBusinessSegmentMember us-gaap:InvestmentAdvisoryManagementAndAdministrativeServiceMember 2019-01-01 2019-06-30 0000880631 us-gaap:CommonStockMember 2019-01-01 2019-06-30 0000880631 us-gaap:AdditionalPaidInCapitalMember 2019-01-01 2019-06-30 0000880631 us-gaap:InvestmentAdvisoryManagementAndAdministrativeServiceMember 2019-01-01 2019-06-30 0000880631 wetf:OtherServicesIncomeMember 2019-01-01 2019-06-30 0000880631 us-gaap:AccumulatedOtherComprehensiveIncomeMember 2019-01-01 2019-06-30 0000880631 srt:MinimumMember wetf:ThesysGroupIncMember us-gaap:PreferredStockMember us-gaap:FairValueInputsLevel3Member us-gaap:IncomeApproachValuationTechniqueMember 2019-01-01 2019-06-30 0000880631 srt:MaximumMember wetf:ThesysGroupIncMember us-gaap:PreferredStockMember us-gaap:FairValueInputsLevel3Member us-gaap:IncomeApproachValuationTechniqueMember 2019-01-01 2019-06-30 0000880631 srt:WeightedAverageMember wetf:ThesysGroupIncMember us-gaap:PreferredStockMember us-gaap:FairValueInputsLevel3Member us-gaap:IncomeApproachValuationTechniqueMember 2019-01-01 2019-06-30 0000880631 wetf:WisdomTreeJapanMember 2019-01-01 2019-06-30 0000880631 wetf:AcquisitionOfEtfsBusinessMember 2019-01-01 2019-06-30 0000880631 wetf:QuestradeETFsMember 2019-01-01 2019-06-30 0000880631 us-gaap:RetainedEarningsMember 2019-01-01 2019-06-30 0000880631 us-gaap:PreferredStockMember 2019-01-01 2019-06-30 0000880631 wetf:DeferredConsiderationObligationMember 2019-01-01 2019-06-30 0000880631 wetf:AcquisitionOfEtfsBusinessMember wetf:TermLoanFacilityMember 2019-01-01 2019-06-30 0000880631 wetf:AcquisitionOfEtfsBusinessMember us-gaap:RevolvingCreditFacilityMember 2019-01-01 2019-06-30 0000880631 wetf:NonVotingConvertiblePreferredStockMember wetf:AcquisitionOfEtfsBusinessMember 2019-01-01 2019-06-30 0000880631 us-gaap:CommonStockMember 2019-01-01 2019-06-30 0000880631 us-gaap:IncomeApproachValuationTechniqueMember srt:WeightedAverageMember wetf:AdvisorEngineMember us-gaap:PreferredStockMember us-gaap:FairValueInputsLevel3Member 2019-01-01 2019-06-30 0000880631 us-gaap:ForeignCountryMember 2019-01-01 2019-06-30 0000880631 wetf:PerformanceBasedRestrictedStockUnitMember srt:MinimumMember 2019-01-01 2019-06-30 0000880631 wetf:PerformanceBasedRestrictedStockUnitMember srt:MaximumMember 2019-01-01 2019-06-30 0000880631 wetf:BelowTwentyFifthPercentileMember 2019-01-01 2019-06-30 0000880631 wetf:AboveTwentyFifthPercentileMember 2019-01-01 2019-06-30 0000880631 wetf:AtFiftyPercentileMember 2019-01-01 2019-06-30 0000880631 wetf:AthundredpercentileMember 2019-01-01 2019-06-30 0000880631 wetf:PerformanceBasedRestrictedStockUnitMember 2019-01-01 2019-06-30 0000880631 wetf:JapanOfficeMember 2019-01-01 2019-06-30 0000880631 wetf:UnsecuredConvertibleNoteReceivableMember 2019-01-01 2019-06-30 0000880631 wetf:FederalAgencyMember 2019-06-30 0000880631 us-gaap:NotesReceivableMember 2019-06-30 0000880631 wetf:WisdomtreeETFMember 2019-06-30 0000880631 us-gaap:ForeignCountryMember 2019-06-30 0000880631 wetf:ThesysGroupIncMember 2019-06-30 0000880631 wetf:AdvisorEngineMember us-gaap:ConvertiblePreferredStockMember 2019-06-30 0000880631 wetf:AdvisorEngineMember us-gaap:ConvertiblePreferredStockMember us-gaap:SeriesAPreferredStockMember 2019-06-30 0000880631 wetf:AdvisorEngineMember us-gaap:ConvertiblePreferredStockMember wetf:SeriesAOneConvertiblePreferredStockMember 2019-06-30 0000880631 wetf:EmployeesAndDirectorsMember 2019-06-30 0000880631 wetf:TradingSecuritiesMember 2019-06-30 0000880631 us-gaap:EquipmentMember 2019-06-30 0000880631 us-gaap:FurnitureAndFixturesMember 2019-06-30 0000880631 us-gaap:LeaseholdImprovementsMember 2019-06-30 0000880631 wetf:WisdomTreeTrustMember 2019-06-30 0000880631 wetf:ETFSIssuersMember 2019-06-30 0000880631 wetf:BoostIssuerPLCAndWisdomtreeIssuerplcMember 2019-06-30 0000880631 wetf:WisdomtreeAssetManagementCanadaIncMember 2019-06-30 0000880631 wetf:WisdomtreeCommodityServicesLlcMember 2019-06-30 0000880631 wetf:AdvisorEngineMember 2019-06-30 0000880631 wetf:ThreeYearShareRepurchaseProgramMember 2019-06-30 0000880631 us-gaap:SeriesAPreferredStockMember 2019-06-30 0000880631 wetf:AcquisitionOfEtfsBusinessMember 2019-06-30 0000880631 us-gaap:OtherNoncurrentLiabilitiesMember 2019-06-30 0000880631 us-gaap:FairValueInputsLevel2Member 2019-06-30 0000880631 wetf:ThroughMarchThirtyFirstTwoThousandFiftyEightMember 2019-06-30 0000880631 wetf:AprilOneTwoThousandFiftyEightAndThereafterMember 2019-06-30 0000880631 us-gaap:FairValueMeasurementsRecurringMember 2019-06-30 0000880631 us-gaap:FairValueMeasurementsRecurringMember us-gaap:FairValueInputsLevel1Member 2019-06-30 0000880631 us-gaap:FairValueMeasurementsRecurringMember us-gaap:FairValueInputsLevel3Member 2019-06-30 0000880631 wetf:TermLoanFacilityMember 2019-06-30 0000880631 us-gaap:RevolvingCreditFacilityMember 2019-06-30 0000880631 srt:MinimumMember 2019-06-30 0000880631 srt:MaximumMember 2019-06-30 0000880631 wetf:InternationalBusinessSegmentMember 2019-06-30 0000880631 us-gaap:MarketApproachValuationTechniqueMember srt:MinimumMember us-gaap:FairValueInputsLevel3Member us-gaap:PreferredStockMember wetf:AdvisorEngineMember 2019-06-30 0000880631 srt:MaximumMember us-gaap:MarketApproachValuationTechniqueMember us-gaap:FairValueInputsLevel3Member us-gaap:PreferredStockMember wetf:AdvisorEngineMember 2019-06-30 0000880631 us-gaap:MarketApproachValuationTechniqueMember us-gaap:FairValueInputsLevel3Member us-gaap:PreferredStockMember wetf:AdvisorEngineMember srt:WeightedAverageMember 2019-06-30 0000880631 wetf:UsOfficeMember 2019-06-30 0000880631 wetf:UnsecuredNonConvertibleNoteMember 2019-06-30 0000880631 wetf:UnsecuredConvertibleNoteMember 2019-06-30 0000880631 wetf:UnsecuredConvertibleNoteReceivableMember 2019-06-30 0000880631 wetf:FederalAgencyMember 2018-12-31 0000880631 us-gaap:NotesReceivableMember 2018-12-31 0000880631 wetf:WisdomtreeETFMember 2018-12-31 0000880631 wetf:TradingSecuritiesMember 2018-12-31 0000880631 us-gaap:EquipmentMember 2018-12-31 0000880631 us-gaap:FurnitureAndFixturesMember 2018-12-31 0000880631 us-gaap:LeaseholdImprovementsMember 2018-12-31 0000880631 wetf:AdvisorEngineMember us-gaap:ConvertiblePreferredStockMember 2018-12-31 0000880631 wetf:ThesysGroupIncMember 2018-12-31 0000880631 wetf:WisdomTreeTrustMember 2018-12-31 0000880631 wetf:ETFSIssuersMember 2018-12-31 0000880631 wetf:BoostIssuerPLCAndWisdomtreeIssuerplcMember 2018-12-31 0000880631 wetf:WisdomtreeAssetManagementCanadaIncMember 2018-12-31 0000880631 wetf:WisdomtreeCommodityServicesLlcMember 2018-12-31 0000880631 us-gaap:SeriesAPreferredStockMember 2018-12-31 0000880631 us-gaap:OtherNoncurrentLiabilitiesMember 2018-12-31 0000880631 us-gaap:FairValueInputsLevel2Member 2018-12-31 0000880631 us-gaap:FairValueMeasurementsRecurringMember 2018-12-31 0000880631 us-gaap:FairValueMeasurementsRecurringMember us-gaap:FairValueInputsLevel1Member 2018-12-31 0000880631 us-gaap:FairValueMeasurementsNonrecurringMember 2018-12-31 0000880631 us-gaap:FairValueMeasurementsNonrecurringMember us-gaap:FairValueInputsLevel3Member 2018-12-31 0000880631 us-gaap:FairValueMeasurementsRecurringMember us-gaap:FairValueInputsLevel3Member 2018-12-31 0000880631 wetf:TermLoanFacilityMember 2018-12-31 0000880631 us-gaap:RevolvingCreditFacilityMember 2018-12-31 0000880631 srt:MinimumMember 2018-12-31 0000880631 srt:MaximumMember 2018-12-31 0000880631 wetf:InternationalBusinessSegmentMember 2018-12-31 0000880631 wetf:UnsecuredNonConvertibleNoteMember 2018-12-31 0000880631 wetf:ThreeYearShareRepurchaseProgramMember 2019-04-01 2019-06-30 0000880631 wetf:WisdomTreeTrustMember wetf:AdvisoryServicesMember 2019-04-01 2019-06-30 0000880631 wetf:ETFSIssuersMember wetf:AdvisoryServicesMember 2019-04-01 2019-06-30 0000880631 wetf:BoostIssuerPLCAndWisdomtreeIssuerplcMember wetf:AdvisoryServicesMember 2019-04-01 2019-06-30 0000880631 wetf:WisdomtreeAssetManagementCanadaIncMember wetf:AdvisoryServicesMember 2019-04-01 2019-06-30 0000880631 wetf:WisdomtreeCommodityServicesLlcMember wetf:AdvisoryServicesMember 2019-04-01 2019-06-30 0000880631 wetf:AdvisoryServicesMember 2019-04-01 2019-06-30 0000880631 wetf:USBusinessSegmentMember 2019-04-01 2019-06-30 0000880631 wetf:InternationalBusinessSegmentMember 2019-04-01 2019-06-30 0000880631 wetf:USBusinessSegmentMember us-gaap:InvestmentAdvisoryManagementAndAdministrativeServiceMember 2019-04-01 2019-06-30 0000880631 wetf:InternationalBusinessSegmentMember us-gaap:InvestmentAdvisoryManagementAndAdministrativeServiceMember 2019-04-01 2019-06-30 0000880631 us-gaap:CommonStockMember 2019-04-01 2019-06-30 0000880631 us-gaap:AdditionalPaidInCapitalMember 2019-04-01 2019-06-30 0000880631 us-gaap:InvestmentAdvisoryManagementAndAdministrativeServiceMember 2019-04-01 2019-06-30 0000880631 wetf:OtherServicesIncomeMember 2019-04-01 2019-06-30 0000880631 us-gaap:AccumulatedOtherComprehensiveIncomeMember 2019-04-01 2019-06-30 0000880631 wetf:WisdomTreeJapanMember 2019-04-01 2019-06-30 0000880631 wetf:InterestAndPenaltiesMember 2019-04-01 2019-06-30 0000880631 us-gaap:RetainedEarningsMember 2019-04-01 2019-06-30 0000880631 wetf:DeferredConsiderationObligationMember 2019-04-01 2019-06-30 0000880631 wetf:UnrecognizedTaxBenefitsMember 2019-04-01 2019-06-30 0000880631 wetf:OptionsMember 2019-04-01 2019-06-30 0000880631 us-gaap:RestrictedStockMember 2019-04-01 2019-06-30 0000880631 us-gaap:RestrictedStockUnitsRSUMember 2019-04-01 2019-06-30 0000880631 wetf:PerformancebasedRestrictedStockUnitsMember 2019-04-01 2019-06-30 0000880631 wetf:ThreeYearShareRepurchaseProgramMember 2018-04-01 2018-06-30 0000880631 wetf:WisdomTreeTrustMember wetf:AdvisoryServicesMember 2018-04-01 2018-06-30 0000880631 wetf:BoostIssuerPLCAndWisdomtreeIssuerplcMember wetf:AdvisoryServicesMember 2018-04-01 2018-06-30 0000880631 wetf:WisdomtreeAssetManagementCanadaIncMember wetf:AdvisoryServicesMember 2018-04-01 2018-06-30 0000880631 wetf:WisdomtreeCommodityServicesLlcMember wetf:AdvisoryServicesMember 2018-04-01 2018-06-30 0000880631 wetf:AdvisoryServicesMember 2018-04-01 2018-06-30 0000880631 wetf:AdvisoryServicesMember wetf:ETFSIssuersMember 2018-04-01 2018-06-30 0000880631 wetf:USBusinessSegmentMember 2018-04-01 2018-06-30 0000880631 wetf:InternationalBusinessSegmentMember 2018-04-01 2018-06-30 0000880631 us-gaap:CommonStockMember 2018-04-01 2018-06-30 0000880631 us-gaap:AdditionalPaidInCapitalMember 2018-04-01 2018-06-30 0000880631 wetf:USBusinessSegmentMember us-gaap:InvestmentAdvisoryManagementAndAdministrativeServiceMember 2018-04-01 2018-06-30 0000880631 wetf:InternationalBusinessSegmentMember us-gaap:InvestmentAdvisoryManagementAndAdministrativeServiceMember 2018-04-01 2018-06-30 0000880631 us-gaap:InvestmentAdvisoryManagementAndAdministrativeServiceMember 2018-04-01 2018-06-30 0000880631 wetf:OtherServicesIncomeMember 2018-04-01 2018-06-30 0000880631 us-gaap:AccumulatedOtherComprehensiveIncomeMember 2018-04-01 2018-06-30 0000880631 wetf:WisdomTreeJapanMember 2018-04-01 2018-06-30 0000880631 wetf:AcquisitionOfEtfsBusinessMember 2018-04-01 2018-06-30 0000880631 us-gaap:RetainedEarningsMember 2018-04-01 2018-06-30 0000880631 wetf:DeferredConsiderationObligationMember 2018-04-01 2018-06-30 0000880631 wetf:ThreeYearShareRepurchaseProgramMember 2018-01-01 2018-06-30 0000880631 wetf:WisdomTreeTrustMember wetf:AdvisoryServicesMember 2018-01-01 2018-06-30 0000880631 wetf:BoostIssuerPLCAndWisdomtreeIssuerplcMember wetf:AdvisoryServicesMember 2018-01-01 2018-06-30 0000880631 wetf:WisdomtreeAssetManagementCanadaIncMember wetf:AdvisoryServicesMember 2018-01-01 2018-06-30 0000880631 wetf:WisdomtreeCommodityServicesLlcMember wetf:AdvisoryServicesMember 2018-01-01 2018-06-30 0000880631 wetf:AdvisoryServicesMember 2018-01-01 2018-06-30 0000880631 wetf:AdvisoryServicesMember wetf:ETFSIssuersMember 2018-01-01 2018-06-30 0000880631 wetf:USBusinessSegmentMember 2018-01-01 2018-06-30 0000880631 wetf:InternationalBusinessSegmentMember 2018-01-01 2018-06-30 0000880631 us-gaap:CommonStockMember 2018-01-01 2018-06-30 0000880631 us-gaap:AdditionalPaidInCapitalMember 2018-01-01 2018-06-30 0000880631 wetf:USBusinessSegmentMember us-gaap:InvestmentAdvisoryManagementAndAdministrativeServiceMember 2018-01-01 2018-06-30 0000880631 wetf:InternationalBusinessSegmentMember us-gaap:InvestmentAdvisoryManagementAndAdministrativeServiceMember 2018-01-01 2018-06-30 0000880631 us-gaap:InvestmentAdvisoryManagementAndAdministrativeServiceMember 2018-01-01 2018-06-30 0000880631 wetf:OtherServicesIncomeMember 2018-01-01 2018-06-30 0000880631 us-gaap:AccumulatedOtherComprehensiveIncomeMember 2018-01-01 2018-06-30 0000880631 wetf:WisdomTreeJapanMember 2018-01-01 2018-06-30 0000880631 wetf:AcquisitionOfEtfsBusinessMember 2018-01-01 2018-06-30 0000880631 us-gaap:RetainedEarningsMember 2018-01-01 2018-06-30 0000880631 wetf:DeferredConsiderationObligationMember 2018-01-01 2018-06-30 0000880631 wetf:UnrecognizedTaxBenefitsMember 2019-01-01 2019-03-31 0000880631 wetf:InterestAndPenaltiesMember 2019-01-01 2019-03-31 0000880631 wetf:AcquisitionOfEtfsBusinessMember 2018-04-01 2018-04-11 0000880631 wetf:AcquisitionOfEtfsBusinessMember us-gaap:CommonStockMember 2018-04-01 2018-04-11 0000880631 wetf:AcquisitionOfEtfsBusinessMember wetf:NonVotingConvertiblePreferredStockMember 2018-04-01 2018-04-11 0000880631 wetf:AcquisitionOfEtfsBusinessMember us-gaap:CommonStockMember 2018-04-01 2018-04-11 0000880631 wetf:AcquisitionOfEtfsBusinessMember us-gaap:PreferredStockMember 2018-04-01 2018-04-11 0000880631 wetf:AcquisitionOfEtfsBusinessMember srt:MinimumMember 2018-04-01 2018-04-11 0000880631 wetf:AcquisitionOfEtfsBusinessMember srt:MaximumMember 2018-04-01 2018-04-11 0000880631 wetf:FiscalQuarterEndingTwoMember 2018-04-01 2018-04-11 0000880631 wetf:FiscalQuarterEndingThreeMember 2018-04-01 2018-04-11 0000880631 wetf:FiscalQuarterEndingFourMember 2018-04-01 2018-04-11 0000880631 wetf:FiscalQuarterEndingFiveMember 2018-04-01 2018-04-11 0000880631 wetf:FiscalQuarterEndingSixMember 2018-04-01 2018-04-11 0000880631 wetf:FiscalQuarterEndingSevenMember 2018-04-01 2018-04-11 0000880631 wetf:AcquisitionOfEtfsBusinessMember wetf:TermLoanFacilityMember 2018-04-01 2018-04-11 0000880631 wetf:AcquisitionOfEtfsBusinessMember wetf:TermLoanFacilityMember srt:MaximumMember us-gaap:LondonInterbankOfferedRateLIBORMember 2018-04-01 2018-04-11 0000880631 wetf:AcquisitionOfEtfsBusinessMember wetf:TermLoanFacilityMember us-gaap:LondonInterbankOfferedRateLIBORMember 2018-04-01 2018-04-11 0000880631 wetf:AcquisitionOfEtfsBusinessMember us-gaap:RevolvingCreditFacilityMember srt:MaximumMember us-gaap:LondonInterbankOfferedRateLIBORMember 2018-04-01 2018-04-11 0000880631 wetf:AcquisitionOfEtfsBusinessMember us-gaap:RevolvingCreditFacilityMember us-gaap:LondonInterbankOfferedRateLIBORMember 2018-04-01 2018-04-11 0000880631 wetf:AcquisitionOfEtfsBusinessMember us-gaap:RevolvingCreditFacilityMember 2018-04-01 2018-04-11 0000880631 wetf:AcquisitionOfEtfsBusinessMember 2018-04-11 0000880631 wetf:AcquisitionOfEtfsBusinessMember wetf:TermLoanFacilityMember 2018-04-11 0000880631 wetf:AcquisitionOfEtfsBusinessMember us-gaap:RevolvingCreditFacilityMember 2018-04-11 0000880631 wetf:AcquisitionOfEtfsBusinessMember us-gaap:CommonStockMember 2018-04-11 0000880631 wetf:AcquisitionOfEtfsBusinessMember wetf:AllocationOfConsiderationMember 2018-04-11 0000880631 wetf:ThesysGroupIncMember us-gaap:ConvertiblePreferredStockMember wetf:SeriesYPreferredStockMember 2017-06-20 0000880631 wetf:ThesysGroupIncMember us-gaap:WarrantMember wetf:SeriesYPreferredStockMember 2017-06-20 0000880631 wetf:ThesysGroupIncMember us-gaap:WarrantMember wetf:SeriesYPreferredStockMember 2017-06-01 2017-06-20 0000880631 us-gaap:ScenarioForecastMember 2024-08-21 2024-08-21 0000880631 us-gaap:NotesReceivableMember 2018-01-01 2018-12-31 0000880631 us-gaap:ConvertibleDebtSecuritiesMember 2019-04-11 0000880631 us-gaap:ConvertibleDebtSecuritiesMember 2019-04-02 2019-04-30 0000880631 wetf:ThreeYearShareRepurchaseProgramMember 2019-04-01 2019-04-24 0000880631 wetf:QuestradeETFsMember wetf:WisdomtreeAssetManagementCanadaIncMember 2017-10-01 2017-12-31 0000880631 us-gaap:ConvertibleDebtSecuritiesMember wetf:QualifiedFinancingMember 2019-04-01 2019-04-11 0000880631 us-gaap:ConvertibleDebtSecuritiesMember wetf:CorporateTransactionMember 2019-04-01 2019-04-11 0000880631 us-gaap:ConvertibleDebtSecuritiesMember wetf:NonQualifiedNonCorporateMember 2019-04-01 2019-04-11 0000880631 wetf:EuropeanBusinessSegmentMember us-gaap:ReportableSubsegmentsMember 2018-12-31 0000880631 wetf:USBusinessSegmentMember us-gaap:ReportableSubsegmentsMember 2018-12-31 0000880631 us-gaap:ReportableSubsegmentsMember 2018-12-31 0000880631 wetf:AcquisitionOfEtfsBusinessMember 2018-12-31 0000880631 wetf:QuestradeETFsMember 2018-12-31 0000880631 wetf:EuropeanBusinessSegmentMember us-gaap:ReportableSubsegmentsMember 2019-06-30 0000880631 wetf:USBusinessSegmentMember us-gaap:ReportableSubsegmentsMember 2019-06-30 0000880631 us-gaap:ReportableSubsegmentsMember 2019-06-30 0000880631 us-gaap:CommonStockMember 2018-12-31 0000880631 us-gaap:AdditionalPaidInCapitalMember 2018-12-31 0000880631 us-gaap:AccumulatedOtherComprehensiveIncomeMember 2018-12-31 0000880631 us-gaap:RetainedEarningsMember 2018-12-31 0000880631 wetf:QuestradeETFsMember 2019-06-30 0000880631 wetf:DeferredConsiderationObligationMember 2018-12-31 0000880631 wetf:DeferredConsiderationObligationMember 2019-06-30 0000880631 us-gaap:CommonStockMember 2019-06-30 0000880631 us-gaap:AdditionalPaidInCapitalMember 2019-06-30 0000880631 us-gaap:AccumulatedOtherComprehensiveIncomeMember 2019-06-30 0000880631 us-gaap:RetainedEarningsMember 2019-06-30 0000880631 us-gaap:CommonStockMember 2019-03-31 0000880631 us-gaap:AdditionalPaidInCapitalMember 2019-03-31 0000880631 us-gaap:AccumulatedOtherComprehensiveIncomeMember 2019-03-31 0000880631 us-gaap:RetainedEarningsMember 2019-03-31 0000880631 wetf:DeferredConsiderationObligationMember 2019-03-31 0000880631 wetf:UnrecognizedTaxBenefitsMember 2019-06-30 0000880631 wetf:InterestAndPenaltiesMember 2019-06-30 0000880631 wetf:OptionsMember 2019-03-31 0000880631 wetf:OptionsMember 2019-06-30 0000880631 us-gaap:RestrictedStockMember 2019-03-31 0000880631 us-gaap:RestrictedStockUnitsRSUMember 2019-03-31 0000880631 wetf:PerformancebasedRestrictedStockUnitsMember 2019-03-31 0000880631 us-gaap:RestrictedStockMember 2019-06-30 0000880631 us-gaap:RestrictedStockUnitsRSUMember 2019-06-30 0000880631 wetf:PerformancebasedRestrictedStockUnitsMember 2019-06-30 0000880631 us-gaap:CommonStockMember 2018-03-31 0000880631 us-gaap:AdditionalPaidInCapitalMember 2018-03-31 0000880631 us-gaap:AccumulatedOtherComprehensiveIncomeMember 2018-03-31 0000880631 us-gaap:RetainedEarningsMember 2018-03-31 0000880631 wetf:DeferredConsiderationObligationMember 2018-03-31 0000880631 wetf:DeferredConsiderationObligationMember 2018-06-30 0000880631 us-gaap:CommonStockMember 2018-06-30 0000880631 us-gaap:AdditionalPaidInCapitalMember 2018-06-30 0000880631 us-gaap:AccumulatedOtherComprehensiveIncomeMember 2018-06-30 0000880631 us-gaap:RetainedEarningsMember 2018-06-30 0000880631 us-gaap:CommonStockMember 2017-12-31 0000880631 us-gaap:AdditionalPaidInCapitalMember 2017-12-31 0000880631 us-gaap:AccumulatedOtherComprehensiveIncomeMember 2017-12-31 0000880631 us-gaap:RetainedEarningsMember 2017-12-31 0000880631 wetf:DeferredConsiderationObligationMember 2017-12-31 0000880631 wetf:UnrecognizedTaxBenefitsMember 2018-12-31 0000880631 wetf:InterestAndPenaltiesMember 2018-12-31 0000880631 wetf:UnrecognizedTaxBenefitsMember 2019-03-31 0000880631 wetf:InterestAndPenaltiesMember 2019-03-31 iso4217:USD xbrli:shares xbrli:pure wetf:Securities iso4217:USD xbrli:shares wetf:Fund utr:oz
Table of Contents


UNITED STATES
SECURITIES AND EXCHANGE COMMISSION
Washington, D.C. 20549
 
Form
10-Q
 
(Mark One)
QUARTERLY REPORT PURSUANT TO SECTION 13 OR 15(d) OF THE SECURITIES EXCHANGE ACT OF 1934


For the quarterly period ended June 30, 2019
or
TRANSITION REPORT PURSUANT TO SECTION 13 OR 15(d) OF THE SECURITIES EXCHANGE ACT OF 1934


For the transition period from


to


.
Commission File Number
001-10932
 
WisdomTree Investments, Inc.
(Exact name of registrant as specified in its charter)
 
     
Delaware
 
13-3487784
(State or other jurisdiction of
incorporation or organization)
 
(IRS Employer
Identification No.)
     
245 Park Avenue, 35
th
Floor
New York, New York
 
10167
(Address of principal executive offices)
 
(Zip Code)


212-801-2080
(Registrant’s telephone number, including area code)


Securities registered pursuant to Section 12(b) of the Exchange Act:
         
Title of each class
 
Trading 
Symbol(s)
 
Name of each exchange 
on which registered
Common Stock, $0.01 par value
 
WETF
 
The NASDAQ Stock Market LLC


Indicate by check mark whether the registrant (1) has filed all reports required to be filed by Section 13 or 15(d) of the Securities Exchange Act of 1934, as amended (the “Exchange Act”) during the preceding 12 months (or for such shorter period that the registrant was required to file such reports), and (2) has been subject to such filing requirements for the past 90 days.    Yes  
    No  
Indicate by check mark whether the registrant has submitted electronically every Interactive Data File required to be submitted pursuant to Rule 405 of Regulation
S-T
(§232.405 of this chapter) during the preceding 12 months (or for such shorter period that the registrant was required to submit such files).    ☒  Yes
  
    No  ☐
Indicate by check mark whether the registrant is a large accelerated filer, an accelerated filer, a
non-accelerated
filer, a smaller reporting company, or emerging growth company. See definitions of “large accelerated filer,” “accelerated filer,” “smaller reporting company” and “emerging growth company” in Rule
12b-2
of the Exchange Act.
             
Large accelerated filer
 
 
Accelerated filer
 
             
Non-accelerated
filer
 
 
Smaller reporting company


Emerging growth company


If an emerging growth company, indicate by check mark if the registrant has elected not to use the extended transition period for complying with any new or revised financial accounting standards provided pursuant to Section 13(a) of the Exchange Act  
Indicate by check mark whether the registrant is a shell company (as defined in Rule
12b-2
of the Exchange Act).    Yes  
    No  
As of
July 25
, 2019, there were
155,099,477
shares of the registrant’s Common Stock, $0.01 par value per share, outstanding.


Table of Contents
 
WISDOMTREE INVESTMENTS, INC.
Form 10-Q
For the Quarterly Period Ended June 30, 2019
TABLE OF CONTENTS
         
 
Page
Number
 
   
4


4


36


56


57


57


57


57


57


58


58


58


59


Unless otherwise indicated, references to “the Company,” “we,” “us,” “our” and “WisdomTree” mean WisdomTree Investments, Inc. and its subsidiaries.
WisdomTree
®
and Modern Alpha
TM
are trademarks of WisdomTree Investments, Inc. in the United States and in other countries. All other trademarks are the property of their respective owners.
 
2
 
 
Table of Contents
 
CAUTIONARY NOTE REGARDING FORWARD-LOOKING STATEMENTS
This Quarterly Report on Form 10-Q contains forward-looking statements that are based on our management’s beliefs and assumptions and on information currently available to our management. Although we believe that the expectations reflected in these forward-looking statements are reasonable, these statements relate to future events or our future financial performance, and involve known and unknown risks, uncertainties and other factors that may cause our actual results, levels of activity, performance or achievements to be materially different from any future results, levels of activity, performance or achievements expressed or implied by these forward-looking statements.
In some cases, you can identify forward-looking statements by terminology such as “may,” “will,” “should,” “expects,” “intends,” “plans,” “anticipates,” “believes,” “estimates,” “predicts,” “potential,” “continue” or the negative of these terms or other comparable terminology. These statements are only predictions. You should not place undue reliance on forward-looking statements because they involve known and unknown risks, uncertainties and other factors, which are, in some cases, beyond our control and which could materially affect our results. Factors that may cause actual results to differ materially from current expectations include, among other things, those listed in the section entitled “Risk Factors” included in our Annual Report on Form 10-K for the fiscal year ended December 31, 2018. If one or more of these or other risks or uncertainties occur, or if our underlying assumptions prove to be incorrect, actual events or results may vary significantly from those implied or projected by the forward-looking statements. No forward-looking statement is a guarantee of future performance. You should read this Report and the documents that we reference in this Report and have filed with the Securities and Exchange Commission, or the SEC, as exhibits to this Report, completely and with the understanding that our actual future results may be materially different from any future results expressed or implied by these forward-looking statements.
In particular, forward-looking statements in this Report may include statements about:
  anticipated trends, conditions and investor sentiment in the global markets and exchange traded products, or ETPs;


  anticipated levels of inflows into and outflows out of our ETPs;


  our ability to deliver favorable rates of return to investors;


  competition in our business;


  our ability to develop new products and services;


  our ability to maintain current vendors or find new vendors to provide services to us at favorable costs;


  our ability to successfully operate and expand our business in non-U.S. markets; and


  the effect of laws and regulations that apply to our business.


The forward-looking statements in this Report represent our views as of the date of this Report. We anticipate that subsequent events and developments may cause our views to change. However, while we may elect to update these forward-looking statements at some point in the future, we have no current intention of doing so except to the extent required by applicable law. Therefore, these forward-looking statements do not represent our views as of any date other than the date of this Report.
 
3


Table of Contents
 
PART I: FINANCIAL INFORMATION
ITEM 1.
FINANCIAL STATEMENTS


WisdomTree Investments, Inc. and Subsidiaries
Consolidated Balance Sheets
(In Thousands, Except Per Share Amounts)
                 
 
June 30,
2019
   
December 31,
2018
 
 
(Unaudited)
   
 
Assets


Current assets:


Cash and cash equivalents
  $
79,611
    $
77,784
 
Securities owned, at fair value
   
9,095
     
8,873
 
Accounts receivable
   
24,442
     
25,834
 
Income taxes receivable
   
1,235
     
1,181
 
Prepaid expenses
   
6,192
     
4,441
 
Other current assets
   
1,017
     
163
 
                 
Total current assets
   
121,592
     
118,276
 
Fixed assets, net
   
8,604
     
9,122
 
Notes receivable, net (Note 8)
   
31,485
     
28,722
 
Indemnification receivable (Note 21)
   
30,877
     
34,876
 
Securities held-to-maturity
   
20,136
     
20,180
 
Deferred tax assets, net
   
4,599
     
7,042
 
Investments, carried at cost (Note 9)
   
28,080
     
28,080
 
Right of use assets – operating leases (Note 14)
   
18,997
     
—  
 
Goodwill (Note 23)
   
85,856
     
85,856
 
Intangible assets (Note 23)
   
603,291
     
603,209
 
Other noncurrent assets
   
1,258
     
2,155
 
                 
Total assets
  $
954,775
    $
937,518
 
                 
Liabilities and stockholders’ equity


Liabilities


Current liabilities:


Fund management and administration payable
  $
23,753
    $
22,508
 
Compensation and benefits payable
   
14,619
     
18,453
 
Deferred consideration – gold payments (Note 11)
   
12,857
     
11,765
 
Securities sold, but not yet purchased, at fair value
   
543
     
1,698
 
Operating lease liabilities (Note 14)
   
3,632
     
—  
 
Accounts payable and other liabilities
   
7,738
     
8,377
 
                 
Total current liabilities
   
63,142
     
62,801
 
Long-term debt (Note 12)
   
195,762
     
194,592
 
Deferred consideration – gold payments (Note 11)
   
148,416
     
149,775
 
Operating lease liabilities (Note 14)
   
20,190
     
—  
 
Deferred rent payable
   
—  
     
4,570
 
Other noncurrent liabilities (Note 21)
   
30,877
     
34,876
 
                 
Total liabilities
   
458,387
     
446,614
 
                 
Preferred stock – Series A Non-Voting Convertible, par value $0.01; 14.750 shares authorized, issued and outstanding (Note 13)
   
132,569
     
132,569
 
                 
Contingencies (Note
15
)


Stockholders’ equity


Preferred stock, par value $0.01; 2,000 shares authorized:
   
—  
     
—  
 
Common stock, par value $0.01; 250,000 shares authorized; issued and outstanding: 155,108 and 153,202 at June 30, 2019 and December 31, 2018, respectively
   
1,551
     
1,532
 
Additional
paid-in
capital
   
367,750
     
363,655
 
Accumulated other comprehensive income
   
725
     
467
 
Accumulated deficit
   
(6,207
)    
(7,319
)
                 
Total stockholders’ equity
   
363,819
     
358,335
 
                 
Total liabilities and stockholders’ equity
  $
954,775
    $
937,518


The accompanying notes are an integral part of these consolidated financial statements
4


Table of Contents
 
WisdomTree Investments, Inc. and Subsidiaries
Consolidated Statements of Operations
(In Thousands, Except Per Share Amounts)
(Unaudited)
                                 
 
Three Months Ended June 30,
   
Six Months Ended June 30,
 
 
2019
   
2018
   
2019
   
2018
 
Operating Revenues:


Advisory fees
  $
65,627
    $
73,778
    $
130,467
    $
132,234
 
Other income
   
666
     
997
     
1,311
     
1,445
 
                                 
Total revenues
   
66,293
     
74,775
     
131,778
     
133,679
 
                                 
Operating Expenses:


Compensation and benefits
   
21,300
     
19,301
     
42,601
     
38,133
 
Fund management and administration
   
15,576
     
14,621
     
30,742
     
25,533
 
Marketing and advertising
   
2,910
     
3,778
     
5,590
     
6,973
 
Sales and business development
   
4,171
     
4,503
     
8,593
     
8,316
 
Contractual gold payments (Note 11)
   
3,110
     
2,715
     
6,208
     
2,715
 
Professional and consulting fees
   
1,296
     
1,560
     
2,778
     
3,196
 
Occupancy, communications and equipment
   
1,548
     
1,574
     
3,166
     
2,937
 
Depreciation and amortization
   
264
     
337
     
533
     
692
 
Third-party distribution fees
   
1,919
     
1,666
     
4,319
     
3,391
 
Acquisition-related costs (Note 3)
   
33
     
7,928
     
346
     
9,990
 
Other
   
2,255
     
2,261
     
4,308
     
4,051
 
                                 
Total expenses
   
54,382
     
60,244
     
109,184
     
105,927
 
                                 
Operating income
   
11,911
     
14,531
     
22,594
     
27,752
 
Other Income/(Expenses):


Interest expense
   
(2,910
)    
(2,356
)    
(5,802
)    
(2,356
)
(Loss)/gain on revaluation of deferred consideration – gold payments (Note 11)
   
(4,037
)    
9,898
     
367
     
9,898
 
Interest income
   
818
     
612
     
1,597
     
1,574
 
Impairment (Note 14)
   
—  
     
—  
     
(572
)    
—  
 
Other gains and losses, net
   
284
     
(501
)    
(4,343
)    
(762
)
                                 
Income before income taxes
   
6,066
     
22,184
     
13,841
     
36,106
 
Income tax expense
   
3,587
     
5,460
     
2,538
     
9,958
 
                                 
Net income
  $
2,479
    $
16,724
    $
11,303
    $
26,148
 
                                 
Earnings per share—basic
  $
0.01
    $
0.10
    $
0.07
    $
0.17
 
                                 
Earnings per share—diluted
  $
0.01
    $
0.10
    $
0.07
    $
0.17
 
                                 
Weighted-average common shares—basic
   
151,818
     
149,056
     
151,722
     
142,230
 
                                 
Weighted-average common shares—diluted
   
167,249
     
163,346
     
166,855
     
149,979
 
                                 
Cash dividends declared per common share
  $
0.03
    $
0.03
    $
0.06
    $
0.06


The accompanying notes are an integral part of these consolidated financial statements
5
 
 
Table of Contents
 
WisdomTree Investments, Inc. and Subsidiaries
Consolidated Statements of Comprehensive Income
(In Thousands)
(Unaudited)
                                 
 
Three Months Ended June 30,
   
Six Months Ended June 30,
 
 
2019
   
2018
   
2019
   
2018
 
Net income
  $
2,479
    $
16,724
    $
11,303
    $
26,148
 
Other comprehensive (loss)/income


Change in unrealized gains on available-for-sale debt securities, net of tax
   
—  
     
17
     
—  
     
477
 
Foreign currency translation adjustment
   
(33
)    
(719
)    
258
     
(307
)
                                 
Other comprehensive (loss)/income
   
(33
)    
(702
)    
258
     
170
 
                                 
Comprehensive income
  $
2,446
    $
16,022
    $
11,561
    $
26,318


The accompanying notes are an integral part of these consolidated financial statements
6
 
 
Table of Contents
 
WisdomTree Investments, Inc. and Subsidiaries
Consolidated Statements of Changes in Stockholders’ Equity
(In Thousands)
(Unaudited)


For the Three Months Ended June 30, 2019
 
 
Common Stock


Accumulated
   
Accumulated
Deficit
   
Total
   
 
Shares
Issued
   
Par
Value
   
Additional
Paid-In

Capital
   
Other
Comprehensive
Income
   
Balance—April 1, 2019
   
155,056
    $
1,551
    $
364,717
    $
758
    $
(3,592
)   $
363,434
 
Restricted stock issued and vesting of restricted stock units, net
   
66
     
—  
     
—  
     
—  
     
—  
     
—  
 
Shares repurchased
   
(14
)    
—  
     
(102
)    
—  
     
—  
     
(102
)
Stock-based compensation
   
—  
     
—  
     
3,135
     
—  
     
—  
     
3,135
 
Other comprehensive loss
   
—  
     
—  
     
—  
     
(33
)    
—  
     
(33
)
Dividends
   
—  
     
—  
     
—  
     
—  
     
(5,094
)    
(5,094
)
Net income
   
—  
     
—  
     
—  
     
—  
     
2,479
     
2,479
 
                                                 
Balance—June 30, 2019
   
155,108
    $
1,551
    $
367,750
    $
725
    $
(6,207
)   $
363,819


For the Three Months Ended June 30, 2018
 
 
Common Stock


Accumulated
   
Accumulated
Deficit
   
Total
   
 
Shares
Issued
   
Par
Value
   
Additional
Paid-In

Capital
   
Other
Comprehensive
Income
   
Balance—April 1, 2018
   
137,751
    $
1,378
    $
218,488
    $
1,163
    $
(19,424
)   $
201,605
 
Common stock issued (Note 3)
   
15,250
     
153
     
137,097
     
—  
     
—  
     
137,250
 
Restricted stock issued and vesting of restricted stock units, net
   
158
     
—  
     
—  
     
—  
     
—  
     
—  
 
Shares repurchased
   
(27
)    
—  
     
(272
)    
—  
     
—  
     
(272
)
Exercise of stock options, net
   
10
     
—  
     
85
     
—  
     
—  
     
85
 
Stock-based compensation
   
—  
     
—  
     
3,529
     
—  
     
—  
     
3,529
 
Reclassification of stock issuance costs to temporary equity
   
—  
     
—  
     
139
     
—  
     
—  
     
139
 
Other comprehensive loss
   
—  
     
—  
     
—  
     
(702
)    
—  
     
(702
)
Dividends
   
—  
     
—  
     
—  
     
—  
     
(5,035
)    
(5,035
)
Net income
   
—  
     
—  
     
—  
     
—  
     
16,724
     
16,724
 
                                                 
Balance—June 30, 2018
   
153,142
    $
1,531
    $
359,066
    $
461
    $
(7,735
)   $
353,323


The accompanying notes are an integral part of these consolidated financial statements
7
 
 
Table of Contents
 
WisdomTree Investments, Inc. and Subsidiaries
Consolidated Statements of Changes in Stockholders’ Equity (Continued)
(In Thousands)
(Unaudited)


For the Six Months Ended June 30, 2019
 
 
Common Stock
   
Additional
   
Accumulated
Other
   
Accumulated
Deficit
   
Total
   
 
Shares
Issued
   
Par
Value
   
Paid-In

Capital
   
Comprehensive
Income
   
Balance—January 1, 2019
   
153,202
    $
1,532
    $
363,655
    $
467
    $
(7,319
)   $
358,335
 
Restricted stock issued and vesting of restricted stock units, net
   
2,211
     
21
     
(21
)    
—  
     
—  
     
—  
 
Shares repurchased
   
(325
)    
(2
)    
(2,105
)    
—  
     
—  
     
(2,107
)
Exercise of stock options, net
   
20
     
—  
     
14
     
—  
     
—  
     
14
 
Stock-based compensation
   
—  
     
—  
     
6,207
     
—  
     
—  
     
6,207
 
Other comprehensive income
   
—  
     
—  
     
—  
     
258
     
—  
     
258
 
Dividends
   
—  
     
—  
     
—  
     
—  
     
(10,191
)    
(10,191
)
Net income
   
—  
     
—  
     
—  
     
—  
     
11,303
     
11,303
 
                                                 
Balance—June 30, 2019
   
155,108
    $
1,551
    $
367,750
    $
725
    $
(6,207
)   $
363,819


For the Six Months Ended June 30, 2018
 
 
Common Stock
   
Additional
   
Accumulated
Other
   
Accumulated
Deficit
   
Total
   
 
Shares
Issued
   
Par
Value
   
Paid-In

Capital
   
Comprehensive
Income
   
Balance—January 1, 2018
   
136,996
    $
1,370
    $
216,006
    $
291
    $
(24,716
)   $
192,951
 
Common stock issued (Note 3)
   
15,250
     
153
     
137,097
     
—  
     
—  
     
137,250
 
Restricted stock issued and vesting of restricted stock units, net
   
825
     
7
     
(7
)    
—  
     
—  
     
—  
 
Shares repurchased
   
(87
)    
—  
     
(1,006
)    
—  
     
—  
     
(1,006
)
Exercise of stock options, net
   
158
     
1
     
138
     
—  
     
—  
     
139
 
Stock-based compensation
   
—  
     
—  
     
6,838
     
—  
     
—  
     
6,838
 
Other comprehensive income
   
—  
     
—  
     
—  
     
170
     
—  
     
170
 
Dividends
   
—  
     
—  
     
—  
     
—  
     
(9,167
)    
(9,167
)
Net income
   
—  
     
—  
     
—  
     
—  
     
26,148
     
26,148
 
                                                 
Balance—June 30, 2018
   
153,142
    $
1,531
    $
359,066
    $
461
    $
(7,735
)   $
353,323


The accompanying notes are an integral part of these consolidated financial statements
8
 
 
Table of Contents
 
WisdomTree Investments, Inc. and Subsidiaries
Consolidated Statements of Cash Flows
(In Thousands)
(Unaudited)


Six Months Ended June 30,
 
 
2019
   
2018
 
Cash flows from operating activities:


Net income
  $
11,303
    $
26,148
 
Adjustments to reconcile net income to net cash provided by operating activities:


Advisory fees received in gold and other precious metals
   
(22,872
)    
(11,033
)
Contractual gold payments
   
6,208
     
2,715
 
Stock-based compensation
   
6,207
     
6,838
 
Deferred income taxes
   
2,443
     
(1,055
)
Amortization of right of use asset
   
1,590
     
—  
 
Amortization of credit facility issuance costs
   
1,430
     
637
 
Paid-in-kind
interest income (Note 8)
   
(1,223
)    
(840
)
Impairment
   
572
     
—  
 
Depreciation and amortization
   
533
     
692
 
Gain on revaluation of deferred consideration – gold payments
   
(367
)    
(9,898
)
Other
   
5
     
834
 
Changes in operating assets and liabilities:


Securities owned, at fair value
   
(222
)    
(2,028
)
Accounts receivable
   
1,833
     
2,871
 
Income taxes receivable/payable
   
(44
)    
8,109
 
Prepaid expenses
   
(1,746
)    
(1,669
)
Gold and other precious metals
   
16,318
     
8,930
 
Other assets
   
(552
)    
975
 
Fund management and administration payable
   
1,231
     
(380
)
Compensation and benefits payable
   
(3,938
)    
(21,170
)
Securities sold, but not yet purchased, at fair value
   
(1,155
)    
1,077
 
Payable to ETFS Capital Limited
   
—  
     
222
 
Operating lease liabilities
   
(1,760
)    
—  
 
Accounts payable and other liabilities
   
(435
)    
(2,961
)
                 
Net cash provided by operating activities
   
15,359
     
9,014
 
                 
Cash flows from investing activities:


Purchase of fixed assets
   
(15
)    
(34
)
Funding of AdvisorEngine notes receivable (Note 8)
   
(1,540
)    
(5,000
)
Proceeds from
held-to-maturity
securities maturing or called prior to maturity
   
39
     
1,063
 
Proceeds from sales and maturities of debt securities
available-for-sale
   
—  
     
64,498
 
Cash paid – ETFS Acquisition, net of cash acquired (Note 3)
   
—  
     
(233,172
)
                 
Net cash used in investing activities
   
(1,516
)    
(172,645
)
                 
Cash flows from financing activities:


Dividends paid
   
(10,191
)    
(9,167
)
Shares repurchased
   
(2,107
)    
(1,006
)
Credit facility issuance costs
   
—  
     
(8,690
)
Preferred stock issuance costs
   
—  
     
(181
)
Proceeds from the issuance of long-term debt (Note 12)
   
—  
     
200,000
 
Proceeds from exercise of stock options
   
14
     
139
 
                 
Net cash (used in)/provided by financing activities
   
(12,284
)    
181,095
 
                 
Increase/(decrease) in cash flow due to changes in foreign exchange rate
   
268
     
(913
)
                 
Net increase in cash and cash equivalents
   
1,827
     
16,551
 
Cash and cash equivalents—beginning of period
   
77,784
     
54,193
 
                 
Cash and cash equivalents—end of period
  $
79,611
    $
70,744


Supplemental disclosure of cash flow information:


Cash paid for taxes
  $
4,403
    $
2,841
 
                 
Cash paid for interest
  $
4,559
    $
1,241


9
 
 
Table of Contents
 
 
NON-CASH ACTIVITIES
On January 1, 2019, the Company recognized a right-of-use asset and lease liability of $19,827 and $24,817, respectively, upon the implementation of Accounting Standards Update 2016-02,
Leases.
See Note 14 for additional information.
In April 2018, the Company issued 14,750 shares of preferred stock and 15,250,000 shares of common stock to ETFS Capital in connection with the ETFS Acquisition which were collectively valued at $270,000 (See Note 3). In addition, a wholly-owned subsidiary of the Company assumed a deferred consideration obligation which was valued at $172,746 on the acquisition date (See Note 11).
The accompanying notes are an integral part of these consolidated financial statements
10
 
 
Table of Contents
 
WisdomTree Investments, Inc. and Subsidiaries
Notes to Consolidated Financial Statements
(In Thousands, Except Share and Per Share Amounts)
1. Organization and Description of Business
WisdomTree Investments, Inc., through its global subsidiaries (collectively, “WisdomTree” or the “Company”), is an exchange traded product (“ETP”) sponsor and asset manager headquartered in New York. WisdomTree offers ETPs covering equity, commodity, fixed income, leveraged and inverse, currency and alternative strategies. The Company has the following wholly-owned operating subsidiaries:
 
WisdomTree Asset Management, Inc.
is a New York based investment adviser registered with the SEC, providing investment advisory and other management services to the WisdomTree Trust (“WTT”) and WisdomTree exchange-traded funds (“ETFs”). The WisdomTree ETFs are issued in the U.S. by WTT. WTT, a
non-consolidated
third party, is a Delaware statutory trust registered with the SEC as an
open-end
management investment company. The Company has licensed to WTT the use of certain of its own indexes on an exclusive basis for the WisdomTree ETFs in the U.S.


ETFS Management Company (Jersey) Limited
(“ManJer”) is a Jersey based management company providing management services to nine issuers (the “ETFS Issuers”) in respect of the ETPs issued and listed by the ETFS Issuers covering commodity, currency and
leveraged-and-inverse
strategies.


Boost Management Limited
(“BML”) is a Jersey based management company providing management services to Boost Issuer PLC (“BI”) in respect of the Boost ETPs issued by BI. BI, a
non-consolidated
third party, is a public limited company domiciled in Ireland.


WisdomTree Management Limited
(“WML”)
is an Ireland based management company providing management services to WisdomTree Issuer plc (“WTI”) in respect of the WisdomTree UCITS ETFs issued by WTI. WTI, a
non-consolidated
third party, is a public limited company domiciled in Ireland.


WisdomTree UK Limited
(“WTUK”)
is a U.K. based company registered with the Financial Conduct Authority currently providing distribution and support services to ManJer, BML and WML.


WisdomTree Europe Limited
is a U.K. based company which is the legacy distributor of the Boost ETPs and WisdomTree UCITS ETFs. These services are now provided directly by WTUK. WisdomTree Europe Limited is no longer regulated and does not provide any regulated services.


WisdomTree Ireland Limited
is an Ireland based company authorized by the Central Bank of Ireland providing distribution services to ManJer, BML and WML.


WisdomTree Asset Management Canada, Inc.
(“WTAMC”) is a Canada based investment fund manager registered with the Ontario Securities Commission providing fund management services to locally-listed WisdomTree Canadian ETFs.


WisdomTree Commodity Services, LLC
(“WTCS”) is a New York based company that serves as the managing owner and commodity pool operator of the WisdomTree Continuous Commodity Index Fund. WTCS is registered with the Commodity Futures Trading Commission and is a member of the National Futures Association.


Acquisition of ETFS
On April 11, 2018, the Company acquired the European exchange-traded commodity, currency and
leveraged-and-inverse
business (“ETFS”) of ETFS Capital Limited (“ETFS Capital”, formerly known as ETF Securities Limited). This acquisition is referred to throughout the consolidated financial statements as the ETFS Acquisition. See Note 3 for additional information.
Restructuring of Distribution Strategy in Japan
In July 2018, the Company determined to restructure its distribution strategy in Japan and has expanded its existing relationship with Premia Partners Company Limited to manage distribution of the Company’s ETFs in Japan. As a result, WisdomTree Japan Inc. (“WTJ”) has ceased operations and is in the process of being liquidated. WTJ reported operating losses during the three months ended June 30, 2019 and 2018 of $35 and $1,125, respectively, and during the six months ended June 30, 2019 and 2018 of $465 and $2,357, respectively. WTJ also recognized an impairment expense of $572 in connection with the termination of its office lease during the six months ended June 30, 2019.
11
 
 
Table of Contents
 
2. Significant Accounting Policies
Basis of Presentation
These consolidated financial statements have been prepared in conformity with U.S. generally accepted accounting principles (“GAAP”) and in the opinion of management reflect all adjustments, consisting of only normal recurring adjustments, necessary for a fair statement of financial condition, results of operations, and cash flows for the periods presented. The consolidated financial statements include the accounts of the Company’s wholly-owned subsidiaries. All intercompany accounts and transactions have been eliminated in consolidation.
The financial results of ETFS are included in the Company’s consolidated financial statements since the acquisition date, April 11, 2018 (See Note 3).
Consolidation
The Company consolidates entities in which it has a controlling financial interest. The Company determines whether it has a controlling financial interest in an entity by first evaluating whether the entity is a voting interest entity (“VOE”) or a variable interest entity (“VIE”). The usual condition for a controlling financial interest in a VOE is ownership of a majority voting interest. If the Company has a majority voting interest in a VOE, the entity is consolidated. The Company has a controlling financial interest in a VIE when the Company has a variable interest that provides it with (i) the power to direct the activities of the VIE that most significantly impact the VIE’s economic performance and (ii) the obligation to absorb losses of the VIE or the right to receive benefits from the VIE that could potentially be significant to the VIE.
The Company reassesses its evaluation of whether an entity is a VIE when certain reconsideration events occur.
Segment and Geographic Information
The Company operates as an ETP sponsor and asset manager providing investment advisory services globally. These activities are reported in the Company’s U.S. Business and International Business reportable segments. The International Business reportable segment includes the results of the Company’s European operations and Canadian operations.
The financial results of ETFS are included in the International Business reportable segment as of the acquisition date.
Foreign Currency Translation
Assets and liabilities of subsidiaries whose functional currency is not the U.S. dollar are translated based on the end of period exchange rates from local currency to U.S. dollars. Results of operations are translated at the average exchange rates in effect during the period. The impact of the foreign currency translation adjustment is included in the Consolidated Statements of Comprehensive Income as a component of other comprehensive (loss)/income. 
Use of Estimates
The preparation of the Company’s consolidated financial statements in conformity with U.S. GAAP requires management to make estimates and assumptions that affect the reported amounts of assets and liabilities as of the balance sheet dates and the reported amounts of revenues and expenses for the periods presented. Actual results could differ materially from those estimates.
Revenue Recognition
The Company earns substantially all of its revenue in the form of advisory fees from its ETPs and recognizes this revenue over time, as the performance obligation is satisfied. ETP advisory fees are based on a percentage of the ETPs’ average daily net assets. Progress is measured using the practical expedient under the output method resulting in the recognition of revenue in the amount for which the Company has a right to invoice.
Contractual Gold Payments
Contractual gold payments are measured and paid monthly based upon the average daily spot price of gold (See Note 11).
Marketing and Advertising
Advertising costs, including media advertising and production costs, are expensed when incurred.
 
12
 
 
Table of Contents
Depreciation and Amortization
Depreciation is provided for using the straight-line method over the estimated useful lives of the related assets as follows:
     
Equipment
 
5
 years
Furniture and fixtures
 
15
 years


Leasehold improvements are amortized over the term of their respective leases or service lives of the improvements, whichever is shorter. Fixed assets are recorded at cost less accumulated depreciation and amortization.
Stock-Based Awards
Accounting for stock-based compensation requires the measurement and recognition of compensation expense for all equity awards based on estimated fair values. Stock-based compensation is measured based on the grant-date fair value of the award and is amortized over the relevant service period. Forfeitures are recognized when they occur.
Third-Party Distribution Fees
The Company pays a percentage of its advisory fee revenues based on incremental growth in AUM, subject to caps or minimums, to marketing agents to sell WisdomTree ETFs and for including WisdomTree ETFs on third-party customer platforms.
Cash and Cash Equivalents
The Company considers all highly liquid investments with an original maturity of
90 days
or less at the time of purchase to be classified as cash equivalents. The Company maintains deposits with financial institutions in an amount that is in excess of federally insured limits.
Accounts Receivable and Allowance for Doubtful Accounts
Accounts receivable are customer and other obligations due under normal trade terms. An allowance for doubtful accounts is not provided since, in the opinion of management, all accounts receivable recorded are deemed current and collectible.
Impairment of Long-Lived Assets
The Company performs a review for the impairment of long-lived assets when events or changes in circumstances indicate that the estimated undiscounted future cash flows expected to be generated by the assets are less than their carrying amounts or when other events occur which may indicate that the carrying amount of an asset may not be recoverable.
Notes Receivable
Notes receivable are accounted for on an amortized cost basis, net of original issue discount. Interest income is accrued over the term of the notes using the effective interest method. The Company performs a review for the impairment of the notes receivable on a quarterly basis and provides for an allowance for credit losses if all or a portion of the notes are determined to be uncollectible.
Securities Owned and Securities Sold, but not yet Purchased (at fair value)
Securities owned and securities sold, but not yet purchased are securities classified as either trading or
available-for-sale.
These securities are recorded on their trade date and are measured at fair value. All equity securities are classified by the Company as trading. Debt securities are classified based primarily on the Company’s intent to hold or sell the security. Changes in the fair value of securities classified as trading are reported in other income in the period the change occurs. Unrealized gains and losses of securities classified as
available-for-sale
are included in other comprehensive income. Once sold, amounts reclassified out of accumulated other comprehensive income and into earnings are determined using the specific identification method.
Available-for-sale
securities are assessed for impairment on a quarterly basis.
Securities
Held-to-Maturity
The Company accounts for certain of its investments as
held-to-maturity
on a trade date basis, which are recorded at amortized cost. For
held-to-maturity
investments, the Company has the intent and ability to hold investments to maturity and it is not more-
likely-than-not
that the Company will be required to sell the investments before recovery of their amortized cost bases, which may be maturity. On a quarterly basis, the Company reviews its portfolio of investments for impairment. If a decline in fair value is deemed to be other-than-temporary, the security is written down to its fair value through earnings.
13
 
 
Table of Contents
 
Investments, Carried at Cost
The Company accounts for equity investments that do not have a readily determinable fair value as cost method investments under the measurement alternative prescribed within Accounting Standards Update (“ASU”)
2016-01,
Financial Instruments – Recognition and Measurement of Financial Assets and Financial Liabilities
, to the extent such investments are not subject to consolidation or the equity method. Under the measurement alternative, these financial instruments are carried at cost, less any impairment (assessed quarterly), plus or minus changes resulting from observable price changes in orderly transactions for an identical or similar investment of the same issuer. In addition, income is recognized when dividends are received only to the extent they are distributed from net accumulated earnings of the investee. Otherwise, such distributions are considered returns of investment and are recorded as a reduction of the cost of the investment.
Goodwill
Goodwill is the excess of the fair value of the purchase price over the fair values of the identifiable net assets at the acquisition date. The Company tests its goodwill for impairment at least annually and at the time of a triggering event requiring
re-evaluation,
if one were to occur, in accordance with ASU
2017-04,
Intangibles-Goodwill and Other (Topic 350): Simplifying the Test for Goodwill Impairment
. The Company early adopted the revised guidance for the impairment tests performed after January 1, 2017. Under the revised guidance, goodwill is considered impaired when the estimated fair value of the reporting unit that was allocated the goodwill is less than its carrying value. If the estimated fair value of such reporting unit is less than its carrying value, goodwill impairment is recognized based on that difference, not to exceed the carrying amount of goodwill. A reporting unit is an operating segment or a component of an operating segment provided that the component constitutes a business for which discrete financial information is available and management regularly reviews the operating results of that component.
For impairment testing purposes, goodwill has been allocated to the Company’s U.S. Business reporting unit which is assessed annually for impairment on April 30
th
. In addition, goodwill arising from the ETFS Acquisition (See Note 3) has been allocated to the European Business reporting unit, included within the International Business reportable segment and is assessed annually for impairment on November 30
th
. When performing its goodwill impairment test, the Company considers a qualitative assessment, when appropriate, and the income approach, market approach and its market capitalization when determining the fair value of its reporting units.
Intangible Assets
Indefinite-lived intangible assets are tested for impairment at least annually and are also reviewed for impairment whenever events or changes in circumstances indicate that the carrying amount of an asset may not be recoverable. Indefinite-lived intangible assets are impaired if their estimated fair values are less than their carrying values.
Finite-lived intangible assets, if any, are amortized over their estimated useful life, which is the period over which the assets are expected to contribute directly or indirectly to the future cash flows of the Company. These intangible assets are tested for impairment at the time of a triggering event, if one were to occur. Finite-lived intangible assets may be impaired when the estimated undiscounted future cash flows generated from the assets are less than their carrying amounts.
The Company may rely on a qualitative assessment when performing its intangible asset impairment test. Otherwise, the impairment evaluation is performed at the lowest level of reasonably identifiable cash flows independent of other assets. The annual impairment testing date for all of the Company’s intangible assets is
November 30
th
.
Leases
Effective January 1, 2019, the Company accounts for its lease obligations in accordance with Accounting Standards Codification (“ASC”) Topic 842,
Leases
(ASC 842), which requires the recognition of both (i) a lease liability equal to the present value of the remaining lease payments and (ii) an offsetting
right-of-use
asset (See Note 14). The remaining lease payments are discounted using the rate implicit in the lease, if known, or otherwise the Company’s incremental borrowing rate. After lease commencement,
right-of-use
assets are assessed for impairment and otherwise are amortized over the remaining lease term on a straight-line basis. These recognition requirements are not applied to short-term leases which are those with a lease term of 12 months or less. Instead, lease payments associated with short-term leases are recognized as an expense on a straight-line basis over the lease term.
ASC 842 also provides a practical expedient which allows for consideration in a contract to be accounted for as a single lease component rather than allocated between lease and
non-lease
components. The Company has elected to apply this practical expedient to all lease contracts, where applicable.
Upon adoption of ASC 842 on January 1, 2019, the Company applied the transitional practical expedients to its outstanding leases and therefore the Company did not reassess (i) whether any expired or existing contracts are or contain leases; (ii) the lease classification for any expired or existing leases; and (iii) initial direct costs for any existing leases. The Company also elected to apply the new lease requirements at the effective date, rather than the beginning of the earliest comparative period presented.
14
 
 
Table of Contents
 
Deferred Consideration – Gold Payments
Deferred consideration represents the present value of an obligation to pay gold to a third party into perpetuity and is measured using forward-looking gold prices and a selected discount rate (See Note 11). Changes in the fair value of this obligation are reported as (loss)
/gain
on revaluation of deferred consideration – gold payments on the Company’s Consolidated Statements of Operations.
Long-Term Debt
Long-term debt is carried at amortized cost, net of debt issuance costs. Interest expense is recognized using the effective interest method and includes amortization of debt issuance costs over the life of the debt.
Earnings per Share
Basic earnings per share (“EPS”) is computed by dividing net income available to common stockholders by the weighted-average number of common shares outstanding for the period. Net income available to common stockholders represents net income of the Company reduced by an allocation of earnings to participating securities. The preferred stock issued in connection with the ETFS Acquisition (see Note 13) and unvested share-based payment awards that contain
non-forfeitable
rights to dividends or dividend equivalents (whether paid or unpaid) are participating securities and are included in the computation of EPS pursuant to the
two-class
method. Share-based payment awards that do not contain such rights are not deemed participating securities and are included in diluted shares outstanding (if dilutive) under the treasury stock method. Diluted EPS reflects the reduction in earnings per share assuming dilutive options or other dilutive contracts to issue common stock were exercised or converted into common stock. Diluted EPS is calculated under the treasury stock and
if-converted
method and the
two-class
method. The calculation that results in the most dilutive EPS amount for the common stock is reported in the Company’s consolidated financial statements.
Income Taxes
The Company accounts for income taxes using the liability method, which requires the determination of deferred tax assets and liabilities based on the differences between the financial and tax bases of assets and liabilities using the enacted tax rates in effect for the year in which differences are expected to reverse. Deferred tax assets are reduced by a valuation allowance if, based on the weight of available evidence, it is
more-likely-than-not
that some portion or all the deferred tax assets will not be realized.
Tax positions are evaluated utilizing a
two-step
process. The Company first determines whether any of its tax positions are more-
likely-than-not
to be sustained upon examination, based solely on the technical merits of the position. Once it is determined that a position meets this recognition threshold, the position is measured as the largest amount of benefit that is greater than 50% likely of being realized upon ultimate settlement. The Company records interest expense and penalties related to tax expenses as income tax expense.
Non-income
based taxes are recorded as part of other liabilities and other expenses.
Recently Issued Accounting Pronouncements
In June 2016, the FASB issued ASU
2016-13,
Financial Instruments-Credit Losses (Topic 326) – Measurement of Credit Losses on Financial Instruments
(ASU
2016-13).
The main objective of the standard is to provide financial statement users with more decision-useful information about the expected credit losses on financial instruments and other commitments to extend credit held by a reporting entity at each reporting date. In issuing this standard, the FASB is responding to criticism that today’s guidance delays recognition of credit losses. The standard will replace today’s “incurred loss” approach with an “expected loss” model. The new model, referred to as the current expected credit loss (“CECL”) model, will apply to: (1) financial assets subject to credit losses and measured at amortized cost, and (2) certain
off-balance
sheet credit exposures. The standard is applicable to loans, accounts receivable, trade receivables, and other financial assets measured at amortized cost, loan commitments and certain other
off-balance
sheet credit exposures, debt securities (including those
held-to-maturity)
and other financial assets measured at fair value through other comprehensive income, and beneficial interests in securitized financial assets. The CECL model does not apply to
available-for-sale
debt securities. For
available-for-sale
debt securities with unrealized losses, entities will measure credit losses in a manner similar to what they do today, except that the credit losses will be recognized as allowances rather than reductions in the amortized cost of the securities. Accordingly, the new methodology will be utilized when assessing the Company’s financial instruments for impairment. As a result, entities will recognize improvements to estimated credit losses immediately in earnings rather than as interest income over time, as they do today. The ASU also simplifies the accounting model for purchased credit-impaired debt securities and loans. ASU
2016-13
also expands the disclosure requirements regarding an entity’s assumptions, models, and methods for estimating the allowance for loan and lease losses. ASU
2016-13
is effective for years beginning after December 15, 2019, including interim periods within those fiscal years under a modified retrospective approach. Early adoption is permitted for the periods beginning after December 15, 2018. The Company is currently evaluating the impact that this standard will have on its consolidated financial statements and plans to adopt this standard on January 1, 2020.
 
15


Table of Contents
 
In August 2018, the FASB issued ASU 2018-13,
Fair Value Measurement (Topic 820) – Disclosure Framework – Changes to the Disclosure Requirements for Fair Value Measurement
(ASU 2018-13), which modifies the disclosure requirements on fair value measurements, including removing the requirement to disclose (1) the amount of and reasons for transfers between Level 1 and Level 2 of the fair value hierarchy
,
(2)
 the policy for timing of transfers between levels and
(3)
 the valuation processes for Level 
3
fair value measurements. ASU
2018-13
also added new disclosures including the requirement to disclose (a) the changes in unrealized gains and losses for the period included in other comprehensive income for recurring Level 
3
fair value measurements held at the end of the reporting period and (b) the range and weighted average of significant unobservable inputs used to develop Level 
3
fair value measurements. ASU
2018-13
is effective for fiscal years (and interim reporting periods within those years) beginning after December 
15
,
2019
and early adoption is permitted. This standard will only impact the disclosures pertaining to fair value measurements. The Company plans to adopt this standard on January 
1
,
2020
.
3. Business Combination
Summary
On April 11, 2018, the Company acquired from ETFS Capital its European exchange-traded commodity, currency and
short-and-leveraged
business for a purchase price consisting of $253,000 in cash and a fixed number of shares of the Company’s capital stock, consisting of (i) 15,250,000 shares of common stock (the “Common Shares”) and (ii) 14,750 shares of Series A
Non-Voting
Convertible Preferred Stock (the “Preferred Shares”), which are convertible into an aggregate of 14,750,000 shares of common stock. ETFS Capital is subject to
lock-up,
standstill and voting restrictions and received registration rights with respect to the Common Shares and shares issuable upon conversion of the Preferred Shares.
Also on April 11, 2018 and in connection with the acquisition, the Company entered into a credit agreement, pursuant to which the lenders extended a $200,000 term loan (the “Term Loan”) and made available a $50,000 revolving credit facility (the “Revolver” and, together with the Term Loan, the “Credit Facility”) (See Note 12).
Purchase Price Allocation
The ETFS Acquisition has been accounted for under the acquisition method of accounting in accordance with ASC Topic 805,
Business Combinations,
which requires an allocation of the consideration paid by the Company to the identifiable assets and liabilities of ETFS based on the estimated fair values as of the closing date of the acquisition. An allocation of the consideration transferred is presented below and includes the Company’s valuation of the fair value of tangible and intangible assets acquired and liabilities assumed.
The following table summarizes the allocation of the purchase price as of the acquisition date:
         
Purchase price
 
Preferred Shares issued
   
14,750
 
Conversion ratio
   
1,000
 
         
Common stock equivalents
   
14,750,000
 
Common Shares issued
   
15,250,000
 
         
Total shares issued
   
30,000,000
 
WisdomTree stock price
(1)
  $
9.00
 
         
Equity portion of purchase price
  $
270,000
 
Cash portion of purchase price
   
 
Term Loan (See Note 12)
   
200,000
 
Cash on hand
   
53,000
 
         
Purchase price
   
523,000
 
Deferred consideration (See Note 11)
   
172,746
 
         
Total
  $
  695,746
 
Allocation of consideration
   
 
Cash and cash equivalents
   
13,687
 
Receivables and other current assets
   
14,069
 
Intangible assets
(2)
   
601,247
 
Other current liabilities
   
(17,314
)
         
Fair value of net assets acquired
   
611,689
 
         
Goodwill resulting from the ETFS Acquisition
(3)
  $
84,057


(1) The closing price of the Company’s common stock on April 10, 2018, the trading day prior to the closing date of the acquisition.


16


Table of Contents


(2) Represents purchase price allocated to customary advisory agreements. The fair value of the intangible assets was determined using an income approach (discounted cash flow analysis) which relied upon significant unobservable inputs including a revenue growth multiple of 3% to 4% and a weighted average cost of capital of 11.6%. These intangible assets were determined to have an indefinite useful life and are not deductible for tax purposes. A deferred tax liability associated with these intangible assets was not recognized as the intangibles arose in Jersey, a jurisdiction where the Company is subject to a zero percent tax rate.


(3) Goodwill arising from the ETFS Acquisition represents the value of synergies created from combining the operations of ETFS and the Company. The goodwill is not deductible for tax purposes as the transaction was structured as a stock acquisition occurring in the United Kingdom.


Acquisition-Related Costs
During the three and six months ended June 30, 2019, the Company incurred acquisition-related costs of $33 and $346, respectively, which were predominantly associated with the integration of ETFS.
During the three and six months ended June 30, 2018, the Company incurred acquisition-related costs of $7,928 and $9,990, respectively, which included professional advisor fees, severance and other compensation costs, a
write-off
of the Company’s office lease and other integration costs.
Operating Results of ETFS
The Company’s Consolidated Statements of Operations include the following operating results of ETFS since the acquisition date of April 11, 2018 through June 30, 2018:
     
Revenues:
 
$18,218
     
Income before income taxes:
 
$18,102 (including a gain on revaluation of deferred consideration of $9,898)


Supplemental Unaudited Pro Forma Financial Information
 
The following table presents unaudited pro forma financial information of the Company as if the ETFS Acquisition had been consummated on January 1, 2018. The information was derived from the historical financial results of the Company and ETFS for all periods presented and was adjusted to give effect to pro forma events that are directly attributable to the acquisition, factually supportable and expected to have a continuing impact on the combined results following the acquisition.
                 
 
Three Months
Ended
June 30,
2018
   
Six Months
Ended
June 30,
2018
 
Revenues:
  $
78,025
    $
157,796
 
Net income:
  $
23,274
    $
34,517


Included within the proforma financial information above is a gain on revaluation of deferred consideration of $8,326 and $5,771 during the three and six months ended June 30, 2018, respectively. Significant adjustments to the unaudited pro forma financial information above include the recognition of interest expense associated with the Credit Facility for the periods presented, eliminating acquisition-related costs directly attributable to the acquisition and adjusting consolidated income tax expense based upon the Company’s anticipated normalized consolidated effective tax rate.
 
The unaudited pro forma financial information above is not necessarily indicative of what the combined results of the Company would have been had the acquisition been completed as of January 1, 2018 and does not purport to project the future results of the combined company. In addition, the unaudited pro forma financial information does not reflect any future planned cost savings initiatives following the completion of the acquisition.
4. Cash and Cash Equivalents
Cash and cash equivalents of approximately $71,564 and $60,779 at June 30, 2019 and December 31, 2018, respectively, were held at two financial institutions. At June 30, 2019 and December 31, 2018, cash equivalents were approximately $1,811 and $24, respectively.
 
17


Table of Contents
 
In addition, certain of the Company’s subsidiaries of its International Business segment are required to maintain a minimum level of net liquid assets, which was $12,255 and $11,005 at June 30, 2019 and December 31, 2018, respectively. These requirements are generally satisfied by cash on hand.
 
5. Fair Value Measurements
 
The fair value of financial instruments is defined as the price that would be received to sell an asset or paid to transfer a liability (i.e., “the exit price”) in an orderly transaction between market participants at the measurement date. ASC 820,
Fair Value Measurements
, establishes a hierarchy for inputs used in measuring fair value that maximizes the use of observable inputs and minimizes the use of unobservable inputs by requiring that the most observable inputs be used when available. Observable inputs are inputs that market participants would use in pricing the asset or liability developed based on market data obtained from independent sources. Unobservable inputs reflect assumptions that market participants would use in pricing the asset or liability developed based on the best information available in the circumstances. The hierarchy is broken down into three levels based on the transparency of inputs as follows:
Level 1 –
 
Quoted prices for identical instruments in active markets.
     
Level 2 –
 
Quoted prices for similar instruments in active markets; quoted prices for identical or similar instruments in markets that are not active; and model-derived valuations whose inputs are observable or whose significant value drivers are observable.
     
Level 3 –
 
Instruments whose significant drivers are unobservable.


The availability of observable inputs can vary from product to product and is affected by a wide variety of factors, including, for example, the type of product, whether the product is new and not yet established in the marketplace, and other characteristics particular to the transaction. To the extent that valuation is based on models or inputs that are less observable or unobservable in the market, the determination of fair value requires more judgment. Accordingly, the degree of judgment exercised by management in determining fair value is greatest for instruments categorized in Level 3. In certain cases, the inputs used to measure fair value may fall into different levels of the fair value hierarchy. In such cases, for disclosure purposes, the level in the fair value hierarchy within which the fair value measurement in its entirety falls is determined based on the lowest level input that is significant to the fair value measurement in its entirety.
 
The tables below summarize the categorization of the Company’s assets and liabilities measured at fair value. During the three and six months ended June 30, 2019 and 2018, there were no transfers between Levels 1, 2 and 3.
                                 
 
June 30, 2019
 
 
Total
   
Level 1
   
Level 2
   
Level 3
 
Assets:


Recurring fair value measurements:


Cash equivalents
  $
  1,811
    $
  1,811
    $
—  
    $
  —  
 
Securities owned, at fair value
   
9,095
     
9,095
     
—  
     
—  
 
                                 
Total
  $
  10,906
    $
  10,906
     
—  
    $
  —  


Liabilities:


Recurring fair value measurements:


Deferred consideration (Note 11)
  $
  161,273
    $
—  
    $
—  
    $
  161,273
 
Securities sold, but not yet purchased
   
543
     
543
     
—  
     
—  
 
                                 
Total
  $
161,816
    $
543
    $
  —  
    $
161,273


18


Table of Contents
                                 
 
December 31, 2018
 
 
Total
   
Level 1
   
Level 2
   
Level 3
 
Assets:


Recurring fair value measurements:


Cash and cash equivalents
  $
  24
    $
  24
    $
  —  
    $
  —  
 
Securities owned, at fair value
   
8,873
     
8,873
     
—  
     
—  
 
                                 
Total
  $
  8,897
    $
  8,897
    $
  —  
    $
  —  


Non-recurring
 fair value measurements:


Thesys Group, Inc. 
– 
Series Y preferred stock
(1)
  $
3,080
     
—  
     
—  
    $
3,080
 
                                 
Total
  $
3,080
    $
—  
    $
—  
    $
3,080


Liabilities:


Recurring fair value measurements:


Deferred consideration (Note 11)
  $
161,540
    $
—  
    $
—  
    $
  161,540
 
Securities sold, but not yet purchased
   
1,698
     
1,698
     
—  
     
—  
 
                                 
Total
  $
  163,238
    $
1,698
    $
  —  
    $
161,540


(1) Fair value determined on December 31, 2018 (See Note 9).


Recurring Fair Value Measurements - Methodology
Cash Equivalents (Note 4)
– These financial assets represent cash invested in highly liquid investments with original maturities of less than 90 days. These investments are valued at par, which approximates fair value, and are considered Level 1.
Securities Owned/Sold but Not Yet Purchased (Note
6) 
Securities owned and sold, but not yet purchased are investments in ETFs. ETFs are generally traded in active, quoted and highly liquid markets and are therefore classified as Level 
1
in the fair value hierarchy.
Deferred Consideration 
– 
Deferred consideration represents the present value of an obligation to pay gold into perpetuity and was measured at
June 
30
,
2019
using forward-looking gold prices ranging from $
1,417
per ounce to $
2,201
per ounce ($
1,294
per ounce to $
2,621
per ounce at December 
31
,
2018)
which are extrapolated from the last observable price (beyond
2025)
, discounted at a rate of
10
% and includes a perpetual growth rate of
1.5
%. This obligation is classified as Level 
3
as the discount rate, perpetual growth rate and extrapolated forward-looking gold prices are significant unobservable inputs. An increase in forward-looking gold prices would result in an increase in deferred consideration, whereas an increase in the discount rate would reduce the fair value. See Note
11
for additional information.
The following table presents a reconciliation of beginning and ending balances of recurring fair value measurements classified as Level 3:
                                 
 
Three Months Ended
June 30,
   
Six Months Ended
June 30,
 
 
2019
   
2018
   
2019
   
2018
 
Deferred consideration (See Note 11)


Beginning balance
  $
  157,147
    $
  172,746
    $
  161,540
    $
  172,746
 
Net realized losses/(gains)
(1)
   
3,110
     
2,715
     
6,208
     
2,715
 
Net unrealized losses/(gains)
(2)
   
4,037
     
(9,898
)    
(367
)    
(9,898
)
Settlements
   
(3,021
)    
(2,715
)    
(6,108
)    
(2,715
)
                                 
Ending balance
  $
161,273
    $
162,848
    $
161,273
    $
162,848


(1) Recorded as contractual gold payments on the Company’s Consolidated Statements of Operations.


(2) Recorded as (loss)/gain on revaluation of deferred consideration – gold payments on the Company’s Consolidated Statements of Operations.


19


Table of Contents
 
6. Securities Owned/Sold, but Not Yet Purchased
These securities consist of the following:
                 
 
June 30,
2019
   
December 31,
2018
 
Securities Owned


Trading securities
  $
9,095
    $
8,873
 
                 
Securities Sold, but not yet Purchased


Trading securities
  $
543
    $
1,698


The Company had no
available-for-sale
debt securities at June 30, 2019 and December 31, 2018. During the three and six months ended June 30, 2018, the Company received $4,000 and $64,498, respectively, of proceeds from the sale and maturity of
available-for-sale
securities and recognized gross realized losses of $23 and $739, respectively. Those losses were reclassified out of accumulated other comprehensive income and into the Consolidated Statements of Operations.
7. Securities
Held-to-Maturity
The following table is a summary of the Company’s securities
held-to-maturity:
                 
 
June 30,
2019
   
December 31,
2018
 
Federal agency debt instruments (amortized cost)
  $
20,136
    $
20,180


The following table summarizes unrealized gains, losses, and fair value (classified as Level 2 within the fair value hierarchy) of securities
held-to-maturity:
                 
 
June 30,
2019
   
December 31,
2018
 
Cost/amortized cost
  $
20,136
    $
20,180
 
Gross unrealized gains
   
8
     
5
 
Gross unrealized losses
   
(505
)    
(1,679
)
                 
Fair value
  $
19,639
    $
18,506


The Company assesses these securities for other-than-temporary impairment on a quarterly basis. No securities were determined to be other-than-temporarily impaired at June 30, 2019 or December 31, 2018. The Company does not intend to sell these securities and it is not
more-likely-than-not
that the Company will be required to sell the securities before recovery of their amortized cost bases, which may be maturity.
The following table sets forth the maturity profile of the securities
held-to-maturity;
however, these securities may be called prior to maturity date:
                 
 
June 30,
2019
   
December 31,
2018
 
Due within one year
  $
—  
    $
—  
 
Due one year through five years
   
—  
     
—  
 
Due five years through ten years
   
7,517
     
7,521
 
Due over ten years
   
12,619
     
12,659
 
                 
Total
  $
20,136
    $
20,180


8. Notes Receivable
The following table sets forth the Company’s notes receivable:
                 
 
June 30,
2019
   
December 31,
2018
 
AdvisorEngine Inc. – Unsecured non-convertible note
  $
29,935
    $
28,722
 
AdvisorEngine Inc. – Unsecured convertible note
   
1,550
     
—  
 
                 
Total
  $
31,485
    $
28,722


20


Table of Contents
 
During the three months ended June 30, 2019 and 2018, the Company recognized interest income of $628 and $421, respectively. During the six months ended June 30, 2019 and 2018, the Company recognized interest income of $1,223 and $840, respectively. Interest income included original issue discount 
(“OID”)
amortization and accrued
paid-in-kind (“PIK”)
interest. The Company determined that an allowance for credit loss was not necessary at June 30, 2019 and December 31, 2018 as there have been no adverse events or circumstances since the notes were issued which may indicate that their carrying amounts may not be recoverable.
Unsecured Non-Convertible Note
The Company has an outstanding unsecured promissory note from AdvisorEngine Inc. (“AdvisorEngine”). All principal amounts under the note bear interest from the date such amounts are advanced until repaid at a rate of 5% per annum, provided that immediately upon the occurrence and during the continuance of an event of default (as defined), interest will be increased to 10% per annum. All accrued and unpaid interest is treated as PIK by capitalizing such amount and adding it to the principal amount of the original note. AdvisorEngine has the option to prepay the note, in whole or in part, at any time without premium or penalty. All borrowings under the promissory note mature on December 29, 2021.
The following is a summary of the outstanding unsecured non-convertible note receivable balance:
                 
 
June 30,
2019
   
December 31,
2018
 
Note receivable (face value)
  $
30,000
    $
30,000
 
Less: OID, unamortized
   
(2,167
)    
(2,582
)
Plus: PIK interest
   
2,102
     
1,304
 
                 
Total note receivable, net
  $
29,935
    $
28,722


The fair value of the note receivable (classified as Level 2 within the fair value hierarchy and determined using high yield credit spreads) was $29,703 and $27,618 at June 30, 2019 and December 31, 2018, respectively.
Unsecured Convertible Note
In April 2019, the Company participated in a private convertible note financing round of AdvisorEngine by advancing $1,540 in consideration for a convertible note, which was issued as part of a series of convertible notes pursuant to a Convertible Note Purchase Agreement entered into among AdvisorEngine, the Company and the other purchasers thereto. The convertible note bears interest at a rate of 3% per annum, with all or any unpaid portion being treated as PIK by capitalizing such amount and adding it to the principal amount outstanding, is unsecured, and matures on April 11, 2021. All principal (and, at the option of AdvisorEngine if not paid in cash, accrued interest) under the convertible note will automatically convert into a class or series of preferred stock substantially identical to that issued in a qualified financing (as defined), but at a price per share equal to 80% of the price per share sold in such transaction. In the event of a corporate transaction (as defined) the
convertible note would be repaid in cash from the proceeds of such transaction in the amount of 1.5 times the outstanding principal amount, plus any accrued and unpaid interest
. If neither a qualified financing nor a corporate transaction occurs prior to the maturity date, the
convertible note is repaid at a rate of 1.25 times the outstanding principal amount, plus accrued and unpaid interest
. The convertible note may not be prepaid by AdvisorEngine without the prior consent of the requisite holders (which includes the Company).
The following is a summary of the outstanding unsecured convertible note receivable balance:
         
 
June 30,
2019
 
Note receivable (face value)
  $
  1,540
 
Plus: PIK interest
   
10
 
         
Total note receivable, net
  $
1,550


The carrying value of the note receivable approximates fair value at June 30, 2019 due to its short-term nature.
9. Investments, Carried at Cost
The following table sets forth the Company’s investments, carried at cost:
                 
 
June 30,
2019
   
December 31,
2018
 
AdvisorEngine – Preferred stock
  $
25,000
    $
25,000
 
Thesys Group, Inc. (“Thesys”)
   
3,080
     
3,080
 
                 
Total
  $
28,080
    $
28,080


21


Table of Contents
 
AdvisorEngine
Preferred Stock
The Company owns approximately 46% (or 41% on a fully-diluted basis) of AdvisorEngine, a digital wealth management platform, through strategic investments totaling $25,000. In consideration of its investment, the Company received 11,811,856 shares and 2,646,062 shares of Series A and Series
A-1
convertible preferred stock, respectively. The Series A and Series
A-1
preferred shares have substantially the same terms, are convertible into common stock at the option of the Company and contain various rights and protections including a
non-cumulative
6.0% dividend, payable if and when declared by the board of directors, and a liquidation preference that is senior to all other holders of capital stock of AdvisorEngine. The Company and AdvisorEngine also entered into an agreement whereby the Company’s asset allocation models are made available through AdvisorEngine’s open architecture platform and the Company actively introduces the platform to its distribution network.
The investment is accounted for under the cost method of accounting as it is not considered to be
in-substance
common stock. The Company quantitatively assessed its investment for impairment at December 31, 2018. The table below presents the ranges and weighted averages of significant unobservable inputs used in this assessment:
         
 
Range (Weighted Average)
  
Market Approach
   
 
Revenue multiple
   
4.7x
 -
 5.4x
(5.0x)
Income Approach
   
 
Weighted average cost of capital (“WACC”)
   
26.0


An increase in the revenue multiple would result in a higher enterprise value, whereas an increase in the WACC would reduce fair value. The results of the quantitative assessment noted no impairment at December 31, 2018. In addition, no impairment existed at June 30, 2019 based upon a qualitative assessment. There were also no observable price changes during the applicable reporting periods.
Thesys
On June 20, 2017, the Company was issued 7,797,533 newly authorized shares of Series Y preferred stock (“Series Y Preferred”) of Thesys in connection with the resolution of a dispute related to the Company’s ownership stake in Thesys. The Series Y Preferred represents current ownership of approximately 19% of Thesys on a fully diluted basis (excluding certain reserved shares). In addition, the Company was issued a warrant to purchase 3,898,766 shares of Series Y Preferred.
The Series Y Preferred ranks
pari passu
in priority with Thesys’s current preferred stockholders, has a liquidation preference of $0.231 per share, contains various rights and protections and is convertible into common stock at the option of the Company. The warrant is exercisable for five years after closing, at varying exercise prices that increase over time and set at multiples of a
pre-determined
Thesys valuation (or new valuation if Thesys completes a qualified financing, as defined, within two years). If a claim is brought against Thesys or the Company relating to the settlement, the warrant will be exercisable for 100% of the number of shares of Series Y Preferred issued to the Company at closing.
The Series Y Preferred is accounted for under the cost method of accounting as it is not considered to be
in-substance
common stock. The Company quantitatively assessed its investment for impairment at December 31, 2018. The table below presents the ranges and weighted averages of significant unobservable inputs used in this assessment:
         
 
Range (Weighted Average)
 
Income Approach
(1)
 
 
Weighted average cost of capital (“WACC”)
   
3.8%
 -
 15.5% (14.1%
)


(1) The inputs selected varied, based upon the Thesys business line being valued. An increase in the WACC would result in a lower enterprise value.


The quantitative assessment performed resulted in the recognition of an impairment in the fourth quarter of 2018. No additional impairment was recognized at June 30, 2019 based upon a qualitative assessment. There were also no observable price changes during the applicable reporting periods.
The carrying value of the Series Y Preferred was $3,080 at June 30, 2019 and December 31, 2018, respectively. The fair value of the warrant was determined to be insignificant. The warrant is not accounted for as a derivative as it cannot be net settled and is not readily convertible to cash.
 
22


Table of Contents
 
10. Fixed Assets, net
The following table summarizes fixed assets:
                 
 
June 30,
2019
   
December 31,
2018
 
Equipment
  $
2,259
    $
2,244
 
Furniture and fixtures
   
2,218
     
2,218
 
Leasehold improvements
   
10,964
     
10,964
 
Less: accumulated depreciation and amortization
   
(6,837
)    
(6,304
)
                 
Total
  $
8,604
    $
9,122


11. Deferred Consideration
Deferred consideration represents an obligation the Company assumed in connection with the ETFS Acquisition. The obligation is for fixed payments to ETFS Capital of physical gold bullion equating to
9,500
ounces of gold per year through March 31, 2058 and then subsequently reduced to
6,333
ounces of gold continuing into perpetuity (“Contractual Gold Payments”).
The Contractual Gold Payments are paid from advisory fee income generated by any Company-sponsored financial product backed by physical gold and are subject to adjustment and reduction for declines in advisory fee income generated by such products, with any reduction remaining due and payable until paid in full. ETFS Capital’s recourse is limited to such advisory fee income and it has
no
recourse back to the Company for any unpaid amounts that exceed advisory fees earned. ETFS Capital ultimately has the right to claw back Gold Bullion Securities Ltd. (a physically backed gold ETP issuer) if the Company fails to remit any amounts due.
The Company determined the present value of the deferred consideration of $161,273 and $161,540 at June 30, 2019 and December 31, 2018, respectively, using forward-looking gold prices which were extrapolated from the last observable price (beyond 2025), discounted at a rate of 10.0% and a perpetual growth rate of 1.5%. Current amounts payable were $12,857 and $11,765 and long-term amounts payable were $148,416 and $149,775, respectively, at June 30, 2019 and December 31, 2018, respectively.
During the three and six months ended June 30, 2019 and 2018, the Company recognized the following in respect of deferred consideration:
                                 
 
Three Months Ended
June 30,
   
Six Months Ended
June 30,
 
 
2019
   
2018
   
2019
   
2018


Contractual Gold Payments
  $
  3,110
    $
  2,715
    $
  6,208
    $
  2,715
 
Contractual Gold Payments – gold ounces paid
   
2,375
     
2,085
(1) 
   
4,750
     
2,085
(1)
(Loss)/gain on revaluation of deferred consideration – gold payments
(2)
  $
(4,037
)   $
9,898
    $
367
    $
9,898


(1) Represents payments during the period April 11, 2018 through June 30, 2018.


(2) Gains/(losses) arise due to (decreases)/increases in the forward-looking price of gold and the magnitude of any gain or loss is highly correlated to the magnitude of the change in the forward-looking price of gold. See Note 5 for a reconciliation of changes in the deferred consideration balances.


12. Long-Term Debt
On April 11, 2018 and in connection with the ETFS Acquisition, the Company entered into the Credit Facility pursuant to which the lenders extended a $200,000 Term Loan and made available a $50,000 Revolver. Interest on the Term Loan accrues at an annual rate equal to LIBOR, plus up to
2.00
% (commencing at
LIBOR
, plus
1.75
%)
, and interest on the Revolver accrues at an annual rate equal to LIBOR, plus up to
1.50
% (commencing at LIBOR, plus
1.25
%)
, in each case, with the exact interest rate margin determined based on the Total Leverage Ratio (as defined below). The Revolver is also subject to a facility fee equal to an annual rate of up to 0.50% of the actual daily amount of the aggregate commitments (whether used or unused) under the Revolver, with the exact facility fee rate determined based on the Total Leverage Ratio. The Credit Facility matures on April 11, 2021. The Term Loan does not amortize and the entire principal balance is due in a single payment on the maturity date.
 
23


Table of Contents
 
The following table provides a summary of the Company’s outstanding borrowings under the Credit Facility:
                                 
 
June 30, 2019
   
December 31, 2018
 
 
Term Loan
   
Revolver
(1) 
   
Term Loan
   
Revolver
(1) 
  
Amount borrowed
  $
200,000
    $
 —  
    $
200,000
    $
—  
 
Unamortized issuance costs
   
(4,238
)    
935
     
(5,408
)    
1,195
 
                                 
Carrying amount
  $
195,762
    $
935
    $
194,592
    $
1,195
 
                                 
Effective interest rate
(2)
   
5.46
%    
n/a
     
5.09
%    
n/a


(1)
The available capacity under the Revolver is subject to compliance with the Total Leverage Ratio.
(2)
Includes amortization of issuance costs.


Interest expense recognized on the Credit Facility during the three months ended June 30, 2019 and 2018 was $2,910 and $2,356, respectively, and during the six months ended June 30, 2019 and 2018 was $5,802 and $2,356, respectively. Unamortized issuance costs related to the Revolver of $935 and $1,195 at June 30, 2019 and December 31, 2018, respectively, are included in other noncurrent assets on the Consolidated Balance Sheet. The fair value of the Company’s long-term debt (classified as Level 2 within the fair value hierarchy) was $197,500 and $196,126 at June 30, 2019 and December 31, 2018, respectively.
The credit agreement includes a financial covenant that requires the Company to maintain a Total Leverage Ratio (as defined below), calculated as of the last day of each fiscal quarter, equal to or less than the ratio set forth opposite such fiscal quarter: 
 
         
Fiscal Quarter Ending
 
Total Leverage Ratio
 
June 30, 2019
   
2.50:1.00
 
September 30, 2019
   
2.50:1.00
 
December 31, 2019
   
2.50:1.00
 
March 31, 2020
   
2.25:1.00
 
June 30, 2020
   
2.25:1.00
 
September 30, 2020 and each subsequent fiscal quarter ending on or before the maturity date
   
2.00:1.00


Total Leverage Ratio means, as of the last day of any fiscal quarter, the ratio of Consolidated Total Debt of the Company and its restricted subsidiaries (as defined in the credit agreement) as of such date to Consolidated EBITDA of the Company and its restricted subsidiaries (as defined in the credit agreement) for the four consecutive fiscal quarters ended on such date.
The Company’s obligations under the Term Loan and Revolver are unconditionally guaranteed by the Company and certain of its subsidiaries and secured by substantially all of the present and future property and assets of the Company and such subsidiaries, in each case, subject to customary exceptions and exclusions.
The credit agreement contains customary affirmative covenants for transactions of this type and other affirmative covenants agreed to by the parties, including, among others, the provision of annual and quarterly financial statements and compliance certificates, maintenance of property, insurance, compliance with laws and environmental matters. The credit agreement contains customary negative covenants, including among others, restrictions on the incurrence of indebtedness, granting of liens, making investments and acquisitions, paying dividends, repurchasing equity interests of the Company, entering into affiliate transactions and asset sales. The credit agreement also provides for a number of customary events of default, including, among others, payment, bankruptcy, covenant, representation and warranty, change of control and judgment defaults.
The Company is in compliance with its covenants under the credit agreement.
13. Preferred Shares
On April 10, 2018, the Company filed a Certificate of Designations of Series A
Non-Voting
Convertible Preferred Stock with the Secretary of State of the State of Delaware establishing the rights, preferences, privileges, qualifications, restrictions, and limitations relating to the Preferred Shares. The Preferred Shares are intended to provide ETFS Capital with economic rights equivalent to the Company’s common stock on an
as-converted
basis. The Preferred Shares have no voting rights, are not transferable and have the same priority with regard to dividends, distributions and payments as the common stock.
As described in the Certificate of Designations, the Company will not issue, and ETFS Capital does not have the right to require the Company to issue, any shares of common stock upon conversion of the Preferred Shares, if, as a result of such conversion, ETFS Capital (together with certain attribution parties) would beneficially own more than
9
.99% of the Company’s outstanding common stock immediately after giving effect to such conversion.
 
24


Table of Contents
 
In connection with the completion of the ETFS Acquisition, the Company issued 14,750 Preferred Shares, which are convertible into an aggregate of 14,750,000 shares of common stock. The fair value of this consideration was $132,750, based on the closing price of the Company’s common stock on April 10, 2018 of $9.00 per share, the trading day prior to the closing of the acquisition.
The following is a summary of the Preferred Share balance:
                 
 
June 30,
2019
   
December 31,
2018
 
Issuance of Preferred Shares
  $
  132,750
    $
  132,750
 
Less: Issuance costs
   
(181
)    
(181
)
                 
Preferred Shares – carrying value
  $
132,569
    $
132,569


Temporary equity classification is required for redeemable instruments for which redemption triggers are outside of the issuer’s control. ETFS Capital has the right to redeem all the Preferred Shares specified to be converted during the period of time specified in the Certificate of Designations in the event that: (a) the number of shares of the Company’s common stock authorized by its certificate of incorporation is insufficient to permit the Company to convert all of the Preferred Shares requested by ETFS Capital to be converted; or (b) ETFS Capital does not, upon completion of a change of control of the Company, receive the same amount per Preferred Share as it would have received had each outstanding Preferred Share been converted into common stock immediately prior to the change of control. However, the Company will not be obligated to make any such redemption payments to the extent such payments would be a breach of any covenant or obligation the Company owes to any of its secured creditors or is otherwise prohibited by applicable law.
Any such redemption will be at a price per Preferred Share equal to the dollar volume-weighted average price for a share of common stock for the
30-trading
day period ending on the date of such attempted conversion or change of control, as applicable, multiplied by 1,000. Such redemption payment will be made in one payment no later than 10 business days following the last day of the Company’s 
first fiscal quarter that begins on a date following the date ETFS Capital exercises such redemption right.
The carrying amount of the Preferred Shares was not adjusted as it was not probable that the Preferred Shares would become redeemable.
14. Leases
The Company has entered into operating leases for its corporate headquarters and other office facilities, financial data terminals and equipment. The Company has no finance leases.
Upon the adoption of ASC 842 on January 1, 2019, the Company recognized a
right-of-use
asset and lease liability of $19,827 and $24,817, respectively. The
right-of-use
asset was equal to the lease liability, less accrued lease payments and remaining unamortized lease incentives.
The following table provides additional information regarding the Company’s leases:
                                 
 
Three Months Ended June 30,
   
Six Months Ended 
June 30,
 
 
2019
   
2018
   
2019
   
2018
 
Lease cost:


Operating lease cost
  $
795
    $
857
    $
1,590
    $
1,600
 
Short-term lease cost
   
383
     
432
     
772
     
716
 
                                 
Total lease cost
  $
1,178
    $
1,289
    $
2,362
    $
2,316
 
                                 
Other information:


Cash paid for amounts included in the measurement of operating liabilities (operating leases)
  $
875
     
n/a
    $
1,760
     
n/a
 
                                 
Right-of-use
assets obtained in exchange for new operating lease liabilities
   
n/a
     
n/a
     
n/a
     
n/a
 
                                 
Weighted-average remaining lease term (in years) – operating leases
   
9.8
     
n/a
     
9.8
     
n/a
 
                                 
Weighted-average discount rate – operating leases
   
6.3
%    
n/a
     
6.3
%    
n/a


None of the Company’s leases include variable payments, residual value guarantees or any restrictions or covenants relating to the Company’s ability to pay dividends or incur additional financing obligations.
 
25


Table of Contents
 
The Company’s lease of its headquarters, which expires on August 20, 2029, includes an option to extend for an additional five years. Rent payable under the option is equal to the fair market rent of the premise as determined by the landlord approximately six months prior to the commencement of the extension term. The lease also includes a cancellation option which is effective on August 21, 2024 and requires notice to be provided to the landlord at least 12 months prior. Triggering this option requires a cancellation payment of $4,236. The cancellation and extension options were not reasonably certain of being exercised and were therefore not recognized as part of the
right-of-use
asset and lease liability.
Other leases also include extension, automatic renewal and termination provisions. These provisions were also not reasonably certain of being exercised and were therefore not recognized as part of the
right-of-use
asset and lease liability.
The following table discloses future minimum lease payments at June 30, 2019 with respect to the Company’s operating lease liabilities:
         
Remainder of 2019
  $
1,832
 
2020
   
3,676
 
2021
   
2,958
 
2022
   
2,958
 
2023
   
2,958
 
2024 and thereafter
   
17,641
 
         
Total future minimum lease payments (undiscounted)
  $
32,023


The following table reconciles the future minimum lease payments (disclosed above) at June 30, 2019 to the operating lease liabilities recognized in the Company’s Consolidated Balance Sheet: 
         
Amounts recognized in the Company’s Consolidated Balance Sheet
   
 
Lease liability – short term
  $
3,632
 
Lease liability – long term
   
20,190
 
         
Subtotal
   
23,822
 
Difference between undiscounted and discounted cash flows
   
8,201
 
         
Total future minimum lease payments (undiscounted)
  $
32,023


The following table discloses the future minimum lease payments at June 30, 2018 (prior period), which is required as the Company elected to apply the new lease requirements at the effective date, rather than the beginning of the earliest comparative period presented:
         
Remainder of 2018
  $
1,948
 
2019
   
3,764
 
2020
   
3,516
 
2021
   
3,146
 
2022
   
2,958
 
2023 and thereafter
   
20,599
 
         
Total future minimum lease payments (undiscounted)
  $
35,931


Lease Termination – Japan Office
During the six months ended June 30, 2019, the Company recognized an impairment expense of $572 in connection with the termination of its Japan office lease.
Letter of Credit
The Company collateralized its U.S. office lease through a standby letter of credit totaling $1,384. The collateral is included in cash and cash equivalents on the Company’s Consolidated Balance Sheets.
 
26


Table of Contents
 
15. Contingencies
The Company may be subject to reviews, inspections and investigations by regulatory authorities as well as legal proceedings arising in the ordinary course of business. The Company is not currently party to any litigation that is expected to have a material adverse impact on its business, financial position, results of operations or cash flows.
16. Variable Interest Entity
VIEs are entities with any of the following characteristics: (i) the entity does not have enough equity to finance its activities without additional financial support; (ii) the equity holders, as a group, lack the characteristics of a controlling financial interest; or (iii) the entity is structured with 
non-substantive
voting rights. The Company determined that AdvisorEngine has the characteristics of a VIE.
Consolidation of a VIE is required for the party deemed to be the primary beneficiary, if any. The primary beneficiary is the party who has both (a) the power to direct the activities of a VIE that most significantly impact the entity’s economic performance and (b) an obligation to absorb losses of the entity or a right to receive benefits from the entity that could potentially be significant to the entity. The Company is not the primary beneficiary of AdvisorEngine as it does not have the power to direct the activities that most significantly impact AdvisorEngine’s economic performance. Such power is conveyed through AdvisorEngine’s board of directors and the Company does not have control over the board.
The following table presents information about the Company’s variable interests in AdvisorEngine (a
non-consolidated
VIE):
 
June 30,
2019
   
December 31,
2018
 
Carrying Amount—Assets


Preferred stock
  $
25,000
    $
25,000
 
Unsecured non-convertible note receivable
   
29,935
     
28,722
 
Unsecured convertible note receivable
   
1,550
     
—  
 
                 
Total carrying amount—Assets
  $
56,485
    $
53,722
 
                 
Maximum exposure to loss
  $
56,485
    $
53,722
 
                 
17. Revenues from Contracts with Customers
The following table presents the Company’s total revenues from contracts with customers:
 
Three Months Ended
June 30,
   
Six Months Ended
June 30,
 
 
2019
   
2018
   
2019
   
2018
 
Revenues from contracts with customers:


Advisory fees
  $
65,627
    $
73,778
    $
130,467
    $
132,234
 
Other
   
666
     
997
     
1,311
     
1,445
 
                                 
Total operating revenues
  $
66,293
    $
74,775
    $
131,778
    $
133,679
 
                                 
The Company recognizes revenues from contracts with customers when the performance obligation is satisfied, which is when the promised goods or services are transferred to the customer. A good or service is considered to be transferred when the customer obtains control, which is represented by the transfer of rights with regard to the good or service. Transfer of control happens either over time or at a point in time. When a performance obligation is satisfied over time, an entity is required to select a single method of measuring progress for each performance obligation that depicts the entity’s performance in transferring control of goods or services to the customer.
Substantially all the Company’s revenues from contracts with customers are derived primarily from investment advisory agreements with related parties (See Note 18). These advisory fees are recognized over time, are earned from the Company’s ETPs and are calculated based on a percentage of the ETPs’ average daily net assets. There is no significant judgment in calculating amounts due which are invoiced monthly in arrears and are not subject to any potential reversal. Progress is measured using the practical expedient under the output method resulting in the recognition of revenue in the amount for which the Company has a right to invoice.
There are no contract assets or liabilities that arise in connection with the recognition of advisory fee revenue. In addition, there are no costs incurred to obtain or fulfill the contracts with customers, all of which are investment advisory agreements with related parties.
 
27
 
 
Table of Contents
 
See Note 18 for further information including disaggregation of advisory fee revenue and amounts due from customers, all of which are derived from related parties. Advisory fee revenues are also reported by segment as disclosed in Note 24.
18. Related Party Transactions
The Company’s revenues are derived primarily from investment advisory agreements with related parties. Under these agreements, the Company has licensed to related parties the use of certain of its own indexes for the U.S. and Canadian WisdomTree ETFs and WisdomTree UCITS ETFs. The Board of Trustees and Board of Directors (including certain officers of the Company) of the related parties are primarily responsible for overseeing the management and affairs of the entities for the benefit of their stakeholders and have contracted with the Company to provide for general management and administration services. The Company is also responsible for certain expenses of the related parties, including the cost of transfer agency, custody, fund administration and accounting, legal, audit, and other
non-distribution
services, excluding extraordinary expenses, taxes and certain other expenses, which is included in fund management and administration on the Company’s Consolidated Statements of Operations. In exchange, the Company receives fees based on a percentage of the ETFs’ average daily net assets. The advisory agreements may be terminated by the related parties upon notice.
The following table summarizes accounts receivable from related parties which are included as a component of accounts receivable on the Company’s Consolidated Balance Sheets:
 
June 30,
2019
   
December 31,
2018
 
Receivable from WTT
  $
13,920
    $
14,678
 
Receivable from ETFS Issuers
   
8,573
     
8,779
 
Receivable from BI and WTI
   
853
     
951
 
Receivable from WTAMC
   
196
     
167
 
Receivable from WTCS
   
80
     
95
 
                 
Total
  $
23,622
    $
24,670
 
                 
The following table summarizes revenues from advisory services provided to related parties:
 
Three Months Ended
June 30,
   
Six Months Ended
June 30,
 
 
2019
   
2018
   
2019
   
2018
 
Advisory services provided to WTT
  $
42,817
    $
52,591
    $
85,040
    $
107,792
 
Advisory services provided to ETFS Issuers
   
19,367
     
17,720
     
38,640
     
17,720
 
Advisory services provided to BI and WTI
   
2,583
     
2,724
     
5,087
     
5,351
 
Advisory services provided to WTAMC
   
607
     
403
     
1,153
     
715
 
Advisory services provided to WTCS
   
253
     
340
     
547
     
656
 
                                 
Total
  $
65,627
    $
73,778
    $
130,467
    $
132,234
 
                                 
The Company also has investments in certain WisdomTree ETFs of approximately $3,193 and $7,117 at June 30, 2019 and December 31, 2018, respectively. Gains and losses related to these ETFs during the three months ended June 30, 2019 and 2018 were ($205)​​​​​​​ and ($67), respectively, and during the six months ended June 30, 2019 and 2018 were $148 and ($
58
), respectively.
 
28
 
 
Table of Contents
 
19. Stock-Based Awards
On June 20, 2016, the Company’s stockholders approved a new equity award plan under which the Company can issue up to 10,000,000 shares of common stock (less one share for every share granted under prior plans since March 31, 2016 and inclusive of shares available under the prior plans as of March 31, 2016) in the form of stock options and other stock-based awards. The Company also has issued from time to time stock-based awards outside a plan.
The Company grants equity awards to employees and directors which include restricted stock awards (“RSAs”), restricted stock units (“RSUs”), performance-based restricted stock units (“PRSUs”) and stock options. Certain awards described below are subject to acceleration under certain conditions.
Stock options:
 
Generally issued for terms of ten years and may vest after at least one year of service and have an exercise price equal to the Company’s stock price on the grant date. The Company estimates the fair value of stock options (when granted) using the Black-Scholes option pricing model.
     
RSAs/RSUs:
 
Awards are valued based on the Company’s stock price on grant date and generally vest ratably over three years.
     
PRSUs:
 
These awards cliff vest three years from grant date and contain a market condition whereby the number of PRSUs ultimately vesting is tied to how the Company’s total shareholder return (“TSR”) compares to a peer group of other publicly traded asset managers over the three-year period. A Monte Carlo simulation is used to value these awards.


The number of PRSUs vesting ranges from 0% to 200% of the target number of PRSUs granted, as follows:
 
 
If the relative TSR is below the 25
th
percentile, then 0% of the target number of PRSUs granted will vest;
  If the relative TSR is at the 25
th
percentile, then 50% of the target number of PRSUs granted will vest; and
  If the relative TSR is above the 25
th
percentile, then linear scaling is applied such that the percent of the target number of PRSUs vesting is 100% at the 50
th
percentile and capped at 200% of the target number of PRSUs granted for performance at the 100
th
percentile.
Stock-based compensation during the three months ended June 30, 2019 and 2018 was $3,135 and $3,529, respectively, and during the six months ended June 30, 2019 and 2018 was $6,207 and $6,838, respectively.
A summary of unrecognized stock-based compensation expense and average remaining vesting period is as follows:
 
June 30, 2019
 
 
Unrecognized Stock-
Based
Compensation
   
Average
Remaining
Vesting Period
(Years)
 
Employees and directors
  $
21,078
     
2.16
 
A summary of stock-based compensation award activity during the three months ended June 30, 2019 is as follows:
 
Stock
Options
   
RSAs
   
RSUs
   
PRSUs
 
Balance at April 1, 2019
   
550,537
     
3,270,065
     
40,436
     
270,872
(1)
Granted


97,649


Exercised/vested


(105,319
)    


Forfeitures


(31,142
)    


Balance at June 30, 2019
   
550,537
     
3,231,253
     
40,436
     
270,872
(1)


(1) Represents the target number of PRSUs granted and outstanding. The number of PRSUs that ultimately vest ranges from 0% to 200% of this amount. A Monte Carlo simulation was used to value these awards using the following assumptions for the Company and the peer group: (i) beginning
90-day
average stock prices; (ii) valuation date stock prices; (iii) historical stock price volatilities ranging from 22% to 42% (average 28%); (iv) correlation coefficients based upon the price data used to calculate the historical volatilities; (v) a risk free interest rate of 2.56%; and (vi) an expected dividend yield of 0%.
 
29
 
 
Table of Contents
 
20. Earnings Per Share
The following tables set forth reconciliations of the basic and diluted earnings per share computations for the periods presented:
 
Three Months Ended
June 30,
   
Six Months Ended
June 30,
 
Basic Earnings per Share
 
2019
     
2018
   
2019
   
2018
 
Net income
  $
2,479
    $
16,724
    $
11,303
    $
26,148
 
Less: Income distributed to participating securities
   
(539
)    
(513
)    
(1,083
)    
(584
)
Less: Undistributed income allocable to participating securities


(1,101
)    
(117
)    
(999
)
                                 
Net income available to common stockholders
  $
1,940
    $
15,110
    $
10,103
    $
24,565
 
Weighted average common shares (in thousands)
   
151,818
     
149,056
     
151,722
     
142,230
 
                                 
Basic earnings per share
  $
0.01
    $
0.10
    $
0.07
    $
0.17


Three Months Ended
June 30,
   
Six Months Ended
June 30,
 
Diluted Earnings per Share
 
2019
   
2018
   
2019
   
2018
 
Net income
  $
2,479
    $
16,724
    $
11,303
    $
26,148
 
                                 
Weighted Average Diluted Shares (in thousands)
:


Weighted average common shares
   
151,818
     
149,056
     
151,722
     
142,230
 
Dilutive effect of common stock equivalents
   
15,431
     
14,290
     
15,133
     
7,749
 
                                 
Weighted average diluted shares
   
167,249
     
163,346
     
166,855
     
149,979
 
                                 
Diluted earnings per share
  $
0.01
    $
0.10
    $
0.07
    $
0.17
 
                                 
Diluted earnings per share is calculated under the treasury stock and
if-converted
method and the
two-class
method and reflects the reduction in earnings per share assuming options or other contracts to issue common stock were exercised or converted into common stock (if dilutive). The calculation that results in the most dilutive earnings per share amount for common stock is reported in the Company’s consolidated financial statements. The Company excluded 920,166 and 869,288 common stock equivalents from its computation of diluted earnings per share during the three months ended June 30, 2019 and 2018, respectively, and 1,239,431 and 1,140,659 common stock equivalents from its computation of diluted earnings per share during the six months ended June 30, 2019 and 2018, respectively, as they were determined to be anti-dilutive.
21. Income Taxes
Effective Income Tax Rate – Three and Six Months Ended June 30, 2019
The Company’s effective income tax rate during the three months ended June 30, 2019 of 59.1% resulted in income tax expense of $3,587. The Company’s effective income tax rate differs from the federal statutory tax rate of 21% primarily due to a valuation allowance on foreign net operating losses,
non-deductible
executive compensation, a
non-deductible
loss on revaluation of deferred consideration and state and local income taxes, partly offset by a lower tax rate on foreign earnings.
The Company’s effective income tax rate during the six months ended June 30, 2019 of 18.3% resulted in income tax expense of $2,538. The Company’s effective income tax rate differs from the federal statutory tax rate of 21% primarily due to a $4,309 reduction in unrecognized tax benefits, a lower tax rate on foreign earnings and a
non-taxable
gain on revaluation of deferred consideration, partly offset by a valuation allowance on foreign net operating losses, tax shortfalls associated with the vesting and exercise of stock-based compensation awards,
non-deductible
executive compensation and state and local income taxes.
Effective Income Tax Rate – Three and Six Months Ended June 30, 2018
The Company’s effective income tax rate during the three and six months ended June 30, 2018 of 24.6% and 27.6%, respectively, resulted in income tax expense of $5,460 and $9,958, respectively. The Company’s effective income tax rate differs from the federal statutory tax rate of 21% primarily due to
non-deductible
acquisition-related costs, a valuation allowance on foreign net operating losses and state and local income taxes, partly offset by a
non-taxable
gain on revaluation of deferred consideration and a lower tax rate on foreign earnings.
 
30
 
 
Table of Contents
 
Deferred Tax Assets
A summary of the components of the Company’s deferred tax assets at June 30, 2019 and December 31, 2018 are as follows:
 
June 30,
2019
   
December 31,
2018
 
Deferred tax assets:
   
   
NOLs – International
  $
8,992
    $
6,605
 
Accrued expenses
   
1,837
     
2,699
 
Goodwill and intangible assets
   
1,746
     
1,841
 
Stock-based compensation
   
1,189
     
2,673
 
Net lease liability
   
1,160
     
1,184
 
Capital losses
   
794
     
794
 
NOLs – U.S.
   
635
     
762
 
Other
   
272
     
40
 
                 
Deferred tax assets
   
16,625
     
16,598
 
                 
Deferred tax liabilities:
   
   
Fixed assets and prepaid assets
   
1,480
     
1,433
 
Unrealized gains
   
760
     
724
 
                 
Deferred tax liabilities
   
2,240
     
2,157
 
                 
Total deferred tax assets less deferred tax liabilities
   
14,385
     
14,441
 
Less: valuation allowance
   
(9,786
)    
(7,399
)
                 
Deferred tax assets, net
  $
4,599
    $
7,042
 
                 
Net Operating Losses – U.S
.
The Company’s tax effected federal net operating losses (“NOLs”) at June 30, 2019 were $635 which expire in 2024. The net operating loss carryforwards have been reduced by the impact of annual limitations described in Internal Revenue Code Section 382 that arose as a result of an ownership change.
The Company’s tax effected capital losses at June 30, 2019 was $794. A full valuation allowance was established as it is
more-likely-than-not
that the deferred tax assets will not be realized.
Net Operating Losses – International
Certain of the Company’s European subsidiaries and its Canadian subsidiary generated NOLs outside the U.S. These tax effected NOLs were $8,992 and $6,605 at June 30, 2019 and December 31, 2018, respectively. The Company established a full valuation allowance related to these NOLs as it is
more-likely-than-not
that the deferred tax assets will not be realized. Approximately $4,315 of these NOLs at June 30, 2019 expire between 2036 and 2039. The remainder is carried forward indefinitely.
Uncertain Tax Positions
Tax positions are evaluated utilizing a
two-step
process. The Company first determines whether any of its tax positions are more-
likely-than-not
to be sustained upon examination, based solely on the technical merits of the position. Once it is determined that a position meets this recognition threshold, the position is measured as the largest amount of benefit that is greater than 50% likely of being realized upon ultimate settlement.
In connection with the ETFS Acquisition, the Company accrued a liability for uncertain tax positions and interest and penalties at the acquisition date. The table below sets forth the aggregate changes in the balance of these gross unrecognized tax benefits during the three and six months ended June 30, 2019:
 
31
 
 
Table of Contents
  
 
Total
   
Unrecognized
Tax Benefits
   
Interest 
and
Penalties
 
Balance on January 1, 2019
  $
34,876
    $
28,101
    $
6,775
 
Decrease—Lapse of statute of limitations
   
(4,309
)    
(2,999
)    
(1,310
)
Increases
   
101
     
—  
     
101
 
Foreign currency translation
(1)
   
925
     
745
     
180
 
                         
Balance at March 31, 2019
  $
31,593
    $
25,847
    $
5,746
 
Increases
   
101
     
—  
     
101
 
Foreign currency translation
(1)
   
(817
)    
(668
)    
(149
)
                         
Balance at June 30, 2019
  $
30,877
    $
25,179
    $
5,698


(1) The gross unrecognized tax benefits were accrued in British pounds sterling.
The Company also recorded an offsetting indemnification asset provided by ETFS Capital as part of its agreement to indemnify the Company for any potential claims, for which an amount is being held in escrow. ETFS Capital has also agreed to provide additional collateral by maintaining a minimum working capital balance up to a stipulated amount. The decrease resulting from the lapsing of the statute of limitations of $4,309, was recorded as an income tax benefit and an equal and offsetting amount to reduce the indemnification asset was recorded in other losses, net, during the six months ended June 30, 2019.
The gross unrecognized tax benefits and interest and penalties totaling $30,877 and $34,876 at June 30, 2019 and December 31, 2018, respectively, are included in other
non-current
liabilities on the Consolidated Balance Sheet. It is expected that the amount of unrecognized tax benefits will change in the next 12 months; however, the Company does not expect the change to have a material impact on its consolidated financial statements.
At June 30, 2019, there were $25,179 of unrecognized tax benefits that, if recognized, would impact the effective tax rate. The recognition of any unrecognized tax benefits would result in an equal and offsetting adjustment to the indemnification asset which would be recorded in income before taxes due to the indemnity for any potential claims.
Income Tax Examinations
The Company is subject to U.S. federal income tax as well as income tax of multiple state, local and certain foreign jurisdictions. The Company’s federal tax return and ManJer’s tax return (a Jersey-based subsidiary) for the year ended December 31, 2016 are currently under review by the relevant tax authorities. The Company is indemnified by ETFS Capital for any potential exposure associated with ManJer’s tax return under audit.
The Company is not currently under audit in any other income tax jurisdictions. As of June 30, 2019, with few exceptions, the Company was no longer subject to income tax examinations by any taxing authority for years before 2015.
Undistributed Earnings of Foreign Subsidiaries
The Company recognizes deferred tax liabilities for withholding taxes that may become payable, where applicable, upon the distribution of earnings and profits from foreign subsidiaries unless considered permanent in duration. As of June 30, 2019, the Company considers all undistributed foreign earnings and profits to be permanent in duration.
22. Shares Repurchased
On April 24, 2019, the Company’s Board of Directors extended the term of the Company’s share repurchase program for three years through April 27, 2022. Included under this program are purchases to offset future equity grants made under the Company’s equity plans and purchases made in open market or privately negotiated transactions. This authority may be exercised from time to time, subject to the terms of the credit agreement described below and regulatory considerations. The timing and actual number of shares repurchased will depend on a variety of factors including price, corporate and regulatory requirements, market conditions and other corporate liquidity requirements and priorities. The repurchase program may be suspended or terminated at any time without prior notice. Shares repurchased under this program are returned to the status of authorized and unissued on the Company’s books and records.
As more fully disclosed in Note 3, the Company completed the ETFS Acquisition on April 11, 2018. To partially finance the acquisition, the Company entered into a credit agreement which contains customary negative covenants, including, among others, a covenant which may restrict the Company’s ability to repurchase equity interests. Share repurchases only are permitted to the extent the Total Leverage Ratio (as defined in the credit agreement) does not exceed
1.75
to
1.00
and no event of default (as defined in the credit agreement) has occurred and is continuing at the time the share repurchase is made. However, the Company’s ability to purchase shares of its common stock withheld pursuant to the terms of equity awards granted to employees to satisfy tax withholding obligations is not restricted.
 
32


Table of Contents
 
During the three and six months ended June 30, 2019, the Company repurchased 14,065 shares and 325,278 shares of its common stock, respectively, under this program for an aggregate cost of $102 and $2,107, respectively.
During the three and six months ended June 30, 2018, the Company repurchased 26,717 shares and 87,225 shares of its common stock, respectively, under this program for an aggregate cost of $272 and $1,006, respectively.
As of June 30, 2019, $83,622 remained under this program for future purchases.
23. Goodwill and Intangible Assets
Goodwill
The table below sets forth goodwill by reporting unit. Goodwill allocated to the U.S. Business reporting unit is tested annually for impairment on April 30
th
. Goodwill allocated to the European Business reporting unit is tested annually for impairment on November 30
th
.
                         
 
Reporting Unit


European
Business
(1)
   
U.S.
 Business
   
Total
 
Balance at January 1, 2019
  $
84,057
    $
1,799
    $
85,856
 
Changes


—  
 
                         
Balance at June 30, 2019
  $
84,057
    $
1,799
    $
85,856


(1) The European Business is included in the Company’s International Business reportable segment.


The goodwill allocated to the European Business reporting unit is not deductible for tax purposes as the transaction was structured as a stock acquisition occurring in the United Kingdom. The goodwill allocated to the U.S. Business reporting unit is deductible for tax purposes.
Goodwill allocated to the U.S. Business reporting unit was tested for impairment on April 30, 2019. The fair value of the reporting unit exceeded its carrying value and therefore
no
impairment was recognized.
Intangible Assets (Indefinite-Lived)
                         
 
Advisory
Agreements
(ETFS)
   
Advisory
Agreements
(Questrade
 AUM)
   
Total
 
Balance at January 1, 2019
  $
601,247
    $
1,962
    $
603,209
 
Foreign currency translation
   
—  
     
82
     
82
 
                         
Balance at June 30, 2019
  $
601,247
    $
2,044
    $
603,291


ETFS
In connection with the ETFS Acquisition which was completed on April 11, 2018 (see Note 3), the Company identified intangible assets valued at $601,247 related to the right to manage AUM through customary advisory agreements. The fair value of the intangible assets was determined using an income approach (discounted cash flow analysis) which relied upon significant unobservable inputs including a revenue growth multiple of 3% to 4% and a weighted average cost of capital of 11.6%. The intangible assets were determined to have indefinite useful lives and are not deductible for tax purposes. The Company has designated November 30
th
as its annual impairment testing date for these intangible assets.
Questrade ETFs
During the fourth quarter of
2017
, the Company acquired
eight
Canadian-listed ETFs from Questrade, Inc. (the “Questrade ETFs”). The entire purchase price was allocated to the Company’s right to manage AUM in the form of advisory contracts. These intangible assets are translated based on the end of period exchange rates from local currency to U.S. dollars.
Most of the Questrade ETFs were merged into the Company’s existing Canadian-listed ETFs. The intangible assets (which are deductible for tax purposes) were determined to have an indefinite useful life. The Company has designated November 30
th
as its annual impairment testing date for these intangible assets.
 
33
 
 
Table of Contents
 
24. Segment Reporting
The Company operates as an ETP sponsor and asset manager providing investment advisory services globally. These activities are reported in the Company’s U.S. Business and International Business reportable segments. The U.S. Business segment includes the results of the Company’s U.S. operations and wind down costs associated with the Japan sales office. The results of the Company’s European and Canadian operations are reported as the International Business segment.
Information concerning these reportable segments are as follows:
                                 
 
Three Months Ended
 June 30,
   
Six Months Ended
 June 30,
 
 
2019
   
2018
   
2019
   
2018
 
U.S. Business Segment


Operating revenues


Advisory fees
  $
43,070
    $
52,931
    $
85,587
    $
108,449
 
Other income
   
76
     
162
     
182
     
309
 
                                 
Total operating revenues
  $
43,146
    $
53,093
    $
85,769
    $
108,758
 
                                 
Total operating expenses
  $
(36,407
)   $
(42,638
)   $
(73,583
)   $
(81,668
)
                                 
Other income/(expenses)


Interest expense
  $
(194
)   $
(173
)   $
(386
)   $
(173
)
Interest income
   
818
     
612
     
1,597
     
1,574
 
Impairment
   
—  
     
—  
     
(572
)    
 
Other gains and losses, net
   
(54
)    
(66
)    
91
     
(292
)
                                 
Total other income
  $
570
    $
373
    $
730
    $
1,109
 
                                 
Total income before income taxes (U.S. Business Segment)
  $
7,309
    $
10,828
    $
12,916
    $
28,199
 
                                 
International Business Segment
(1)


Operating revenues


Advisory fees
  $
22,557
    $
20,847
    $
44,880
    $
23,785
 
Other income
   
590
     
835
     
1,129
     
1,136
 
                                 
Total operating revenues
  $
23,147
    $
21,682
    $
46,009
    $
24,921
 
                                 
Total operating expenses
  $
(17,975
)   $
(17,606
)   $
(35,601
)   $
(24,259
)
                                 
Other income/(expenses)


Interest expense
  $
(2,716
)   $
(2,183
)   $
(5,416
)   $
(2,183
)
(Loss)/gain on revaluation of deferred consideration
   
(4,037
)    
9,898
     
367
     
9,898
 
Other gains and losses, net
   
338
     
(435
)    
(4,434
)    
(470
)
                                 
Total other income/(expenses)
  $
(6,415
)   $
7,280
    $
(9,483
)   $
7,245
 
                                 
Total (loss)/income before income taxes (International Business Segment)
  $
(1,243
)   $
11,356
    $
925
    $
7,907
 
                                 
Income/(loss) before income taxes


U.S. Business segment
  $
7,309
    $
10,828
    $
12,916
    $
28,199
 
International Business segment
   
(1,243
)    
11,356
     
925
     
7,907
 
                                 
Total income before income taxes
 
$
6,066
   
$
22,184
   
$
13,841
   
$
36,106


Assets are not reported by segment as such information is not utilized by the chief operating decision maker.
 
 
(1) The financial results of ETFS are included in the International Business reportable segment as of April 11, 2018.


34
 
 
Table of Contents
 
 
25. Subsequent Events
The Company evaluated subsequent events through the date of issuance of the accompanying consolidated financial statements. There were no events requiring disclosure.
 
35


Table of Contents
 
ITEM 2. MANAGEMENT’S DISCUSSION AND ANALYSIS OF FINANCIAL CONDITION AND RESULTS OF OPERATIONS
The following discussion and analysis of our financial condition and results of operations should be read together with our consolidated financial statements and the related notes and the other financial information included elsewhere in this Report. In addition to historical consolidated financial information, the following discussion contains forward-looking statements that reflect our plans, estimates and beliefs. Our actual results could differ materially from those discussed in the forward-looking statements. Factors that could cause or contribute to these differences include those discussed below. For a more complete description of the risks noted above and other risks that could cause our actual results to materially differ from our current expectations, please see Item 1A “Risk Factors” in our Annual Report on Form
10-K
for the fiscal year ended December 31, 2018. We assume no obligation to update or revise publicly any forward-looking statements, whether as a result of new information, future events or otherwise, unless required by law.
Executive Summary
Introduction
We are the only publicly-traded asset management company that focuses exclusively on exchange-traded products, or ETPs, and are one of the leading ETP sponsors in the world based on assets under management, or AUM, with AUM of $60.4 billion globally as of June 30, 2019. An ETP is a pooled investment vehicle that holds a basket of securities, financial instruments or other assets and generally seeks to track (index-based) or outperform (actively managed) the performance of a broad or specific equity, fixed income or alternatives market segment, commodity or currency (or an inverse or multiple thereof). ETPs are listed on an exchange with their shares traded in the secondary market at market prices, generally at approximately the same price as the net asset value of their underlying components. ETP is an umbrella term that includes exchange-traded funds, or ETFs, exchange-traded notes and exchange-traded commodities.
We focus on creating ETFs for investors that offer thoughtful innovation, smart engineering and redefined investing. We have launched many
first-to-market
ETFs in the United States and pioneered alternative weighting and performance methods commonly referred to as “smart beta.” However, our U.S. listed ETFs are not beta, but rather an investment innovation we call “Modern Alpha.” Our Modern Alpha approach combines the outperformance potential of active management with the benefits of passive management to offer investors cost-effective ETFs that are built to perform.
Through our operating subsidiaries, we provide investment advisory and other management services to our ETPs collectively offering ETPs covering equity, commodity, fixed income, leveraged and inverse, currency and alternative strategies. In exchange for providing these services, we receive advisory fee revenues based on a percentage of the ETPs’ average daily AUM. Our expenses are predominantly related to selling, operating and marketing our ETPs. We have contracted with third parties to provide certain operational services for the ETPs. We distribute our ETPs through all major channels within the asset management industry, including brokerage firms, registered investment advisers, institutional investors, private wealth managers and discount brokers primarily through our sales force. Our sales efforts are not directed towards the retail segment but rather are directed towards financial or investment advisers that act as intermediaries between the
end-client
and us.
We strive to deliver a better investing experience through innovative solutions. Continued investments in technology-enabled services and the launch of our Advisor Solutions program in October 2017, which includes portfolio construction, asset allocation, practice management services and wealth management technology, have been made to differentiate us in the market, expand our distribution and further enhance our relationships with financial advisors.
We were incorporated under the laws of the state of Delaware on September 19, 1985 as Financial Data Systems, Inc.
Acquisition of ETFS
In April 2018, we acquired the European exchange-traded commodity, currency and
short-and-leveraged
business of ETFS Capital Limited, or ETFS Capital. Throughout this Report, we refer to the acquired business as ETFS and the acquisition as the ETFS Acquisition. Following the ETFS Acquisition we became the largest global independent ETP provider based on AUM, with significant scale and presence in the U.S. and Europe, the two largest ETP markets.
Our operating results for the prior periods reported in this Report are not directly comparable to the current periods as the ETFS Acquisition was completed on April 11, 2018.
 
36
 
 
Table of Contents
 
Industry Developments
On June 5, 2019, the SEC adopted Regulation Best Interest, which requires broker-dealers to act in the best interest of their retail customers when making a recommendation. The SEC also adopted the Form CRS relationship summary, which requires registered investment advisers and broker-dealers to deliver to retail investors a succinct, plain English summary about the relationship and services provided by the firm and the required standard of conduct associated with the relationship and services. Regulation Best Interest, Form CRS and the related rule will become effective 60 days after their publication in the Federal Register. The compliance date for both rules is June 30, 2020. Congress and individual state legislatures have continued to debate, and in some instances taken further action, in seeking to ensure heightened standards. We believe that the increased focus on fiduciary and best interest standards will continue to raise investor awareness of the benefits that ETFs provide – transparency, tax efficiency and liquidity – which we believe will expand ETFs’ competitiveness generally.
Assets Under Management
WisdomTree ETPs
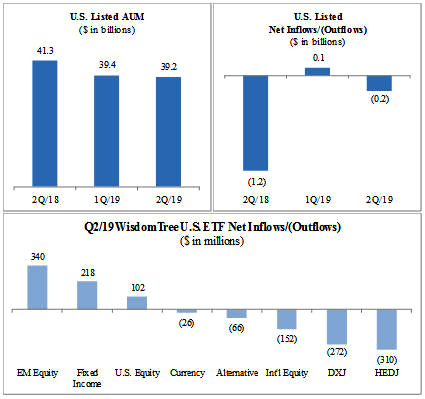
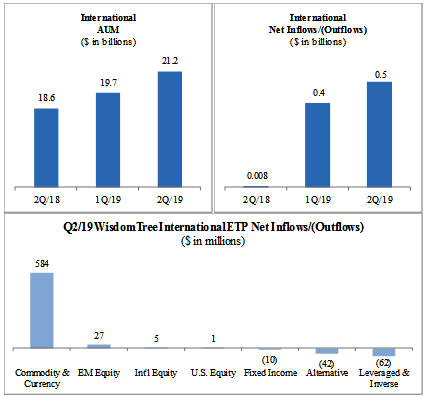
The chart below sets forth the asset mix of our ETPs at June 30, 2018, March 31, 2019 and June 30, 2019:


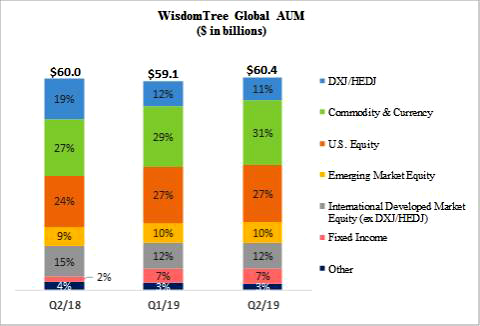
Over the last few years, concentrations in HEDJ, our European equity ETF which hedges exposure to the euro, and DXJ, our Japanese equity ETF which hedges exposure to the yen, have declined dramatically as negative investor sentiment toward these products has led to considerable net outflows. Recently, these outflows have largely been offset by strong inflows into our fixed income, U.S. equity and emerging markets products. In addition, the ETFS Acquisition has further diversified our investment theme concentrations by adding commodity exposures, predominantly gold.
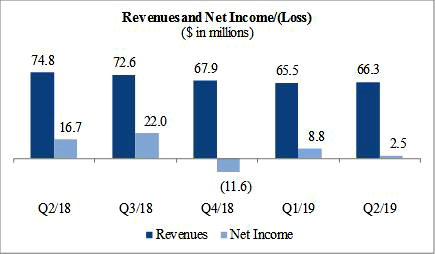
Market Environment
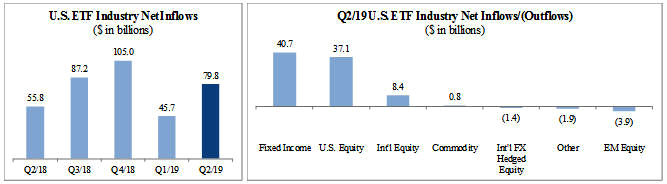
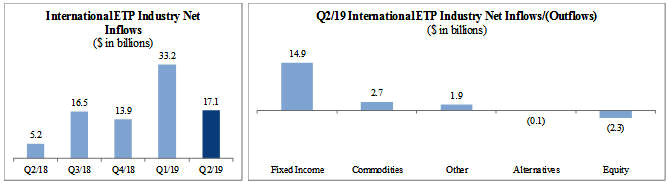
During the second quarter of 2019, U.S. and European markets experienced bouts of volatility and ultimately performed favorably as a result of accommodative monetary policies and continued progress in the U.S. and China trade dispute. Emerging markets were largely unchanged as a result of global trade uncertainties, while the Japanese markets suffered as the yen strengthened during the quarter. In addition, gold advanced as a result of geopolitical issues, a weakening U.S. dollar and a declining interest rate environment during the quarter.
The S&P 500 rose 4.3%, MSCI EAFE (local currency) rose 3.1%, MSCI Emerging Markets Index (U.S. dollar) rose 0.8% and gold prices rose 8.8% during the second quarter of 2019. In addition, the European equity market appreciated with the MSCI EMU Index rising 4.9%, while the Japanese equity market depreciated with the MSCI Japan Index declining 1.6%, both in local currency terms for the quarter. Also, the U.S. dollar weakened 2.7% versus the yen and 1.4% versus the euro during the quarter.
 
37
 
 
Table of Contents
 
U.S. listed ETF Industry Flows
As the charts below reflect, U.S. listed ETF net flows for the three months ended June 30, 2019 were $79.8 billion. Fixed income, U.S equity and international equity gathered the majority of those flows.
 
 
Source: Bloomberg, Investment Company Institute, WisdomTree
International ETP Industry Flows
As the charts below reflect, international ETP net flows were $17.1 billion for the three months ended June 30, 2019. Fixed income and commodities gathered the majority of those flows.
 
 
Source: Morningstar


Business Segments
We operate as an ETP sponsor and asset manager providing investment advisory services globally. These activities are reported in our U.S. Business and International Business segments.
U.S. Business Segment
Our U.S. Business segment included our Japan sales office, WTJ, which engaged in selling our U.S. listed ETFs to Japanese institutions. In July 2018, we determined to restructure our distribution strategy in Japan and expanded our existing relationship with Premia Partners Company Limited to manage distribution of our ETFs in Japan. As a result, WTJ has ceased operations and is in the process of being liquidated. WTJ reported operating losses for the three months ended June 30, 2019 and 2018 of $0.04 million and $1.1 million, respectively, and for the six months ended June 30, 2019 and 2018 of $0.5 million and $2.4 million, respectively. WTJ also recognized an impairment expense of $0.6 million in connection with the termination of its office lease during the six months ended June 30, 2019.
International Business Segment
The International Business segment includes our European business and our Canadian business.
 
38
 
 
Table of Contents
 
Our Operating and Financial Results
U.S. Business Segment
Our U.S. listed ETFs’ AUM was $39.2 billion at June 30, 2019, essentially unchanged from March 31, 2019.
 
 
International Business Segment
 
Our international ETPs’ AUM increased from $19.7 billion at March 31, 2019 to $21.2 billion at June 30, 2019 due to market appreciation and net inflows.


39
 
 
Table of Contents
 
Consolidated Operating Results
The following table sets forth our revenues and net income for the most recent five quarters.    


Revenues
– We recorded operating revenues of $66.3 million during the three months ended June 30, 2019, down 11.3% from the three months ended June 30, 2018 primarily due to lower average AUM of our U.S. Business segment, partly offset by higher average AUM of our International Business segment as well as the recognition of a full quarter of revenues from ETFS.


Expenses
– Total operating expenses decreased 9.7% from the three months ended June 30, 2018 to $54.4 million primarily due to lower acquisition-related costs.


Other Income/(Expenses)
– Other income/(expenses) includes interest income and interest expense, gains/(losses) on revaluation of deferred consideration – gold payments, impairment and other gains and losses. For the three months ended June 30, 2018 and June 30, 2019, the gains/(losses) on revaluation of deferred consideration – gold payments were $9.9 million and ($4.0) million, respectively.


Net income
– Net income decreased 85.2% from the three months ended June 30, 2018 to $2.5 million, which was impacted by the changes in revenues and expenses described above as well as a change in the (loss)/gain on revaluation of deferred consideration – gold payments of ($13.9) million.


40


Table of Contents
 
Key Operating Statistics
The following table presents key operating statistics that serve as indicators for the performance of our business:
                                         
 
Three Months Ended
   
Six Months Ended
 
 
June 30,
2019
   
March 31,
2019
   
June 30,
2018
   
June 30,
2019
   
June 30,
2018
 
GLOBAL ETPs (in millions)


Beginning of period assets
  $
59,112
    $
54,094
    $
44,962
    $
54,094
    $
48,937
 
Assets acquired
   
—  
     
—  
     
17,641
     
—  
     
17,641
 
Inflows/(outflows)
   
337
     
561
     
(1,223
)    
898
     
(3,442
)
Market appreciation/(depreciation)
   
938
     
4,544
     
(1,402
)    
5,482
     
(3,104
)
Fund closures
   
—  
     
(87
)    
(9
)    
(87
)    
(63
)
                                         
End of period assets
  $
60,387
    $
59,112
    $
59,969
    $
60,387
    $
59,969
 
                                         
Average assets during the period
  $
58,569
    $
57,683
    $
61,301
    $
58,126
    $
54,512
 
Average ETP advisory fee during the period
   
0.45
%    
0.46
%    
0.48
%    
0.45
%    
0.49
%
Revenue days
   
91
     
90
     
91
     
181
     
181
 
Number of ETPs—end of period
   
536
     
534
     
526
     
457
     
526
 
U.S. LISTED ETFs (in millions)


Beginning of period assets
  $
39,366
    $
35,486
    $
42,886
    $
35,486
    $
46,827
 
Inflows/(outflows)
   
(166
)    
147
     
(1,231
)    
(19
)    
(3,397
)
Market appreciation/(depreciation)
   
20
     
3,820
     
(306
)    
3,840
     
(2,027
)
Fund closures
   
—  
     
(87
)    
(9
)    
(87
)    
(63
)
                                         
End of period assets
  $
39,220
    $
39,366
    $
41,340
    $
39,220
    $
41,340
 
                                         
Average assets during the period
  $
38,945
    $
38,061
    $
43,464
    $
38,503
    $
44,541
 
Average ETF advisory fee during the period
   
0.44
%    
0.45
%    
0.49
%    
0.45
%    
0.49
%
Number of ETFs – end of the period
   
79
     
77
     
81
     
79
     
81
 
INTERNATIONAL LISTED ETPs (in millions)


Beginning of period assets
  $
19,746
    $
18,608
    $
2,076
    $
18,608
    $
2,110
 
Assets acquired
   
—  
     
—  
     
17,641
     
—  
     
17,641
 
Inflows/(outflows)
   
503
     
414
     
8
     
917
     
(45
)
Market appreciation/(depreciation)
   
918
     
724
     
(1,096
)    
1,642
     
(1,077
)
                                         
End of period assets
  $
21,167
    $
19,746
    $
18,629
    $
21,167
    $
18,629
 
                                         
Average assets during the period
  $
19,624
    $
19,622
    $
17,837
    $
19,623
    $
9,971
 
Average ETP advisory fee during the period
   
0.46
%    
0.47
%    
0.47
%    
0.47
%    
0.48
%
Number of ETPs—end of period
   
457
     
457
     
445
     
457
     
445
 
PRODUCT CATEGORIES (in millions)


Commodity & Currency


Beginning of period assets
  $
17,015
    $
16,251
    $
399
    $
16,251
    $
427
 
Assets acquired
   
—  
     
—  
     
16,778
     
—  
     
16,778
 
Inflows/(outflows)
   
558
     
227
     
(77
)    
785
     
(103
)
Market appreciation/(depreciation)
   
905
     
537
     
(945
)    
1,442
     
(947
)
                                         
End of period assets
  $
18,478
    $
17,015
    $
16,155
    $
18,478
    $
16,155
 
                                         
Average assets during the period
  $
16,940
    $
17,033
    $
15,301
    $
16,987
    $
7,855
 
U.S. Equity


Beginning of period assets
  $
15,880
    $
13,334
    $
13,359
    $
13,334
    $
14,234
 
Inflows/(outflows)
   
103
     
632
     
114
     
735
     
160
 
Market appreciation/(depreciation)
   
38
     
1,914
     
828
     
1,952
     
(93
)
                                         
End of period assets
  $
16,021
    $
15,880
    $
14,301
    $
16,021
    $
14,301
 
                                         
Average assets during the period
  $
15,807
    $
14,947
    $
14,021
    $
15,377
    $
14,071
 
International Developed Market Equity


Beginning of period assets
  $
14,417
    $
14,532
    $
22,287
    $
14,532
    $
25,836
 
Inflows/(outflows)
   
(729
)    
(1,553
)    
(1,466
)    
(2,282
)    
(4,215
)
Market appreciation/(depreciation)
   
1
     
1,438
     
(604
)    
1,439
     
(1,404
)
                                         
End of period assets
  $
13,689
    $
14,417
    $
20,217
    $
13,689
    $
20,217
 
                                         
Average assets during the period
  $
13,960
    $
14,521
    $
22,319
    $
14,241
    $
23,307
 
 
41
 
 
Table of Contents


Three Months Ended
   
Six Months Ended
 
 
June 30,
2019
   
March 31,
2019
   
June 30,
2018
   
June 30,
2019
   
June 30,
2018
 
Emerging Market Equity


Beginning of period assets
  $
5,730
    $
5,278
    $
6,289
    $
5,278
    $
5,887
 
Inflows/(outflows)
   
367
     
(84
)    
(119
)    
283
     
304
 
Market appreciation/(depreciation)
   
(7
)    
536
     
(527
)    
529
     
(548
)
                                         
End of period assets
  $
6,090
    $
5,730
    $
5,643
    $
6,090
    $
5,643
 
                                         
Average assets during the period
  $
5,785
    $
5,502
    $
6,116
    $
5,643
    $
6,187
 
Fixed Income


Beginning of period assets
  $
4,023
    $
2,570
    $
1,083
    $
2,570
    $
844
 
Inflows/(outflows)
   
208
     
1,418
     
349
     
1,626
     
601
 
Market appreciation/(depreciation)
   
26
     
35
     
(32
)    
61
     
(45
)
                                         
End of period assets
  $
4,257
    $
4,023
    $
1,400
    $
4,257
    $
1,400
 
                                         
Average assets during the period
  $
4,119
    $
3,511
    $
1,219
    $
3,815
    $
1,106
 
Leveraged & Inverse


Beginning of period assets
  $
1,419
    $
1,282
    $
872
    $
1,282
    $
930
 
Assets acquired
   
—  
     
—  
     
863
     
—  
     
863
 
Inflows/(outflows)
   
(62
)    
67
     
(62
)    
5
     
(195
)
Market appreciation/(depreciation)
   
(19
)    
70
     
(142
)    
51
     
(67
)
                                         
End of period assets
  $
1,338
    $
1,419
    $
1,531
    $
1,338
    $
1,531
 
                                         
Average assets during the period
  $
1,384
    $
1,408
    $
1,593
    $
1,396
    $
1,235
 
Alternatives


Beginning of period assets
  $
628
    $
755
    $
492
    $
755
    $
582
 
Inflows/(outflows)
   
(108
)    
(141
)    
66
     
(249
)    
(4
)
Market appreciation/(depreciation)
   
(6
)    
14
     
20
     
8
     
—  
 
                                         
End of period assets
  $
514
    $
628
    $
578
    $
514
    $
578
 
                                         
Average assets during the period
  $
574
    $
666
    $
564
    $
620
    $
555
 
Closed ETPs


Beginning of period assets
  $
—  
    $
92
    $
181
    $
92
    $
197
 
Inflows/(outflows)
   
—  
     
(5
)    
(28
)    
(5
)    
10
 
Market appreciation/(depreciation)
   
—  
     
—  
     
—  
     
—  
     
—  
 
Fund closures
   
—  
     
(87
)    
(9
)    
(87
)    
(63
)
                                         
End of period assets
  $
—  
    $
—  
    $
144
    $
—  
    $
144
 
                                         
Average assets during the period
  $
—  
    $
95
    $
168
    $
47
    $
196
 
Headcount: U.S. Business Segment
   
143
     
141
     
155
     
143
     
155
 
Headcount: International Business Segment
   
71
     
75
     
76
     
71
     
76
 
Note: Previously issued statistics may be restated due to fund closures and trade adjustments
Source: WisdomTree
 
42
 
 
Table of Contents
 
Three Months Ended June 30, 2019 Compared to Three Months Ended June 30, 2018
Selected Operating and Financial Information
                                 
 
Three Months Ended
June 30,
   
Change
   
Percent
Change
 
 
2019
   
2018
 
Global AUM (in millions)


Average global AUM
  $
58,569
    $
61,301
    $
(2,732
)    
(4.4
%)
                                 
Operating Revenues (in thousands)


Advisory fees
  $
65,627
    $
73,778
    $
(8,151
)    
(11.0
%)
Other income
   
666
     
997
     
(331
)    
(33.2
%)
                                 
Total revenues
  $
66,293
    $
74,775
    $
(8,482
)    
(11.3
%)
                                 
Average Global AUM
Our average global AUM decreased 4.4% from $61.3 billion at June 30, 2018 to $58.6 billion at June 30, 2019 primarily due to outflows from HEDJ and DXJ, largely offset by net inflows into our fixed income, U.S. equity and commodity ETPs and market appreciation.
Operating Revenues
Advisory fees
Advisory fee revenues decreased 11.0% from $73.8 million during the three months ended June 30, 2018 to $65.6 million in the comparable period in 2019 due to lower average AUM of our U.S. Business segment, partly offset by higher average AUM of our International Business segment as well as the recognition of a full quarter of revenues from ETFS. Our average global ETP advisory fee declined 3 basis points, from 0.48% during the three months ended June 30, 2018 to 0.45% during the three months ended June 30, 2019 primarily due to a change in product mix in our U.S. Business segment.
Other income
Other income decreased 33.2% from $1.0 million during the three months ended June 30, 2018 to $0.7 million in the comparable period in 2019 primarily due to lower creation/redemption fees of our International Business segment.
Operating Expenses
                                 
 
Three Months Ended
June 30,
   
Change
   
Percent
Change
 
(in thousands)
 
2019
   
2018
 
Compensation and benefits
  $
21,300
    $
19,301
    $
1,999
     
10.4
%
Fund management and administration
   
15,576
     
14,621
     
955
     
6.5
%
Marketing and advertising
   
2,910
     
3,778
     
(868
)    
(23.0
%)
Sales and business development
   
4,171
     
4,503
     
(332
)    
(7.4
%)
Contractual gold payments
   
3,110
     
2,715
     
395
     
14.5
%
Professional and consulting fees
   
1,296
     
1,560
     
(264
)    
(16.9
%)
Occupancy, communications and equipment
   
1,548
     
1,574
     
(26
)    
(1.7
%)
Depreciation and amortization
   
264
     
337
     
(73
)    
(21.7
%)
Third-party distribution fees
   
1,919
     
1,666
     
253
     
15.2
%
Acquisition-related costs
   
33
     
7,928
     
(7,895
)    
(99.6
%)
Other
   
2,255
     
2,261
     
(6
)    
(0.3
%)
                                 
Total expenses
  $
54,382
    $
60,244
    $
(5,862
)    
(9.7
%)


Three Months Ended
June 30,
 
As a Percent of Revenues:
 
2019
   
2018
 
Compensation and benefits
   
32.1
%    
25.8
%
Fund management and administration
   
23.5
%    
19.6
%
Marketing and advertising
   
4.4
%    
5.1
%
Sales and business development
   
6.3
%    
6.0
%
 
43
 
 
Table of Contents


Three Months Ended
June 30,
 
As a Percent of Revenues:
 
2019
   
2018
 
Contractual gold payments
   
4.7
%    
3.6
%
Professional and consulting fees
   
1.9
%    
2.1
%
Occupancy, communications and equipment
   
2.3
%    
2.1
%
Depreciation and amortization
   
0.4
%    
0.5
%
Third-party distribution fees
   
2.9
%    
2.2
%
Acquisition-related costs
   
0.1
%    
10.6
%
Other
   
3.4
%    
3.0
%
                 
Total expenses
   
82.0
%    
80.6
%
                 
Compensation and benefits
Compensation and benefits expense increased 10.4% from $19.3 million during the three months ended June 30, 2018 to $21.3 million in the comparable period in 2019 due to severance expense of $1.5 million and higher incentive compensation. Headcount of our U.S. Business segment was 155 and our International Business segment was 76 at June 30, 2018 compared to 143 and 71, respectively, at June 30, 2019.
Fund management and administration
Fund management and administration expense increased 6.5% from $14.6 million during the three months ended June 30, 2018 to $15.6 million in the comparable period in 2019 due to the recognition of a full quarter of expense from ETFS, partly offset by lower average AUM of our U.S. Business segment. We had 81 U.S. listed ETFs and 445 International listed ETPs at June 30, 2018 compared to 79 U.S. listed ETFs and 457 International listed ETPs at June 30, 2019.
Marketing and advertising
Marketing and advertising expense decreased 23.0% from $3.8 million during the three months ended June 30, 2018 to $2.9 million in the comparable period in 2019 due to lower global spending.
Sales and business development
Sales and business development expense decreased 7.4% from $4.5 million during the three months ended June 30, 2018 to $4.2 million in the comparable period in 2019 primarily due to lower spending on sales related activities of our U.S. Business segment.
Contractual gold payments
Contractual gold payments expense increased 14.5% from $2.7 million during the three months ended June 30, 2018 to $3.1 million in the comparable period in 2019. This expense was associated with the payment of 2,375 ounces of gold (2,085 ounces for the period April 11 through June 30, 2018) and was calculated using the average daily spot price of $1,302 and $1,310 per ounce during the three months ended of 2018 and 2019, respectively.
Professional and consulting fees
Professional and consulting fees decreased 16.9% from $1.6 million during the three months ended June 30, 2018 to $1.3 million in the comparable period in 2019 due to lower spending on corporate consulting-related expenses.
Occupancy, communications and equipment
Occupancy, communications and equipment expense decreased 1.7% from $1.6 million during the three months ended June 30, 2018 to $1.5 million in the comparable period in 2019 due to the closure of our office in Japan partly offset by additional office space associated with the ETFS Acquisition.
Depreciation and amortization
Depreciation and amortization expense decreased 21.7% from the three months ended June 30, 2018 to $0.3 million primarily due to the closure of our office in Japan.
 
44
 
 
Table of Contents
 
Third-party distribution fees
Third-party distribution fees increased 15.2% from $1.7 million during the three months ended June 30, 2018 to $1.9 million in the comparable period in 2019 primarily due to higher fees paid for platform relationships partly offset by lower fees paid to our third-party marketing agent in Latin America.
Acquisition-related costs
Acquisition-related costs decreased 99.6% from $7.9 million during the three months ended June 30, 2018 to $0.03 million in the comparable period in 2019 as the integration of ETFS is essentially complete. We expect to have additional acquisition-related expenses in the third quarter as we rationalize our product offering in Europe following the ETFS Acquisition.
Other
Other expenses were essentially unchanged from the three months ended June 30, 2018.
Other Income/(Expenses)
                                 
 
Three Months Ended
June 30,
   
Change
   
Percent
Change
 
(in thousands)
 
2019
   
2018
 
Interest expense
  $
(2,910
)   $
(2,356
)   $
(554
)    
23.5
%
(Loss)/gain on revaluation of deferred consideration – gold payments
   
(4,037
)    
9,898
     
(13,935
)    
n/a
 
Interest income
   
818
     
612
     
206
     
33.7
%
Other gains and losses, net
   
284
     
(501
)    
785
     
n/a
 
                                 
Total other income/(expenses)
  $
(5,845
)   $
7,653
    $
(13,498
)    
n/a


Three Months Ended
June 30,
 
As a Percent of Revenues:
 
2019
   
2018
 
Interest expense
   
(4.4
%)    
(3.1
%)
(Loss)/gain on revaluation of deferred consideration – gold payments
   
(6.1
%)    
13.2
%
Interest income
   
1.2
%    
0.8
%
Other gains and losses, net
   
0.4
%    
(0.7
%)
                 
Total other income/(expenses)
   
(8.8
%)    
10.2
%
                 
Interest expense
Interest expense increased 23.5% from $2.4 million during the three months ended June 30, 2018 to $2.9 million in the comparable period in 2019 due to higher interest rates as well as the recognition of a full quarter of expense as the borrowing under our term loan commenced on April 11, 2018. Our effective interest rate during April 11, 2018 through June 30, 2018 and during the three months ended June 30, 2019 was 4.9% and 5.5%, respectively, and includes our cost of borrowing and amortization of issuance costs.
(Loss)/gain on revaluation of deferred consideration – gold payments
We recognized a gain on revaluation of deferred consideration of $9.9 million during the three months ended June 30, 2018 as compared to a loss of ($4.0) million during the three months ended June 30, 2019. The loss arose in the current quarter due to an increase in the price of gold, partly offset by a flattening of the forward-looking gold curve when compared to the forward-looking gold curve on March 31, 2019, the date on which the deferred consideration was last measured. The magnitude of any gain or loss is highly correlated to the magnitude of the change in the forward-looking price of gold.
Interest income
Interest income increased 33.7% from $0.6 million during the three months ended June 30, 2018 to $0.8 million in the comparable period in 2019 primarily due to higher
paid-in-kind
interest, or PIK, on notes receivable from AdvisorEngine.
Other gains and losses, net
Other gains and losses, net were ($0.5) million and $0.3 million during the three months ended June 30, 2018 and 2019, respectively. Gains and losses generally arise from the sale of gold earned from management fees paid by our physically-backed gold ETPs, foreign exchange fluctuations, securities owned and other miscellaneous items.
 
45
 
 
Table of Contents
 
Income taxes
Our effective income tax rate for the three months ended June 30, 2019 of 59.1% resulted in income tax expense of $3.6 million. Our effective income tax rate differs from the federal statutory tax rate of 21% primarily due to a valuation allowance on foreign net operating losses,
non-deductible
executive compensation, a
non-deductible
loss on revaluation of deferred consideration and state and local taxes, partly offset by a lower tax rate on foreign earnings.
Our effective income tax rate for the three months ended June 30, 2018 of 24.6% resulted in income tax expense of $5.5 million. Our effective income tax rate differs from the federal statutory tax rate of 21% primarily due to
non-deductible
acquisition-related costs, a valuation allowance on foreign net operating losses and state and local income taxes, partly offset by a
non-taxable
gain on revaluation of deferred consideration and a lower tax rate on foreign earnings.
Six Months Ended June 30, 2019 Compared to Six Months Ended June 30, 2018
Selected Operating and Financial Information
                                 
 
Six Months Ended
June 30,
   
Change
   
Percent
Change
 
 
2019
   
2018
 
Global AUM (in millions)


Average global AUM
  $
58,126
    $
54,512
    $
3,614
     
6.6
%
                                 
Revenues (in thousands)


Advisory fees
  $
130,467
    $
132,234
    $
(1,767
)    
(1.3
%)
Other income
   
1,311
     
1,445
     
(134
)    
(9.3
%)
                                 
Total revenues
  $
131,778
    $
133,679
    $
(1,901
)    
(1.4
%)
                                 
 
Average Global AUM
Our average global AUM increased 6.6% from $54.5 billion during the six months ended June 30, 2018 to $58.1 billion in the comparable period in 2019 primarily due to the full year effect of AUM from ETFS, net inflows into our fixed income, U.S. equity and commodity ETPs and market appreciation, partly offset by outflows from HEDJ and DXJ.
Operating Revenues
Advisory fees
Advisory fee revenues decreased 1.3% from $132.2 million during the six months ended June 30, 2018 to $130.5 million in the comparable period in 2019 due to lower average AUM of our U.S. Business segment, partly offset by higher revenues earned from ETFS, the acquisition of which was completed on April 11, 2018.
Other income
Other income decreased 9.3% from $1.4 million during the six months ended June 30, 2018 to $1.3 million in the comparable period in 2019 primarily due lower licensing fee revenues of our U.S. Business segment.
Operating Expenses
                                 
 
Six Months Ended
June 30,
   
Change
   
Percent
Change
 
(in thousands)
 
2019
   
2018
 
Compensation and benefits
  $
42,601
    $
38,133
    $
4,468
     
11.7
%
Fund management and administration
   
30,742
     
25,533
     
5,209
     
20.4
%
Marketing and advertising
   
5,590
     
6,973
     
(1,383
)    
(19.8
%)
Sales and business development
   
8,593
     
8,316
     
277
     
3.3
%
Contractual gold payments
   
6,208
     
2,715
     
3,493
     
128.7
%
Professional and consulting fees
   
2,778
     
3,196
     
(418
)    
(13.1
%)
Occupancy, communications and equipment
   
3,166
     
2,937
     
229
     
7.8
%
Depreciation and amortization
   
533
     
692
     
(159
)    
(23.0
%)
Third-party distribution fees
   
4,319
     
3,391
     
928
     
27.4
%
Acquisition-related costs
   
346
     
9,990
     
(9,644
)    
(96.5
%)
Other
   
4,308
     
4,051
     
257
     
6.3
%
                                 
Total expenses
  $
109,184
    $
105,927
    $
3,257
     
3.1
%


46


Table of Contents


Six Months Ended
June 30,
 
As a Percent of Revenues:
 
2019
   
2018
 
Compensation and benefits
   
32.3
%    
28.5
%
Fund management and administration
   
23.3
%    
19.1
%
Marketing and advertising
   
4.3
%    
5.2
%
Sales and business development
   
6.5
%    
6.2
%
Contractual gold payments
   
4.7
%    
2.0
%
Professional and consulting fees
   
2.1
%    
2.4
%
Occupancy, communications and equipment
   
2.4
%    
2.2
%
Depreciation and amortization
   
0.4
%    
0.5
%
Third-party distribution fees
   
3.3
%    
2.6
%
Acquisition-related costs
   
0.3
%    
7.5
%
Other
   
3.3
%    
3.0
%
                 
Total expenses
   
82.9
%    
79.2
%
                 
 
Compensation and benefits
Compensation and benefits expense increased 11.7% from $38.1 million during the six months ended June 30, 2018 to $42.6 million in the comparable period in 2019 primarily due severance expense of $3.5 million, the full year effect of the ETFS Acquisition and higher incentive compensation.
Fund management and administration
Fund management and administration expense increased 20.4% from $25.5 million during the six months ended June 30, 2018 to $30.7 million in the comparable period in 2019 primarily due to the full year effect of the ETFS Acquisition, partly offset by lower average AUM of our U.S. Business segment.
Marketing and advertising
Marketing and advertising expense decreased 19.8% from $7.0 million during the six months ended June 30, 2018 to $5.6 million in the comparable period in 2019 primarily due to lower spending in our U.S. Business segment.
Sales and business development
Sales and business development expense increased 3.3% from $8.3 million during the six months ended June 30, 2018 to $8.6 million in the comparable period in 2019 primarily due to the full year effect of the ETFS Acquisition, partly offset by lower spending on sales related activities in our U.S. Business segment.
Contractual gold payments
Contractual gold payments expense increased 128.7% from $2.7 million during the period April 11, 2018 through June 30, 2018 to $6.2 million during the six months ended June 30, 2019. This expense was associated with the payment of 4,750 ounces of gold (2,085 ounces for the period April 11 through June 30, 2018) and was calculated using the average daily spot price of $1,302 and $1,307 per ounce during the year to date periods of 2018 and 2019, respectively.
Professional and consulting fees
Professional and consulting fees decreased 13.1% from $3.2 million during the six months ended June 30, 2018 to $2.8 million in the comparable period in 2019 due to lower spending on corporate consulting-related expenses of our U.S. Business segment.
Occupancy, communications and equipment
Occupancy, communications and equipment expense increased 7.8% from $2.9 million during the six months ended June 30, 2018 to $3.2 million in the comparable period in 2019 primarily due to the full year effect of the ETFS Acquisition, partly offset by the closure of our office in Japan.
Depreciation and amortization
Depreciation and amortization expense decreased 23.0% from $0.7 million during the six months ended June 30, 2018 to $0.5 million in the comparable period in 2019 primarily due to the closure of our office in Japan.
 
47


Table of Contents
 
Third-party distribution fees
Third-party distribution fees increased 27.4% from $3.4 million during the six months ended June 30, 2018 to $4.3 million in the comparable period in 2019 primarily due to higher fees paid for platform relationships partly offset by lower fees paid to our third-party marketing agent in Latin America.
Acquisition-related costs
Acquisition-related costs decreased 96.5% from $10.0 million during the six months ended June 30, 2018 to $0.3 million in the comparable period in 2019 as the integration of ETFS is essentially complete. We expect to have additional acquisition-related expenses in the third quarter as we rationalize our product offering in Europe following the ETFS Acquisition.
Other
Other expenses increased 6.3% from $4.1 million during the six months ended June 30, 2018 to $4.3 million in the comparable period in 2019 primarily due to the full year effect of higher office expenses associated with an increase in headcount from the ETFS Acquisition.
Other Income/(Expenses)
                                 
 
Six Months Ended
June 30,
   
Change
   
Percent
Change
 
(in thousands)
 
2019
   
2018
 
Interest expense
  $
(5,802
)   $
(2,356
)   $
(3,446
)    
146.3
%
Gain on revaluation of deferred consideration – gold payments
   
367
     
9,898
     
(9,531
)    
(96.3
%)
Interest income
   
1,597
     
1,574
     
23
     
1.5
%
Impairment
   
(572
)    
—  
     
(572
)    
n/a
 
Other losses, net
   
(4,343
)    
(762
)    
(3,581
)    
469.9
%
                                 
Total other income/(expenses)
  $
(8,753
)   $
8,354
    $
(17,107
)    
n/a


Six Months Ended
June 30,
 
As a Percent of Revenues:
 
2019
   
2018
 
Interest expense
   
(4.4
%)    
(1.8
%)
Gain on revaluation of deferred consideration – gold payments
   
0.3
%    
7.4
%
Interest income
   
1.2
%    
1.2
%
Impairment
   
(0.4
%)    
n/a
 
Other losses, net
   
(3.3
%)    
(0.6
%)
                 
Total other income/(expenses)
   
(6.6
%)    
6.2
%
                 
 
Interest expense
Interest expense increased 146.3% from $2.4 million during the six months ended June 30, 2018 to $5.8 million in the comparable period in 2019 as borrowing under our term loan commenced on April 11, 2018. In addition, the increase was attributable to higher interest rates. Our effective interest rate during April 11, 2018 through June 30, 2018 and during the six months ended June 30, 2019 was 4.9% and 5.5%, respectively, and includes our cost of borrowing and amortization of issuance costs.
Gain on revaluation of deferred consideration – gold payments
We recognized a gain on revaluation of deferred consideration of $9.9 million during the six months ended June 30, 2018 as compared to a gain of $0.4 million during the six months ended June 30, 2019. The gain arose in the current year as the forward-looking curve flattened when compared to the forward-looking curve on December 31, 2018. The magnitude of any gain or loss is highly correlated to the magnitude of the change in the forward-looking price of gold.
 
48
 
 
Table of Contents
 
Interest income
Interest income was essentially unchanged from the six months ended June 30, 2018 as PIK interest received on notes receivable from AdvisorEngine was offset by the maturity of our short-term investment grade portfolio which occurred in the prior year.
Impairment
We recognized an impairment of $0.6 million during the six months ended June 30, 2019 in connection with the termination of our Japan office lease.
Other losses, net
Other losses, net were $0.8 million and $4.3 million during the six months ended June 30, 2018 and 2019, respectively. Included in the loss recognized during the six months ended June 30, 2019 is a charge of $4.3 million arising from the release of a
tax-related
indemnification asset upon the expiration of the statute of limitations. The indemnification arose from the ETFS Acquisition. An equal and offsetting benefit has been recognized in income tax expense. In addition, gains and losses generally arise from the sale of gold earned from management fees paid by our physically-backed gold ETPs, foreign exchange fluctuations, securities owned and other miscellaneous items.
Income taxes
Our effective income tax rate for the six months ended June 30, 2019 of 18.3% resulted in an income tax expense of $2.5 million. Our effective income tax rate differs from the federal statutory tax rate of 21% primarily due to a $4.3 million reduction in unrecognized tax benefits, a lower tax rate on foreign earnings and a
non-taxable
gain on revaluation of deferred consideration, partly offset by a valuation allowance on foreign net operating losses, tax shortfalls associated with the vesting and exercise of stock-based compensation awards,
non-deductible
executive compensation and state and local income taxes.
Our effective income tax rate for the six months ended June 30, 2018 of 27.6% resulted in income tax expense of $10.0 million. Our effective tax rate differs from the federal statutory tax rate of 21% primarily due to
non-deductible
acquisition-related costs, a valuation allowance on foreign net operating losses and state and local income taxes, partly offset by the
non-taxable
gain on revaluation of deferred consideration and a lower tax rate on foreign earnings.    
 
49
 
 
Table of Contents
 
Segment Results
The table below presents the results of our U.S. Business and International Business reportable segments (in thousands, except for average assets during the period, which are in millions).
                                 
 
Three Months Ended June 30,
   
Six Months Ended June 30,
 
 
2019
   
2018
   
2019
   
2018
 
U.S. Business Segment


Operating revenues


Advisory fees
  $
43,070
    $
52,931
    $
85,587
    $
108,449
 
Other income
   
76
     
162
     
182
     
309
 
                                 
Total operating revenues
  $
43,146
    $
53,093
    $
85,769
    $
108,758
 
                                 
Total operating expenses
  $
(36,407
)   $
(42,638
)   $
(73,583
)   $
(81,668
)
                                 
Other income/(expenses)


Interest expense
  $
(194)
    $
(173)
    $
(386)
    $
(173
)
Interest income
   
818
     
612
     
1,597
     
1,574
 
Impairment
   
—  
     
—  
     
(572
)    
—  
 
Other gains and losses, net
   
(54
)    
(66
)    
91
     
(292
)
                                 
Total other income
  $
570
    $
373
    $
730
    $
1,109
 
                                 
Total income before income taxes (U.S. Business Segment)
  $
7,309
    $
10,828
    $
12,916
    $
28,199
 
                                 
Average assets during the period (in millions)
  $
38,945
    $
43,464
    $
38,503
    $
44,541
 
Average ETF advisory fee during the period
   
0.44
%    
0.49
%    
0.45
%    
0.49
%
International Business Segment


Operating revenues


Advisory fees
  $
22,557
    $
20,847
    $
44,880
    $
23,785
 
Other income
   
590
     
835
     
1,129
     
1,136
 
                                 
Total operating revenues
  $
23,147
    $
21,682
    $
46,009
    $
24,921
 
                                 
Total operating expenses
  $
(17,975
)   $
(17,606
)   $
(35,601
)   $
(24,259
)
                                 
Other income/(expenses)


Interest expense
  $
(2,716
)   $
(2,183
)   $
(5,416
)   $
(2,183
)
(Loss)/gain on revaluation of deferred consideration
   
(4,037
)    
9,898
     
367
     
9,898
 
Other gains and losses, net
   
338
     
(435
)    
(4,434
)    
(470
)
                                 
Total other income/(expenses)
  $
(6,415
)   $
7,280
    $
(9,483
)   $
7,245
 
                                 
Total (loss)/income before income taxes (International Business Segment)
  $
(1,243
)   $
11,356
    $
925
    $
7,907
 
                                 
Average assets during the period (in millions)
  $
19,624
    $
17,837
    $
19,623
    $
9,971
 
Average ETP advisory fee during the period
   
0.46
%    
0.47
%    
0.47
%    
0.48
%
Income/(loss) before income taxes


U.S. Business segment
  $
7,309
    $
10,828
    $
12,916
    $
28,199
 
International Business segment
   
(1,243
)    
11,356
     
925
     
7,907
 
                                 
Total income before income taxes
 
$
6,066
   
$
22,184
   
$
13,841
   
$
36,106


50


Table of Contents
 
Three Months Ended June 30, 2019 Compared to Three Months Ended June 30, 2019
U.S. Business segment
Operating revenues decreased 18.7% from $53.1 million in the three months ended June 30, 2018 to $43.1 million in the comparable period in 2019. The decrease was attributable to lower average AUM due to net outflows from HEDJ and DXJ, market depreciation and lower average U.S. listed ETF advisory fees due to a change in product mix. These decreases were partly offset by net inflows into our fixed income and U.S. equity ETFs. Our average U.S. advisory fee was 0.49% and 0.44% during the three months ended June 30, 2018 and 2019, respectively.
Operating expenses decreased 14.6% from $42.6 million during the three months ended June 30, 2018 to $36.4 million in the comparable period in 2019 primarily due to lower acquisition-related costs, lower marketing and advertising expense and lower sales and business development expense. These decreases were partly offset by higher incentive compensation and severance expense of $1.4 million. Headcount of our U.S. Business segment was 155 and 143 at June 30, 2018 and 2019, respectively.
Other income/(expenses) were $0.6 million during the three months ended June 30, 2019, which were comprised of interest income of $0.8 million, partly offset by interest expense of ($0.2) million. Other income/(expenses) for the three months ended June 30, 2018 were $0.4 million, which were comprised of interest income of $0.6 million, partly offset by interest expense of ($0.2) million.
International Business segment
Operating revenues increased 6.8% from $21.7 million during the three months ended June 30, 2018 to $23.1 million in the comparable period in 2019. The increase was attributable to higher average AUM due to net inflows into our commodity ETPs and market appreciation as well as the recognition of a full quarter of revenues from ETFS. These increases were partly offset by lower average International listed ETP advisory fees due to a change in product mix. Our average International listed ETP advisory fee was 0.47% and 0.46% during the three months ended June 30, 2018 and 2019, respectively.
Operating expenses increased 2.1% from $17.6 million during the three months ended June 30, 2018 to $18.0 million in the comparable period in 2019 primarily due to the recognition of a full quarter of fund management and administration expense from ETFS, partly offset by lower acquisition-related costs. Headcount of our International Business segment was 76 and 71 at June 30, 2018 and 2019, respectively.
Other income/(expenses) were ($6.4) million during the three months ended June 30, 2019, which were comprised of a loss on revaluation of deferred consideration of ($4.0) million and interest expense of ($2.7) million, partly offset by and other net gains of $0.3 million. Other income/(expenses) for the three months ended June 30, 2018 were $7.3 million and were comprised of a gain on revaluation of deferred consideration of $9.9 million, partly offset by interest expense of ($2.2) million and other net losses of ($0.4) million.
Six Months Ended June 30, 2019 Compared to Six Months Ended June 30, 2018
U.S. Business segment
Operating revenues decreased 21.1% from $108.8 million in the six months ended June 30, 2018 to $85.8 million in the comparable period in 2019. The decrease was attributable due to lower average AUM and lower average U.S. listed ETF advisory fees due to a change in product mix. See “Three Months Ended June 30, 2019 Compared to Three Months Ended June 30, 2018” above for additional information. Our average U.S. advisory fee was 0.49% and 0.45% during the six months ended June 30, 2018 and 2019, respectively.
Operating expenses decreased 9.9% from $81.7 million during the six months ended June 30, 2018 to $73.6 million in the comparable period in 2019 primarily due to lower acquisition-related costs, lower fund management and administration expense, lower marketing and advertising expense and lower sales and business development expense. These decreases were partly offset by severance expenses of $3.4 million, higher incentive compensation and higher third-party distribution fees. 
Other income/(expenses) were $0.7 million during the six months ended June 30, 2019, which were comprised of interest income of $1.6 million and other net gains of $0.1 million, partly offset by an impairment of ($0.6) million recognized in connection with the termination of our Japan office lease and interest expense of ($0.4) million. Other income/(expenses) for the six months ended June 30, 2018 were $1.1 million and were comprised of interest income of $1.6 million, partly offset by interest expense of ($0.2) million and other net losses of ($0.3) million.
 
51
 
 
Table of Contents
 
International Business segment
Operating revenues increased 84.6% from $24.9 million during the six months ended June 30, 2018 to $46.0 million in the comparable period in 2019 primarily due higher revenues earned from ETFS, the acquisition of which was completed on April 11, 2018.
Operating expenses increased 46.8% from $24.3 million during the six months ended June 30, 2018 to $35.6 million in the comparable period in 2019 primarily due to higher expenses from ETFS, which were recognized for the entire six months of 2019. These increases were partly offset by lower acquisition-related costs.
Other income/(expenses) were ($9.5) million during the six months ended June 30, 2019, which were comprised of interest expense of ($5.4) million and other net losses of ($4.4) million. Other net losses primarily arose from the reduction of a
tax-related
indemnification asset upon the expiration of the statute of limitations. These losses were partly offset by a gain on revaluation of deferred consideration of $0.4 million. Other income/(expenses) for the six months ended June 30, 2018 were $7.2 million and were comprised of a gain on revaluation of deferred consideration of $9.9 million, partly offset by interest expense of ($2.2) million and other net losses of ($0.5) million.
Liquidity and Capital Resources
The following table summarizes key data regarding our liquidity, capital resources and use of capital to fund our operations:
                 
 
June 30,
2019
   
December 31,
2018
 
Balance Sheet Data (in thousands)
:


Cash and cash equivalents
  $
79,611
    $
77,784
 
Accounts receivable
   
24,442
     
25,834
 
Securities
held-to-maturity
   
20,136
     
20,180
 
Securities owned, at fair value
   
9,095
     
8,873
 
                 
Total: Liquid assets
   
133,284
     
132,671
 
Less: Total current liabilities
   
(63,142
)    
(62,801
)
Less: Net liquid asset requirement – certain subsidiaries (International Business segment)
   
(12,255
)    
(11,005
)
                 
Subtotal
   
57,887
     
58,865
 
Plus: Revolving credit facility – available capacity
   
25,140
     
50,000
 
                 
Total: Available liquidity
  $
83,027
    $
108,865


Six Months Ended June 30,
 
 
2019
   
2018
 
Cash Flow Data (in thousands)
:


Operating cash flows
  $
15,359
    $
9,014
 
Investing cash flows
   
(1,516
)    
(172,645
)
Financing cash flows
   
(12,284
)    
181,095
 
Foreign exchange rate effect
   
268
     
(913
)
                 
Increase in cash and cash equivalents
  $
1,827
    $
16,551


Liquidity
We consider our available liquidity to be our liquid assets and available borrowings under our revolving credit facility, less our current liabilities and net liquid asset requirements of certain subsidiaries of our International Business segment. Liquid assets consist of cash and cash equivalents, accounts receivable, securities
held-to-maturity
and securities owned, at fair value. Our securities owned, at fair value are highly liquid investments. Certain securities are accounted for as
held-to-maturity
securities and we have the intention and ability to hold them to maturity. However, these securities are also readily traded and, if needed, could be sold for liquidity. Accounts receivable are current assets and primarily represent receivables from advisory fees we earn from our ETPs. Our current liabilities consist primarily of payments owed to vendors and third parties in the normal course of business, deferred consideration and accrued incentive compensation for employees.
See the section below titled “Credit Facility” for a discussion of our revolving credit facility.
 
52
 
 
Table of Contents
 
Cash and cash equivalents increased $1.8 million during the six months ended June 30, 2019 due to net cash provided by operating activities of $15.4 million and $0.3 million from changes in foreign exchange rates. These increases were partly offset by $10.2 million used to pay dividends on our common stock, $2.1 million used to repurchase our common stock and $1.5 million used to fund the AdvisorEngine unsecured convertible note receivable and $0.1 million used for other activities.
Cash and cash equivalents increased $16.6 million during the six months ended June 30, 2018 due to $200.0 million proceeds from the issuance of long-term debt, $64.5 million from sales and maturities of debt securities
available-for-sale,
$9.0 million of cash generated by our operating activities and $1.1 million from
held-to-maturity
securities called or maturing during the period. These increases were partly offset by $233.2 million of cash paid upon closing of the ETFS Acquisition, net of cash acquired, $9.2 million used to pay dividends on our common stock, $8.7 million used to pay credit facility issuance costs, $5.0 million used to fund the AdvisorEngine unsecured
non-convertible
note receivable, $1.0 million used to repurchase our common stock and $0.9 million used for other activities.
Credit Facility
On April 11, 2018 and in connection with the ETFS Acquisition, we entered into a credit agreement with Credit Suisse AG and certain other lenders. Under the credit agreement, the lenders extended us a $200.0 million Term Loan, the net cash proceeds of which were used, together with other cash on hand, to complete the acquisition and pay certain related fees, costs and expenses, and made a $50.0 million revolving credit facility, or the Revolver, available to us for revolving borrowings from time to time for working capital, capital expenditures and general corporate purposes. The Term Loan, together with the Revolver, are referred to in this Report as the Credit Facility. The available capacity under the Revolver is subject to compliance with the Total Leverage Ratio as further described below.
Interest on the Term Loan accrues at an annual rate equal to LIBOR, plus up to 2.00% (commencing at LIBOR, plus 1.75%), and interest on the Revolver accrues at an annual rate equal to LIBOR, plus up to 1.50% (commencing at LIBOR, plus 1.25%), in each case, with the exact interest rate margin determined based on the Total Leverage Ratio (as defined below). The Revolver is also subject to a facility fee equal to an annual rate of up to 0.50% of the actual daily amount of the aggregate commitments (whether used or unused) under the Revolver, with the exact facility fee rate determined based on the Total Leverage Ratio. The Credit Facility matures on April 11, 2021. The Term Loan does not amortize and the entire principal balance is due in a single payment on the maturity date.
The credit agreement governing the terms of the Credit Facility includes a financial covenant that requires that we maintain a Total Leverage Ratio, calculated as of the last day of each fiscal quarter, equal to or less than the ratio set forth opposite such fiscal quarter:
         
Fiscal Quarter Ending
 
Total Leverage Ratio
 
June 30, 2019
   
2.50:1.00
 
September 30, 2019
   
2.50:1.00
 
December 31, 2019
   
2.50:1.00
 
March 31, 2020
   
2.25:1.00
 
June 30, 2020
   
2.25:1.00
 
September 30, 2020 and each subsequent fiscal quarter ending on or before the maturity date
   
2.00:1.00
 
 
Total Leverage Ratio means, as of the last day of any fiscal quarter, the ratio of Consolidated Total Debt of ours and our restricted subsidiaries (as defined in the credit agreement) as of such date to Consolidated EBITDA of ours and our restricted subsidiaries (as defined in the credit agreement) for the four consecutive fiscal quarters ended on such date.
The credit agreement contains customary affirmative covenants for transactions of this type and other affirmative covenants agreed to by the parties, including, among others, the provision of annual and quarterly financial statements and compliance certificates, maintenance of property, insurance, compliance with laws and environmental matters. The credit agreement contains customary negative covenants, including among others, restrictions on the incurrence of indebtedness, granting of liens, making investments and acquisitions, paying dividends, repurchasing equity interests of ours, entering into affiliate transactions and asset sales. The credit agreement also provides for a number of customary events of default, including, among others, payment, bankruptcy, covenant, representation and warranty, change of control and judgment defaults.
 
53


Table of Contents
 
We are in compliance with our covenants under the credit agreement.
Capital Resources
Our principal source of financing is our operating cash flow. We believe that current cash flows generated by our operating activities and existing cash balances should be sufficient for us to fund our operations for at least the next 12 months. In addition, we have access to the Revolver for working capital, capital expenditures and general corporate purposes. No amounts are currently outstanding under the Revolver.
Use of Capital
Our business does not require us to maintain a significant cash position. However, certain of our subsidiaries of our International Business segment are required to maintain a minimum level of net liquid assets, which at June 30, 2019 was approximately $12.3 million in the aggregate. Notwithstanding these net liquid asset requirements, we expect that our main uses of cash will be to fund the ongoing operations of our business. Also, as part of our capital management, we maintain a capital return program which includes a $0.03 per share quarterly cash dividend and authority to purchase our common stock through April 27, 2022, including purchases to offset future equity grants made under our equity plans. As previously mentioned, under the terms of the credit agreement, we are subject to various covenants including compliance with the Total Leverage Ratio. A quarterly dividend payment in excess of $0.03 per share and repurchases of our common stock (excluding purchases of our common stock withheld pursuant to the terms of equity awards granted to employees to satisfy tax withholding obligations) are permitted only to the extent the Total Leverage Ratio does not exceed 1.75 to 1.00 and no event of default (as defined in the credit agreement) has occurred and is continuing at the time the cash dividend payment or stock repurchase is made. 
During the three months ended June 30, 2019, we repurchased 14,065 shares of our common stock under the repurchase program for an aggregate cost of $0.1 million. At June 30, 2019, $83.6 million remained under this program for future purchases.
Contractual Obligations
The following table summarizes our future cash payments associated with contractual obligations as of June 30, 2019:
                                         
 
Total
   
Payments Due by Period
 
(in thousands)
 
Less than 1
year
   
1 to 3 years
   
3 to 5 years
   
More than 5
years
 
Term Loan
  $
200,000
    $
—  
    $
200,000
    $
—  
    $
—  
 
Operating leases
   
32,023
     
3,632
     
6,313
     
5,916
     
16,162
 
                                         
Total
  $
232,023
    $
3,632
    $
206,313
    $
5,916
    $
16,162


Off-Balance
Sheet Arrangements
We do not have any
off-balance
sheet financing or other arrangements and have neither created nor are party to any special-purpose or
off-balance
sheet entities for the purpose of raising capital, incurring debt or operating our business.
Critical Accounting Policies
Business Combinations
We account for business combinations under the acquisition method of accounting in accordance with Accounting Standards Codification Topic 805,
Business Combinations,
which requires an allocation of the consideration we paid to the identifiable assets, intangible assets and liabilities based on the estimated fair values as of the closing date of the acquisition. The excess of the fair value of purchase price over the fair values of these identifiable assets, intangible assets and liabilities is recorded as goodwill.
Goodwill and Intangible Assets
Goodwill is the excess of the fair value of the purchase price over the fair values of the identifiable net assets at the acquisition date. We test our goodwill for impairment at least annually and at the time of a triggering event requiring
re-evaluation,
if one were to occur, in accordance with Accounting Standards Update, or ASU,
2017-04,
Intangibles-Goodwill and Other (Topic 350): Simplifying
the Test for Goodwill Impairment
. We early adopted the revised guidance for impairment tests performed after January 1, 2017. Under the revised guidance, goodwill is considered impaired when the estimated fair value of the reporting unit that was allocated the goodwill is less than its carrying value. If the estimated fair value of such reporting unit is less than its carrying value, goodwill impairment is recognized based on that difference, not to exceed the carrying amount of goodwill. A reporting unit is an operating segment or a component of an operating segment provided that the component constitutes a business for which discrete financial information is available and management regularly reviews the operating results of that component.
 
54


Table of Contents
 
For impairment testing purposes, goodwill has been allocated to our U.S. Business reporting unit which is assessed annually for impairment on April 30
th
. In addition, goodwill arising from the ETFS Acquisition (See Note 3 to our Consolidated Financial Statements) has been allocated to the European Business reporting unit included in the International Business reportable segment and assessed annually for impairment on November 30
th
. When performing our goodwill impairment test, we consider a qualitative assessment, when appropriate, and the income approach, market approach and our market capitalization when determining the fair value of our reporting units. Goodwill allocated to our U.S. Business reporting unit was assessed for impairment as of April 30, 2019. The results of this analysis indicated no impairment.
Indefinite-lived intangible assets are tested for impairment at least annually and are reviewed for impairment whenever events or changes in circumstances indicate that the carrying amount of an asset may not be recoverable. Indefinite-lived intangible assets are impaired if their estimated fair value is less than their carrying value. We may rely on a qualitative assessment when performing our intangible asset impairment test. Otherwise, the impairment evaluation is performed at the lowest level of reasonably identifiable cash flows independent of other assets. The annual impairment testing date for all our intangible assets is November 30
th
.
Investments, Carried at Cost
We account for equity investments that do not have a readily determinable fair value as cost method investments under the measurement alternative prescribed within ASU
2016-01,
Financial Instruments – Recognition and Measurement of Financial Assets and Financial Liabilities
, to the extent such investments are not subject to consolidation or the equity method. Under the measurement alternative, these financial instruments are carried at cost, less any impairment (assessed quarterly), plus or minus changes resulting from observable price changes in orderly transactions for an identical or similar investment of the same issuer. In addition, income is recognized when dividends are received only to the extent they are distributed from net accumulated earnings of the investee. Otherwise, such distributions are considered returns of investment and are recorded as a reduction of the cost of the investment.
Revenue Recognition
We earn substantially all of our revenue in the form of advisory fees from our ETPs and recognize this revenue over time, as the performance obligation is satisfied. ETP advisory fees are based on a percentage of the ETPs’ average daily net assets. Progress is measured using the practical expedient under the output method resulting in the recognition of revenue in the amount for which we have a right to invoice.
Recently Issued Accounting Pronouncements
In June 2016, the FASB issued ASU
2016-13,
Financial Instruments-Credit Losses (Topic 326) – Measurement of Credit Losses on Financial Instruments
(ASU
2016-13).
The main objective of the standard is to provide financial statement users with more decision-useful information about the expected credit losses on financial instruments and other commitments to extend credit held by a reporting entity at each reporting date. In issuing this standard, the FASB is responding to criticism that today’s guidance delays recognition of credit losses. The standard will replace today’s “incurred loss” approach with an “expected loss” model. The new model, referred to as the current expected credit loss, or CECL, model, will apply to: (1) financial assets subject to credit losses and measured at amortized cost, and (2) certain
off-balance
sheet credit exposures. The standard is applicable to loans, accounts receivable, trade receivables, and other financial assets measured at amortized cost, loan commitments and certain other
off-balance
sheet credit exposures, debt securities (including those
held-to-maturity)
and other financial assets measured at fair value through other comprehensive income, and beneficial interests in securitized financial assets. The CECL model does not apply to
available-for-sale
debt securities. For
available-for-sale
debt securities with unrealized losses, entities will measure credit losses in a manner similar to what they do today, except that the credit losses will be recognized as allowances rather than reductions in the amortized cost of the securities. Accordingly, the new methodology will be utilized when assessing our financial instruments for impairment. As a result, entities will recognize improvements to estimated credit losses immediately in earnings rather than as interest income over time, as they do today. The ASU also simplifies the accounting model for purchased credit-impaired debt securities and loans. ASU
2016-13
also expands the disclosure requirements regarding an entity’s assumptions, models, and methods for estimating the allowance for loan and lease losses. ASU
2016-13
is effective for years beginning after December 15, 2019, including interim periods within those fiscal years under a modified retrospective approach. Early adoption is permitted for the periods beginning after December 15, 2018. We are currently evaluating the impact that this standard will have on our consolidated financial statements and plan to adopt this standard on January 1, 2020.
In August 2018, the FASB issued ASU
2018-13,
Fair Value Measurement (Topic 820) – Disclosure Framework – Changes to the Disclosure Requirements for Fair Value Measurement
(ASU
2018-13),
which modifies the disclosure requirements on fair value measurements, including removing the requirement to disclose (1) the amount of and reasons for transfers between Level 1 and Level 2 of the fair value hierarchy, (2) the policy for timing of transfers between levels and (3) the valuation processes for Level 3 fair value
 
55
 
 
Table of Contents
 
measurements. ASU
2018-13
also added new disclosures including the requirement to disclose (a) the changes in unrealized gains and losses for the period included in other comprehensive income for recurring Level 3 fair value measurements held at the end of the reporting period and (b) the range and weighted average of significant unobservable inputs used to develop Level 3 fair value measurements. ASU
2018-13
is effective for fiscal years (and interim reporting periods within those years) beginning after December 15, 2019 and early adoption is permitted. This standard will only impact the disclosures pertaining to fair value measurements. We plan to adopt this standard on January 1, 2020.
ITEM 3. QUANTITATIVE AND QUALITATIVE DISCLOSURES ABOUT MARKET RISK
The following information, together with information included in other parts of this Management’s Discussion and Analysis of Financial Condition and Results of Operations, describes key aspects of our market risk.
Market Risk
Market risk to us generally represents the risk of changes in the value of our ETPs that results from fluctuations in securities or commodity prices, foreign currency exchange rates against the U.S. dollar, and interest rates. Nearly all our revenues are derived from advisory agreements for the WisdomTree ETPs. Under these agreements, the advisory fee we receive is based on the average market value of the assets in the WisdomTree ETP portfolios we manage.
Fluctuations in the value of the ETPs are common and are generated by numerous factors such as market volatility, the overall economy, inflation, changes in investor strategies and sentiment, availability of alternative investment vehicles, government regulations and others. Accordingly, changes in any one or a combination of these factors may reduce the value of investment securities and, in turn, the underlying AUM on which our revenues are earned. These declines may cause investors to withdraw funds from our ETPs in favor of investments that they perceive as offering greater opportunity or lower risk, thereby compounding the impact on our revenues. We believe challenging and volatile market conditions will continue to be present in the foreseeable future.
Interest Rate Risk
We invest our corporate cash in short-term interest earning assets, primarily money market instruments at a commercial bank, federal agency debt instruments and other securities which totaled $27.4 million and $30.5 million as of December 31, 2018 and June 30, 2019, respectively. We do not anticipate that changes in interest rates will have a material impact on our financial condition, operating results or cash flows.
In addition, in connection with the ETFS Acquisition, we obtained a $250.0 million Credit Facility consisting of a $200.0 million Term Loan and $50.0 million Revolver. Interest rate risk is not significant as borrowings under these facilities accrue interest at variable rates (See Note 12 to our Consolidated Financial Statements).
Exchange Rate Risk
Over the last few years, we have expanded our business globally and are subject to currency translation exposure on the results of our
non-U.S.
operations, primarily in Europe and Canada. Foreign currency translation risk is the risk that exchange rate gains or losses arise from translating foreign entities’ statements of earnings and balance sheets from functional currency to our reporting currency (the U.S. dollar) for consolidation purposes. Historically we generated the vast majority of our revenues and expenses in the U.S. dollar. However, upon completion of the ETFS Acquisition our exposure to exchange rate risk has increased. While the advisory fees earned by ETFS are predominantly in U.S. dollars (and also paid in gold ounces, as described below), expenses for corporate overhead are generally incurred in British pounds. Currently, we do not enter into derivative financial instruments aimed at offsetting certain exposures in the statement of operations or the balance sheet but may seek to do so in the future.
Exchange rate risk associated with the euro and Canadian dollar is not considered to be significant.
Commodity Price Risk
The completion of the ETFS Acquisition has provided us with an industry leading position in European-listed gold and commodity products. Fluctuations in the prices of commodities that are linked to certain of these ETPs could have a material adverse effect on ETFS’s AUM and revenues. In addition, a portion of the advisory fee revenues we receive on our ETPs backed by gold are paid in gold ounces. In addition, we pay gold ounces to satisfy our deferred consideration obligation that we assumed in connection with the ETFS Acquisition (See Note 11 to our Consolidated Financial Statements). While we may readily sell the gold that we earn under these advisory contracts, we still may maintain a position. We currently do not enter into arrangements to hedge against fluctuations in the price of gold and any hedging we may undertake in the future may not be cost-effective or sufficient to hedge against this gold exposure.
 
56


Table of Contents
 
ITEM 4. CONTROLS AND PROCEDURES
Evaluation of Disclosure Controls and Procedures
As of June 30, 2019, our management, with the participation of our Chief Executive Officer, Chief Financial Officer and Chief Accounting Officer, evaluated the effectiveness of our disclosure controls and procedures pursuant to Rule
13a-15(b)
promulgated under the Securities Exchange Act of 1934, as amended, or the Exchange Act. Based upon that evaluation, our Chief Executive Officer, Chief Financial Officer and Chief Accounting Officer concluded that, as of June 30, 2019, our disclosure controls and procedures were effective at a reasonable assurance level in ensuring that material information required to be disclosed by us in the reports that we file or submit under the Exchange Act is recorded, processed, summarized and reported within the time periods specified in the rules, regulations and forms of the SEC, including ensuring that such material information is accumulated by and communicated to our management, including our Chief Executive Officer, Chief Financial Officer and Chief Accounting Officer, as appropriate to allow timely decisions regarding required disclosure.
Changes in Internal Control over Financial Reporting
During the quarter ended June 30, 2019, we completed the integration of ETFS into our overall internal control over financial reporting. There were no other changes in our internal control over financial reporting that have materially affected, or are reasonably likely to materially affect, our internal control over financial reporting.
PART II: OTHER INFORMATION
ITEM 1. LEGAL PROCEEDINGS
None.
ITEM 1A. RISK FACTORS
You should carefully consider the information set forth in this Report, as well as the information in Part 1, Item 1A. “Risk Factors” in our Annual Report on Form
10-K
for the fiscal year ended December 31, 2018.
ITEM 2. UNREGISTERED SALES OF EQUITY SECURITIES AND USE OF PROCEEDS
Recent sales of Unregistered Securities
None.
Use of Proceeds
Not applicable.
Purchases of Equity Securities by the Issuer and Affiliated Purchasers
The following table provides information with respect to purchases made by or on behalf of the Company or any “affiliated purchaser” of shares of our common stock.
                                 
 
Total Number
of Shares
Purchased
   
Average Price
Paid Per Share
   
Total Number of
Shares Purchased
as
Part of Publicly
Announced Plans
or
Programs
(1)
   
Approximate
Dollar
Value of
Shares that
May Yet Be
Purchased
Under the
Plans or
Programs
 
Period


(in thousands)
 
April 1, 2019 to April 30, 2019
   
5,060
    $
7.59
     
5,060
     
 
May 1, 2019 to May 31, 2019
   
9,005
    $
7.03
     
9,005
     
 
June 1, 2019 to June 30, 2019
   
—  
    $
—  
     
—  


Total
   
14,065
    $
7.23
     
14,065
    $
83,622


(1) On April 24, 2019, our Board of Directors extended the term of our share repurchase program for three years through April 27, 2022. During the three months ended June 30, 2019, we repurchased 14,065 shares of our common stock under this program for an aggregate cost of approximately $0.1 million. As of June 30, 2019, $83.6 million remained under this program for future purchases. Under the terms of the credit agreement, share repurchases are permitted only to the extent the Total Leverage Ratio does not exceed 1.75 to 1.00 and no event of default (as defined in the credit agreement) has occurred and is continuing at the time the stock repurchase is made. However, our ability to purchase shares of our common stock withheld pursuant to the terms of equity awards granted to employees to satisfy tax withholding obligations is not restricted.


57


Table of Contents
 
ITEM 3. DEFAULTS UPON SENIOR SECURITIES
None.
ITEM 4. MINE SAFETY DISCLOSURES
Not applicable.
ITEM 5. OTHER INFORMATION
None.
 
58
 
 
Table of Contents
 
ITEM 6. EXHIBITS
         
Exhibit No.
   
Description
         
 
3.1


3.2


3.3


4.1


4.2


4.3


4.4


4.5


4.6


31.1 (1)


31.2 (1)


31.3 (1)


32 (1)


101 (1)
   
Financial Statements from the Quarterly Report on Form
 
10-Q
 
of the Company for the three months ended June 30, 2019, formatted in XBRL: (i) Consolidated Balance Sheets at June 30, 2019 (Unaudited) and December 31, 2018; (ii) Consolidated Statements of Operations and Comprehensive Income for the three and six months ended June 30, 2019 and June 30, 2018 (Unaudited); (iii) Consolidated Statements of Changes in Stockholders’ Equity for the three and six months ended June 30, 2019 and June 30, 2018 (Unaudited) (iv) Consolidated Statements of Cash Flows for the six months ended June 30, 2019 and June 30, 2018 (Unaudited); and (v) Notes to Consolidated Financial Statements, as blocks of text and in detail.
         
 
101.SCH (1)
   
Inline XBRL Taxonomy Extension Schema Document
         
 
101.CAL (1)
   
Inline XBRL Taxonomy Extension Calculation Linkbase Document
         
 
101.DEF (1)
   
Inline XBRL Taxonomy Extension Definition Linkbase Document
         
 
101.LAB (1)
   
Inline XBRL Taxonomy Extension Label Linkbase Document
         
 
101.PRE (1)
   
Inline XBRL Taxonomy Extension Presentation Linkbase Document
         
 
104 (1)
   
Cover Page Interactive Data File (formatted as inline XBRL with applicable taxonomy extension information contained in Exhibits 101.*)
 
 
(1) Filed herewith.


59
 
 
Table of Contents
 
SIGNATURE
Pursuant to the requirements of the Securities Exchange Act of 1934, the registrant has duly caused this Report to be signed on its behalf by the undersigned thereunto duly authorized on this 31
st
day of July 2019.
     
WISDOMTREE INVESTMENTS, INC.
     
By:
 
/s/ Jonathan Steinberg
 
Jonathan Steinberg
 
President and Chief Executive Officer
(Principal Executive Officer)
 
WISDOMTREE INVESTMENTS, INC.
     
By:
 
/s/ Amit Muni
 
Amit Muni
 
Chief Financial Officer
(Principal Financial Officer)
 
WISDOMTREE INVESTMENTS, INC.
     
By:
 
/s/ Bryan Edmiston
 
Bryan Edmiston
 
Chief Accounting Officer
(Principal Accounting Officer)


60