Industry Developments
Custodial Platforms
Recently, several of the largest custodial platforms and online brokerage firms announced their decision to eliminate trading commissions for ETFs. Our arrangements with these platforms had offered us preferred or exclusive access for our products, enabling investors to purchase our ETFs without paying commissions. While exclusivity is no longer available, the elimination of commissions removes a component of trading costs previously affecting ETFs and is therefore a positive development for the ETF industry. ETF sponsors are also now better positioned to target access to all platforms, thereby creating additional opportunities. We expect cost savings going forward from the elimination of these arrangements.
ETF Rule Approved
On September 26, 2019, the SEC approved Rule
6c-11,
commonly referred to as the “ETF Rule,” which is designed to simplify the rules governing ETFs. The ETF Rule includes several items that will level the playing field for ETF issuers, including removing the need to file for exemptive relief in order to issue ETFs, removing the regulatory distinction between actively managed and index-based ETFs (including removing specific requirements associated with self-indexed ETFs) and making custom baskets available to all issuers subject to policy and procedure requirements. The rule also requires issuers to disclose a number of items in a standardized format on daily basis, including portfolio holdings and median bid-ask
spread over the prior 30-day
period. The rule will go into effect in December 2019 and issuers have one year to implement all necessary changes.While the ETF Rule will further lower barriers to entry, we view the passage of the rule positively. The ETF Rule will allow for enhancements in indexes that we create and for broader product development opportunities associated with ETFs tracking such indexes. Wider use of custom baskets will promote efficiency in the creation and redemption process, which could lead to greater tax efficiency and liquidity and tighter
bid-ask
spreads. Enhanced and uniform data disclosures also will increase transparency and help investors understand the costs and benefits of investing in ETFs.Assets Under Management
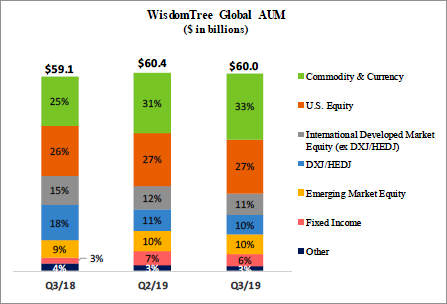
WisdomTree ETPs
The chart below sets forth the asset mix of our ETPs at September 30, 2018, June 30, 2019 and September 30, 2019:
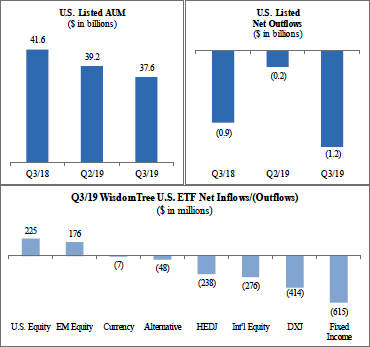
Over the last few years, concentrations in HEDJ, our European equity ETF which hedges exposure to the euro, and DXJ, our Japanese equity ETF which hedges exposure to the yen, have declined dramatically as negative investor sentiment toward these products has led to considerable net outflows. Recently, these outflows have largely been offset by strong inflows into our commodity, fixed income, U.S. equity and emerging markets products. During the nine months ended September 30, 2019 net inflows were $0.2 billion, or $2.7 billion excluding outflows from HEDJ and DXJ.
37