ITEM 2. |
MANAGEMENT’S DISCUSSION AND ANALYSIS OF FINANCIAL CONDITION AND RESULTS OF OPERATIONS |
The following discussion and analysis of our financial condition and results of operations should be read together with our consolidated financial statements and the related notes and the other financial information included elsewhere in this Report. In addition to historical consolidated financial information, the following discussion contains forward-looking statements that reflect our plans, estimates and beliefs. Our actual results could differ materially from those discussed in the forward-looking statements. Factors that could cause or contribute to these differences include those discussed below. For a more complete description of the risks noted above and other risks that could cause our actual results to materially differ from our current expectations, please see Item 1A “Risk Factors” in this Report and in our Annual Report on Form
10-K
for the fiscal year ended December 31, 2019. We assume no obligation to update or revise publicly any forward-looking statements, whether as a result of new information, future events or otherwise, unless required by law. Executive Summary
Introduction
We are the only publicly-traded asset management company that focuses exclusively on exchange-traded products, or ETPs, and are a leading global ETP sponsor based on assets under management, or AUM, with AUM of $50.3 billion globally as of March 31, 2020. An ETP is a pooled investment vehicle that holds a basket of securities, financial instruments or other assets and generally seeks to track (index-based) or outperform (actively managed) the performance of a broad or specific equity, fixed income or alternatives market segment, commodity or currency (or an inverse or multiple thereof). ETPs are listed on an exchange with their shares traded in the secondary market at market prices, generally at approximately the same price as the net asset value of their underlying components. ETP is an umbrella term that includes exchange-traded funds, or ETFs, exchange-traded notes and exchange-traded commodities.
Our family of ETFs includes funds that track our own indexes, funds that track third-party indexes and actively managed funds. Most of our equity-based funds employ a fundamentally weighted investment methodology, which weights securities based on factors such as dividends, earnings or investment factors, whereas most other ETF industry indexes use a capitalization weighted methodology. We distribute our ETFs through all major channels within the asset management industry, including brokerage firms, registered investment advisers, institutional investors, private wealth managers and discount brokers primarily through our sales force. Our sales efforts are not directed towards the retail segment but rather are directed towards financial or investment advisers that act as intermediaries between the
end-client
and us.We focus on creating ETFs for investors that offer thoughtful innovation, smart engineering and redefined investing. We have launched many
first-to-market
ETFs and pioneered alternative weighting methods commonly referred to as “smart beta.” However, our U.S. listed ETFs are not beta, but rather an investment approach we call “Modern Alpha,” which combines the outperformance potential of active management with the benefits of passive management to offer investors cost-effective funds that are built to perform.We strive to deliver a better investing experience through innovative solutions. Continued investments in technology-enabled services and our Advisor Solutions program, which includes portfolio construction, asset allocation, practice management services and digital tools for financial advisors, are meant to differentiate us in the market, expand our distribution and further enhance our relationships with financial advisors.
We were incorporated under the laws of the state of Delaware on September 19, 1985 as Financial Data Systems, Inc. and ultimately renamed WisdomTree Investments, Inc. on September 6, 2005.
COVID-19
Impact on our Business During the first quarter of 2020, market declines arising from the
COVID-19
pandemic adversely impacted the market performance of most financial assets and sectors of the economy, including the AUM that we manage. During the height of the market volatility in March 2020, we experienced a 16% decline in our AUM resulting from market depreciation and $1.6 billion of net outflows. These pressures contributed to a corresponding decline in our operating results which, if further eroded, could adversely impact our liquidity as our credit facility includes a financial covenant that requires we maintain compliance with a leverage test. At March 31, 2020, we were in compliance with this covenant and we continue to be in compliance as of the date of this Report.The market rebound in April 2020 led to a partial recovery of our AUM. Our AUM increased 8% from $50.3 billion at March 31, 2020 to $54.5 billion at May 4, 2020. While this improvement is meaningful, we will continue to monitor our compliance with the financial covenants under our credit facility and are actively exploring refinancing and extension alternatives in advance of the maturity date in April 2021. Our available liquidity as disclosed in the section entitled “Liquidity and Capital Resources” was $74.7 million, which is available to reduce our outstanding debt, if necessary.
31
The CARES Act was enacted on March 27, 2020 in response to the
COVID-19
pandemic, which provided financial assistance under various programs to help companies cope with economic hardships. We did not draw upon any available financial assistance afforded by the CARES Act. Throughout the course of the pandemic, we have continued to operate our business without disruption.Cost Control Measures
Given the significant decline in our AUM and the current overall operating environment, we are managing a reduction in our expenses. Certain of our variable expenses that are tied to average AUM will decline, such as our fund related operating costs and fees we pay for third party distribution platforms. In addition, we expect a significant decline in our incentive compensation. We also expect to spend less on discretionary expenses such as marketing, sales and overhead expenses for managing our business.
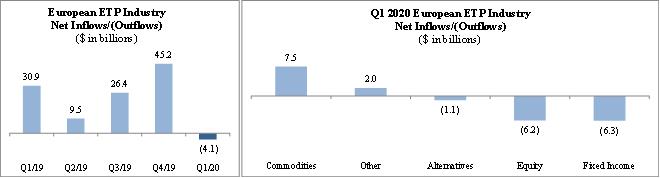
Recent Developments in our Commodity Product Suite
Recent market developments and price volatility around oil has led to the generation of over $3.0 billion of net inflows into our European listed oil related products, with greater than 60% of those net inflows into one product, WisdomTree Crude Oil (CRUD), predominantly in the month of April. Because of the recent unprecedented decline in oil prices, three of our inverse and leveraged oil products were terminated as they hit underlying pricing thresholds. In order to manage counterparty risk, we temporarily halted creations into three products, including CRUD. Therefore, we will not experience further inflows into CRUD or the other two products until the creation halt is lifted, which we anticipate will occur as soon as possible after the counterparty risk exposures are mitigated.
Assets Under Management
WisdomTree ETPs
We offer ETPs covering equity, commodity, fixed income,
leveraged-and-inverse,
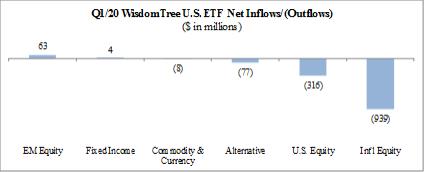
currency and alternative strategies. The chart below sets forth the asset mix of our ETPs at March 31, 2019, December 31, 2019 and March 31, 2020: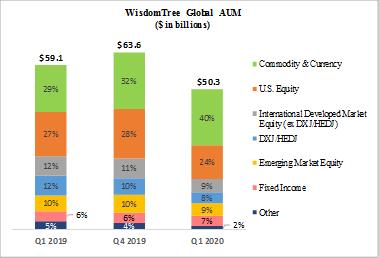
During the three months ended March 31, 2020, market declines arising from the
COVID-19
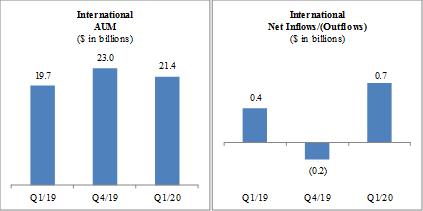
pandemic adversely impacted the market performance of most financial assets and sectors of the economy, including the AUM that we manage. Our AUM declined 20.9% from the prior quarter primarily due to market depreciation.Market Environment
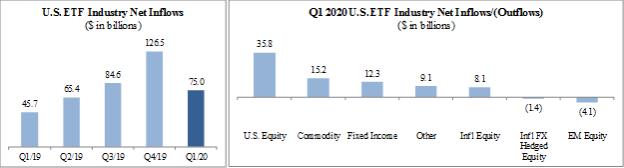
The
COVID-19
pandemic had a profound impact on the global markets during the quarter. Equity securities across all developed and emerging markets fell as the global economy was shut down to stem the spread of the virus. Government bond yields also fell and gold prices appreciated as investors sought out assets perceived as lower risk.During the first quarter of 2020, the S&P 500 declined 19.6%, MSCI EAFE (local currency) declined 20.4%, MSCI Emerging Markets Index (U.S. dollar) declined 25.2%, while gold prices rose 5.6%. In addition, the European and Japanese equities markets both depreciated with the MSCI EMU Index and MSCI Japan Index declining 23.6% and 17.2%, respectively, in local currency terms for the quarter. Also, the U.S. dollar strengthened 1.3% and 5.5% versus the euro and British pound, respectively, while weakening 1.1% versus the Japanese yen during the quarter.
32