ITEM 2. |
MANAGEMENT’S DISCUSSION AND ANALYSIS OF FINANCIAL CONDITION AND RESULTS OF OPERATIONS |
The following discussion and analysis of our financial condition and results of operations should be read together with our consolidated financial statements and the related notes and the other financial information included elsewhere in this Report. In addition to historical consolidated financial information, the following discussion contains forward-looking statements that reflect our plans, estimates and beliefs. Our actual results could differ materially from those discussed in the forward-looking statements. Factors that could cause or contribute to these differences include those discussed below. For a more complete description of the risks noted above and other risks that could cause our actual results to materially differ from our current expectations, please see Item 1A “Risk Factors” in this Report and in our Annual Report on Form
10-K
for the fiscal year ended December 31, 2019 and Quarterly Report on Form 10-Q
for the quarter ended March 31, 2020. We assume no obligation to update or revise publicly any forward-looking statements, whether as a result of new information, future events or otherwise, unless required by law. Executive Summary
Introduction
We are the only publicly-traded asset management company that focuses exclusively on exchange-traded products, or ETPs, and are a leading global ETP sponsor based on assets under management, or AUM, with AUM of $57.6 billion globally as of June 30, 2020. An ETP is a pooled investment vehicle that holds a basket of securities, financial instruments or other assets and generally seeks to track (index-based) or outperform (actively managed) the performance of a broad or specific equity, fixed income or alternatives market segment, commodity or currency (or an inverse or multiple thereof). ETPs are listed on an exchange with their shares traded in the secondary market at market prices, generally at approximately the same price as the net asset value of their underlying components. ETP is an umbrella term that includes exchange-traded funds, or ETFs, exchange-traded notes and exchange-traded commodities.
Our family of ETFs includes funds that track our own indexes, funds that track third-party indexes and actively managed funds. Most of our equity-based funds employ a fundamentally weighted investment methodology, which weights securities based on factors such as dividends, earnings or investment factors, whereas most other ETF industry indexes use a capitalization weighted methodology. We distribute our ETFs through all major channels within the asset management industry, including brokerage firms, registered investment advisers, institutional investors, private wealth managers and discount brokers primarily through our sales force. Our sales efforts are not directed towards the retail segment but rather are directed towards financial or investment advisers that act as intermediaries between the
end-client
and us.We focus on creating ETFs for investors that offer thoughtful innovation, smart engineering and redefined investing. We have launched many ETFs and pioneered alternative weighting methods commonly referred to as “smart beta.” However, our U.S. listed ETFs are not beta, but rather an investment approach we call “Modern Alpha,” which combines the outperformance potential of active management with the benefits of passive management to offer investors cost-effective funds that are built to perform.
first-to-market
We strive to deliver a better investing experience through innovative solutions. Continued investments in technology-enabled services and our Advisor Solutions program, which includes portfolio construction, asset allocation, practice management services and digital tools for financial advisors, are meant to differentiate us in the market, expand our distribution and further enhance our relationships with financial advisors.
We were incorporated under the laws of the state of Delaware on September 19, 1985 as Financial Data Systems, Inc. and ultimately renamed WisdomTree Investments, Inc. on September 6, 2005.
COVID-19
Impact on our Business Our operating revenues are directly correlated with the AUM that we manage. Our average AUM and revenues declined 6.9% and 9.0% respectively, from the prior quarter due to the severity of the market declines in late March 2020 arising from the
COVID-19
pandemic. While our average AUM declined, our ending AUM increased 14.6% from $50.3 billion at March 31, 2020 to $57.6 billion at June 30, 2020 due to the market rebound during the current quarter. We continue to benefit from market appreciation as our AUM further increased 5.9% from June 30, 2020 to July 31, 2020.The sustainability of these recent trends is highly uncertain and we are therefore continuing to manage our expenses, in particular our discretionary spending, such as incentive compensation, marketing, sales and overhead expenses.
The pandemic has not adversely impacted our capital management strategy. In June 2020, we issued $150.0 million in aggregate principal amount of 4.25% Convertible Senior Notes due 2023 (See Note 13 to our Consolidated Financial Statements), repaid our debt previously outstanding and terminated our former credit facility. We are therefore no longer subject to compliance with financial covenants under our former credit facility or limitations on stock repurchases and dividend payments. In connection with the issuance of our convertible notes, we used $23.9 million of the proceeds to repurchase approximately 6.4 million shares of our common stock. Additional share repurchases will depend upon our future operating results, available cash on hand and strategic priorities. We are precluded from prepaying principal due on our convertible notes.
33
The CARES Act was enacted on March 27, 2020 in response to the
COVID-19
pandemic, which provided financial assistance under various programs to help companies cope with economic hardships. We did not apply for any financial assistance afforded by the CARES Act. Throughout the course of the pandemic, our business has been operating remotely without disruption.Commodity Product Suite Update
During the first half of 2020, in order to manage counterparty and concentration risk, we temporarily halted creations by authorized participants into certain of our European listed oil related products, including WisdomTree WTI Crude Oil ETC (CRUD), due to the unprecedented volatility in oil prices and related operational challenges. The creation halt on CRUD was lifted on July 1, 2020 and we have taken steps to mitigate risk exposure for CRUD going forward, including implementing a zero floor so that the product automatically terminates if the net asset value goes to zero and changing to a more diversified index to reduce concentration to a single futures contract. We are continuing to explore and implement ways to mitigate risk on four other oil products for which creations remain halted.
Assets Under Management
WisdomTree ETPs
We offer ETPs covering equity, commodity, fixed income, currency and alternative strategies. The chart below sets forth the asset mix of our ETPs at June 30, 2019, March 31, 2020 and June 30, 2020:
leveraged-and-inverse,
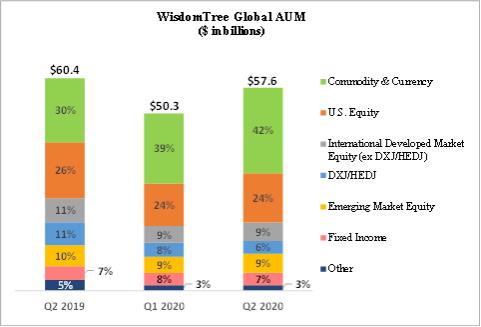
During the three months ended June 30, 2020, we experienced a partial recovery of our AUM which was adversely impacted by severe market declines arising from the
COVID-19
pandemic toward the end of the prior quarter. This recovery was driven principally by market appreciation, resulting in a 14.6% increase of our AUM.Market Environment
During the second quarter of 2020, global financial markets rebounded as lockdown restrictions to combat the
COVID-19
pandemic were eased and various economic stimulus measures were implemented by governments and central banks worldwide. Equity securities across all developed and emerging markets advanced, while government bonds were largely unchanged. Gold prices also appreciated due to the global uncertainty arising from the COVID-19
pandemic.During the second quarter of 2020, the S&P 500 advanced 20.6%, MSCI EAFE (local currency) advanced 12.8%, MSCI Emerging Markets Index (U.S. dollar) advanced 18.2% and gold prices rose 10.0%. In addition, the European and Japanese equities markets both appreciated with the MSCI EMU Index and MSCI Japan Index increasing 17.5% and 11.6%, respectively, in local currency terms for the quarter. Also, the U.S. dollar strengthened 0.6% and 0.3% versus the British pound and Japanese yen, respectively, while weakening 1.7% versus the euro during the quarter.
34
U.S. listed ETF Industry Flows
U.S. listed ETF net flows for the three months ended June 30, 2020 were $135.1 billion. Fixed income and U.S. equity gathered the majority of those flows.
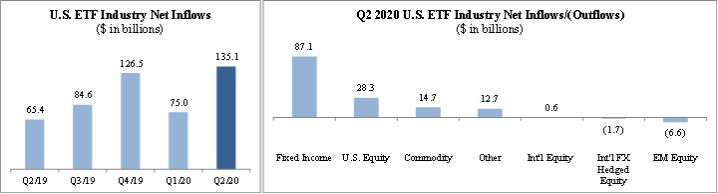
Source: Bloomberg, Investment Company Institute, WisdomTree
European ETP Industry Flows
European ETP net flows were $37.2 billion for the three months ended June 30, 2020. Fixed income gathered the majority of those flows.
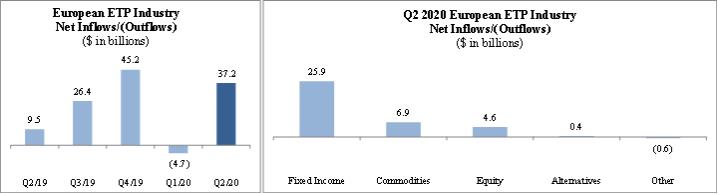
Source: Morningstar
Our Operating and Financial Results
We operate as an ETP sponsor and asset manager providing investment advisory services globally through our subsidiaries in the United States and Europe.
On February 19, 2020, we completed the sale of all of the outstanding shares of our wholly-owned Canadian subsidiary, WisdomTree Asset Management Canada, Inc., or Canadian ETF business, to CI Financial Corp. We received CDN $3.7 million (USD $2.8 million) in cash at closing and will receive additional cash consideration of CDN $2.0 million to $8.0 million, depending on the achievement of certain AUM growth targets over the next three years.
Our Canadian ETF business reported operating losses during the six months ended June 30, 2020 of $0.4 million and during the three and six months ended June 30, 2019 of $0.6 million and $1.4 million, respectively.
35
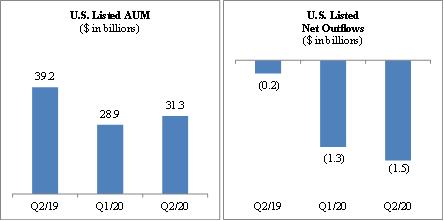
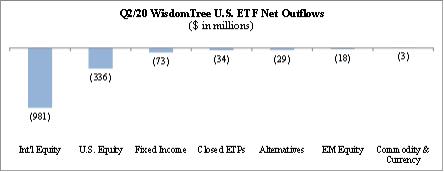
U.S. Listed ETFs
Our U.S. listed ETFs’ AUM increased from $28.9 billion at March 31, 2020 to $31.3 billion at June 30, 2020 due to market appreciation, partly offset by net outflows.
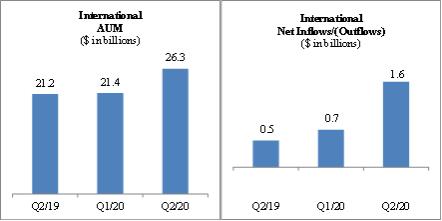
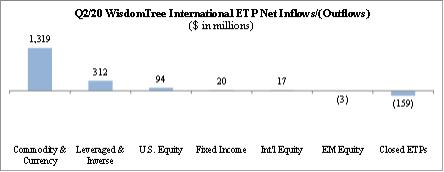
International Listed ETPs
Our international ETPs’ AUM increased from $21.4 billion at March 31, 2020 to $26.3 billion at June 30, 2020 due to market appreciation and net inflows.
36
Consolidated Operating Results
The following table sets forth our revenues and net income/(loss) for the most recent five quarters:
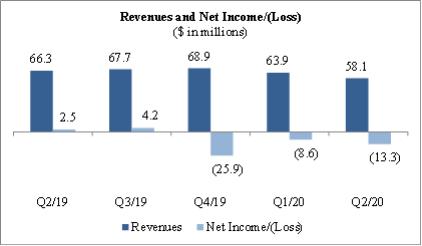
| • | Revenues |
| • | Operating Expenses |
| • | Other Income/(Expenses) |
| • | Net (loss)/income |
37