Planned Reduction in Office Footprint
Throughout the
COVID-19
pandemic, we have been operating our business remotely without disruption. The virtual work environment has led to efficiencies, increased transparency and further collaboration throughout our business. We have therefore decided to adopt a “remote first” philosophy with plans to significantly reduce our office footprints in New York and London.We are planning to market our New York office space for sublease, allow our London office lease to expire and seek reduced space in both locations. In connection with these actions, we anticipate recording an impairment charge of $9.0 million to $12.0 million. We also anticipate that our reduced office footprint will achieve $3.0 million to $4.0 million of annual cost savings.
The timing of the impairment charge and realization of cost savings is highly dependent on our ability to secure a subtenant which we are estimating may occur by late 2021 or early 2022. The ultimate magnitude of these estimates is subject to market rent received and the duration of the sublease, market rents paid for new space, the actual amount of direct costs incurred and the discount rate used remeasure the carrying value of assets associated with our current office space, amongst other factors.
Assets Under Management
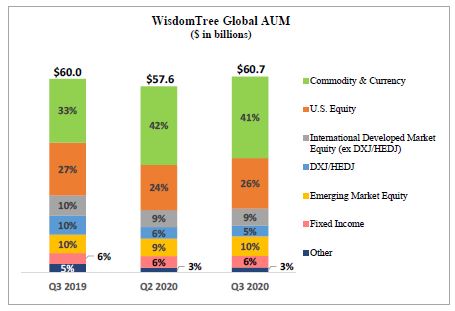
WisdomTree ETPs
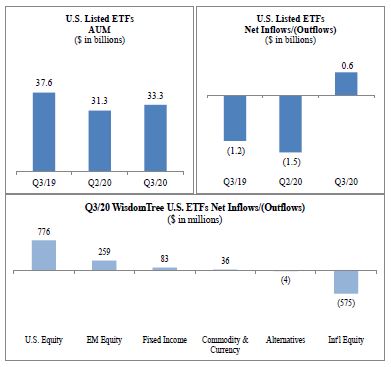
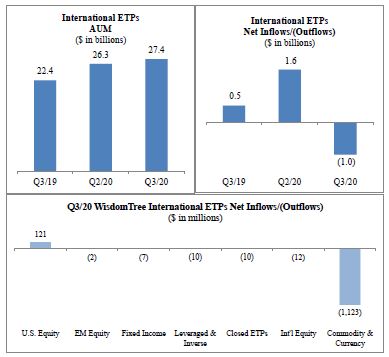
We offer ETPs covering equity, commodity, fixed income, currency and alternative strategies. The chart below sets forth the asset mix of our ETPs at September 30, 2019, June 30, 2020 and September 30, 2020:
leveraged-and-inverse,
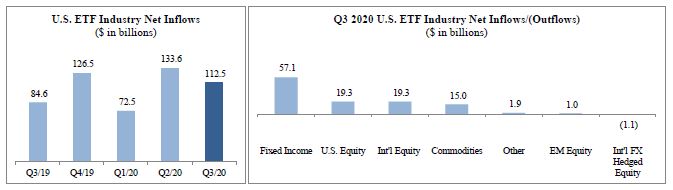
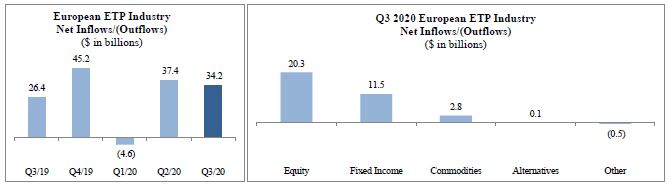
Market Environment
During the third quarter of 2020, the United States and Asian financial markets performed favorably while the Eurozone market was largely unchanged. Economic stimulus measures and loose monetary policies continue to counterbalance the adverse effect of the
COVID-19
pandemic on the global economy. Equity securities across all developed and emerging markets advanced, while government bonds were largely unchanged. Gold prices also appreciated during the quarter.During the third quarter of 2020, the S&P 500 advanced 8.9%, MSCI EAFE (local currency) advanced 1.3%, MSCI Emerging Markets Index (U.S. dollar) advanced 9.7% and gold prices rose 6.7%. In addition, the European and Japanese equities markets both appreciated with the MSCI EMU Index and MSCI Japan Index increasing 0.2% and 4.7%, respectively, in local currency terms for the quarter. Also, the U.S. dollar weakened 4.3%, 4.1% and 1.7% versus the British pound, Euro and Japanese yen, respectively.
34