QUARTERLY REPORT PURSUANT TO SECTION 13 OR 15(d) OF THE SECURITIES EXCHANGE ACT OF 1934 |
TRANSITION REPORT PURSUANT TO SECTION 13 OR 15(d) OF THE SECURITIES EXCHANGE ACT OF 1934 |
(State or other jurisdiction of incorporation or organization) |
(IRS Employer Identification No.) | |
th Streetrd Floor |
||
(Address of principal executive offices) |
(Zip Code) |
Title of each class |
Trading Symbol(s) |
Name of each exchange on which registered | ||
☒ |
Accelerated filer | ☐ | ||||
Non-accelerated filer |
☐ | Smaller reporting company | ||||
Emerging growth company |
WISDOMTREE, INC.
Form 10-Q
For the Quarterly Period Ended March 31, 2023
TABLE OF CONTENTS
PART I: FINANCIAL INFORMATION |
4 | |||||
ITEM 1. |
FINANCIAL STATEMENTS | 4 | ||||
ITEM 2. |
MANAGEMENT’S DISCUSSION AND ANALYSIS OF FINANCIAL CONDITION AND RESULTS OF OPERATIONS | 33 | ||||
ITEM 3. |
QUANTITATIVE AND QUALITATIVE DISCLOSURES ABOUT MARKET RISK | 50 | ||||
ITEM 4. |
CONTROLS AND PROCEDURES | 51 | ||||
PART II: OTHER INFORMATION |
51 | |||||
ITEM 1. |
LEGAL PROCEEDINGS | 51 | ||||
ITEM 1A. |
RISK FACTORS | 51 | ||||
ITEM 2. |
UNREGISTERED SALES OF EQUITY SECURITIES AND USE OF PROCEEDS | 51 | ||||
ITEM 3. |
DEFAULTS UPON SENIOR SECURITIES | 52 | ||||
ITEM 4. |
MINE SAFETY DISCLOSURES | 52 | ||||
ITEM 5. |
OTHER INFORMATION | 52 | ||||
ITEM 6. |
EXHIBITS | 53 |
Unless otherwise indicated, references to “the Company,” “we,” “us,” “our” and “WisdomTree” mean WisdomTree, Inc. and its subsidiaries.
WisdomTree®, WisdomTree Prime™ and Modern Alpha® are trademarks of WisdomTree, Inc. in the United States and in other countries. All other trademarks are the property of their respective owners.
2
• | anticipated trends, conditions and investor sentiment in the global markets and exchange-traded products, or ETPs; |
• | anticipated levels of inflows into and outflows out of our ETPs; |
• | our ability to deliver favorable rates of return to investors; |
• | competition in our business; |
• | whether we will experience future growth; |
• | our ability to develop new products and services; |
• | our ability to maintain current vendors or find new vendors to provide services to us at favorable costs; |
• | our ability to successfully implement our strategy related to digital assets and blockchain-enabled financial services, including WisdomTree Prime ™ , and achieve its objectives; |
• | our ability to successfully operate and expand our business in non-U.S. markets; |
• | the effect of laws and regulations that apply to our business; and |
• | actions of activist stockholders. |
ITEM 1. |
FINANCIAL STATEMENTS |
March 31, 2023 |
December 31, 2022 |
|||||||
(unaudited) |
||||||||
Assets |
||||||||
Current assets: |
||||||||
Cash and cash equivalents (Note 3) |
$ | $ | ||||||
Financial instruments owned, at fair value (including $ |
||||||||
Accounts receivable (including $ |
||||||||
Prepaid expenses |
||||||||
Income taxes receivable |
||||||||
Other current assets |
||||||||
Total current assets |
||||||||
Fixed assets, net |
||||||||
Indemnification receivable (Note 20) |
||||||||
Securities held-to-maturity |
||||||||
Deferred tax assets, net (Note 20) |
||||||||
Investments (Note 7) |
||||||||
Right of use assets—operating leases (Note 12) |
||||||||
Goodwill (Note 22) |
||||||||
Intangible assets, net (Note 22) |
||||||||
Other noncurrent assets |
||||||||
Total assets |
$ | $ | ||||||
Liabilities and stockholders’ equity |
||||||||
Liabilities |
||||||||
Current liabilities: |
||||||||
Convertible notes—current (Note 10) |
$ | $ | ||||||
Fund management and administration payable |
||||||||
Deferred consideration—gold payments (Note 9) |
||||||||
Compensation and benefits payable |
||||||||
Income taxes payable |
||||||||
Operating lease liabilities (Note 12) |
||||||||
Accounts payable and other liabilities |
||||||||
Total current liabilities |
||||||||
Convertible notes (Note 10) |
||||||||
Deferred consideration—gold payments (Note 9) |
||||||||
Operating lease liabilities (Note 12) |
||||||||
Other noncurrent liabilities (Note 20) |
||||||||
Total liabilities |
||||||||
Preferred stock—Series A Non-Voting Convertible, par value $ |
||||||||
Contingencies (Note 13) |
||||||||
Stockholders’ equity |
||||||||
Preferred stock, par value $ |
||||||||
Common stock, par value $ |
||||||||
Additional paid-in capital |
||||||||
Accumulated other comprehensive loss |
( |
( |
||||||
Retained earnings |
||||||||
Total stockholders’ equity |
||||||||
Total liabilities and stockholders’ equity |
$ | |
$ | |||||
Three Months Ended March 31, | ||||||||
2023 |
2022 | |||||||
Operating Revenues: |
||||||||
Advisory fees |
$ | $ | ||||||
Other income |
||||||||
|
|
|
|
|
| |||
Total revenues |
||||||||
|
|
|
|
|
| |||
Operating Expenses: |
||||||||
Compensation and benefits |
||||||||
Fund management and administration |
||||||||
Marketing and advertising |
||||||||
Sales and business development |
||||||||
Contractual gold payments (Note 9) |
||||||||
Professional fees |
||||||||
Occupancy, communications and equipment |
||||||||
Depreciation and amortization |
||||||||
Third-party distribution fees |
||||||||
Other |
||||||||
|
|
|
|
|
| |||
Total operating expenses |
||||||||
|
|
|
|
|
| |||
Operating income |
||||||||
Other Income/(Expenses): |
||||||||
Interest expense |
( |
) | ( |
) | ||||
Gain/(loss) on revaluation of deferred consideration—gold payments (Note 9) |
( |
) | ||||||
Interest income |
||||||||
Impairments (Note 7) |
( |
) | ||||||
Loss on extinguishment of convertible notes (Note 10) |
( |
) | ||||||
Other losses, net |
( |
) | ( |
) | ||||
|
|
|
|
|
| |||
Income/(loss) before income taxes |
( |
) | ||||||
Income tax expense/(benefit) |
( |
) | ||||||
|
|
|
|
|
| |||
Net income/(loss) |
$ | $ | ( |
) | ||||
|
|
|
|
|
| |||
Earnings/(loss) per share—basic |
$ | $ | ( |
) | ||||
|
|
|
|
|
| |||
Earnings/(loss) per share—diluted |
$ | $ | ( |
) | ||||
|
|
|
|
|
| |||
Weighted-average common shares—basic |
|
|||||||
|
|
|
|
|
| |||
Weighted-average common shares—diluted |
|
|||||||
|
|
|
|
|
| |||
Cash dividends declared per common share |
$ | $ | ||||||
|
|
|
|
|
|
Three Months Ended March 31, |
||||||||
2023 |
2022 |
|||||||
Net income/(loss) |
$ | $ | ( |
|||||
Other comprehensive income/(loss) |
||||||||
Foreign currency translation adjustment, net of income taxes |
( |
|||||||
|
|
|
|
|||||
Other comprehensive income/(loss) |
( |
|||||||
|
|
|
|
|||||
Comprehensive income/(loss) |
$ | |
$ | ( |
||||
|
|
|
|
For the Three Months Ended March 31, 2023 | ||||||||||||||||||||||||
Common Stock |
Additional Paid-In Capital |
Accumulated Other Comprehensive Loss |
Retained Earnings/ (Accumulated Deficit) |
Total | ||||||||||||||||||||
Shares Issued |
Par Value | |||||||||||||||||||||||
Balance—January 1, 2023 |
$ | $ | $ | ( |
) | $ | $ | |||||||||||||||||
Restricted stock issued and vesting of restricted stock units, net |
( |
) | ||||||||||||||||||||||
Shares repurchased |
( |
) | ( |
) | ( |
) | ( |
) | ||||||||||||||||
Stock-based compensation |
— | |||||||||||||||||||||||
Other comprehensive income |
— | |||||||||||||||||||||||
Dividends |
— | ( |
) | ( |
) | |||||||||||||||||||
Net income |
— | |||||||||||||||||||||||
Balance—March 31, 2023 |
|
$ | |
$ | |
$ | ( |
) | $ | |
$ | |
||||||||||||
For the Three Months Ended March 31, 2022 | ||||||||||||||||||||||||
Common Stock |
Additional Paid-In Capital |
Accumulated Other Comprehensive Income |
Accumulated Deficit |
Total | ||||||||||||||||||||
Shares Issued |
Par Value | |||||||||||||||||||||||
Balance—January 1, 2022 |
$ | $ | $ | $ | ( |
) | $ | |||||||||||||||||
Restricted stock issued and vesting of restricted stock units, net |
( |
) | ||||||||||||||||||||||
Shares repurchased |
( |
) | ( |
) | ( |
) | ( |
) | ||||||||||||||||
Stock-based compensation |
— | |||||||||||||||||||||||
Other comprehensive loss |
— | ( |
) | ( |
) | |||||||||||||||||||
Dividends |
— | ( |
) | ( |
) | |||||||||||||||||||
Net loss |
— | ( |
) | ( |
) | |||||||||||||||||||
Balance—March 31, 2022 |
|
$ | |
$ | |
$ | |
$ | ( |
) | $ | |
||||||||||||
Three Months Ended March 31, | ||||||||
2023 |
2022 | |||||||
Cash flows from operating activities: |
||||||||
Net income/(loss) |
$ | $ | ( |
) | ||||
Adjustments to reconcile net income/(loss) to net cash used in operating activities: |
||||||||
(Gain)/loss on revaluation of deferred consideration—gold payments |
( |
) | ||||||
Advisory and license fees paid in gold, other precious metals and cryptocurrency |
( |
) | ( |
) | ||||
Loss on extinguishment of convertible notes |
||||||||
Impairments |
||||||||
Deferred income taxes |
||||||||
Stock-based compensation |
||||||||
Contractual gold payments |
||||||||
Losses on investments |
||||||||
(Gains)/losses on financial instruments owned, at fair value |
( |
) | ||||||
Amortization of issuance costs—convertible notes |
||||||||
Amortization of right of use asset |
||||||||
Depreciation and amortization |
||||||||
Changes in operating assets and liabilities: |
||||||||
Accounts receivable |
( |
) | ( |
) | ||||
Prepaid expenses |
( |
) | ( |
) | ||||
Gold and other precious metals |
||||||||
Other assets |
( |
) | ||||||
Intangibles—software development |
( |
) | ||||||
Fund management and administration payable |
||||||||
Compensation and benefits payable |
( |
) | ( |
) | ||||
Income taxes payable |
( |
) | ( |
) | ||||
Operating lease liabilities |
( |
) | ( |
) | ||||
Accounts payable and other liabilities |
||||||||
|
|
|
|
|
| |||
Net cash used in operating activities |
( |
) | ( |
) | ||||
|
|
|
|
|
| |||
Cash flows from investing activities: |
||||||||
Purchase of financial instruments owned, at fair value |
( |
) | ( |
) | ||||
Purchase of investments |
( |
) | ||||||
Purchase of fixed assets |
( |
) | ( |
) | ||||
Proceeds from the sale of financial instruments owned, at fair value |
||||||||
Proceeds from held-to-maturity |
||||||||
|
|
|
|
|
| |||
Net cash used in investing activities |
( |
) | ( |
) | ||||
|
|
|
|
|
| |||
Cash flows from financing activities: |
||||||||
Repurchase of convertible notes (See Note 10) |
( |
) | ||||||
Dividends paid |
( |
) | ( |
) | ||||
Shares repurchased |
( |
) | ( |
) | ||||
Convertible notes issuance costs |
( |
) | ||||||
Proceeds from the issuance of convertible notes (Note 10) |
||||||||
|
|
|
|
|
| |||
Net cash used in financing activities |
( |
) | ( |
) | ||||
|
|
|
|
|
| |||
Increase/(decrease) in cash flow due to changes in foreign exchange rate |
( |
) | ||||||
|
|
|
|
|
| |||
Net decrease in cash and cash equivalents |
( |
) | ( |
) | ||||
Cash and cash equivalents—beginning of year |
||||||||
|
|
|
|
|
| |||
Cash and cash equivalents—end of period |
$ | $ | ||||||
|
|
|
|
|
| |||
Supplemental disclosure of cash flow information: |
||||||||
Cash paid for income taxes |
$ | $ | ||||||
|
|
|
|
|
| |||
Cash paid for interest |
$ | $ | |
|||||
|
|
|
|
|
|
• | WisdomTree Asset Management, Inc. non-consolidated Delaware statutory trust registered with the SEC as an open-end management investment company. The Company has licensed to WTT the use of certain of its own indexes on an exclusive basis for the WisdomTree ETFs in the U.S. |
• | WisdomTree Management Jersey Limited leveraged-and-inverse |
• | WisdomTree Multi Asset Management Limited non-consolidated public limited company domiciled in Ireland. |
• | WisdomTree Management Limited non-consolidated public limited company domiciled in Ireland. |
• | WisdomTree UK Limited |
• | WisdomTree Europe Limited |
• | WisdomTree Ireland Limited |
• | WisdomTree Digital Commodity Services, LLC |
• | WisdomTree Digital Management, Inc. (“WT Digital Management”) is a New York based investment adviser registered with the SEC, providing investment advisory and other management services to the WisdomTree Digital Trust (“WTDT”) and WisdomTree Digital Funds. The WisdomTree Digital Funds are issued in the U.S. by WTDT. WTDT is a Delaware statutory trust registered with the SEC as an open-end management investment company. Each Digital Fund will use blockchain technology to maintain a secondary record of its shares on one or more blockchains (e.g., Stellar or Ethereum), but will not directly or indirectly invest in any assets that rely on blockchain technology, such as cryptocurrencies. |
• | WisdomTree Digital Movement, Inc ™ to facilitate such activity. |
• | WisdomTree Securities, Inc |
Equipment |
||||
Internally-developed software |
Level 1 | – | Quoted prices for identical instruments in active markets. | ||
Level 2 | – | Quoted prices for similar instruments in active markets; quoted prices for identical or similar instruments in markets that are not active; and model-derived valuations whose inputs are observable or whose significant value drivers are observable. | ||
Level 3 | – | Instruments whose significant drivers are unobservable. |
March 31, 2023 |
||||||||||||||||
Total |
Level 1 |
Level 2 |
Level 3 |
|||||||||||||
Assets: |
||||||||||||||||
Recurring fair value measurements: |
||||||||||||||||
Cash equivalents |
$ |
$ |
$ |
$ |
||||||||||||
Financial instruments owned, at fair value |
||||||||||||||||
ETFs |
||||||||||||||||
U.S. treasuries |
||||||||||||||||
Pass-through GSEs |
||||||||||||||||
Other assets—seed capital (WisdomTree blockchain-enabled funds) |
||||||||||||||||
U.S. treasuries |
||||||||||||||||
Equities |
||||||||||||||||
Fixed income |
||||||||||||||||
Other |
||||||||||||||||
Investments in Convertible Notes |
||||||||||||||||
Securrency, Inc.—convertible note (Note 7) |
||||||||||||||||
Fnality International Limited—convertible note (Note 7) |
||||||||||||||||
Total |
$ |
$ |
$ |
$ |
||||||||||||
March 31, 2023 |
||||||||||||||||
Total |
Level 1 |
Level 2 |
Level 3 |
|||||||||||||
Non-recurring fair value measurements: |
||||||||||||||||
Securrency, Inc.—Series A convertible preferred stock (1) |
$ |
$ |
$ |
$ |
||||||||||||
Liabilities: |
||||||||||||||||
Recurring fair value measurements: |
||||||||||||||||
Deferred consideration (Note 9) |
$ |
$ |
$ |
$ |
||||||||||||
December 31, 2022 |
||||||||||||||||
Total |
Level 1 |
Level 2 |
Level 3 |
|||||||||||||
Assets: |
||||||||||||||||
Recurring fair value measurements: |
||||||||||||||||
Cash equivalents |
$ |
$ |
$ |
$ |
||||||||||||
Financial instruments owned, at fair value |
||||||||||||||||
ETFs |
||||||||||||||||
U.S. treasuries |
||||||||||||||||
Pass-through GSEs |
||||||||||||||||
Corporate bonds |
||||||||||||||||
Other assets—seed capital (WisdomTree blockchain-enabled funds) |
||||||||||||||||
Investments in Convertible Notes |
||||||||||||||||
Securrency, Inc.—convertible note (Note 7) |
||||||||||||||||
Fnality International Limited—convertible note (Note 7) |
||||||||||||||||
Total |
$ |
$ |
$ |
$ |
||||||||||||
Non-recurring fair value measurements: |
||||||||||||||||
Other investments (2) |
$ |
$ |
$ |
$ |
||||||||||||
Liabilities: |
||||||||||||||||
Recurring fair value measurements: |
||||||||||||||||
Deferred consideration (Note 9) |
$ |
$ |
$ |
$ |
||||||||||||
Three Months Ended, March 31, |
||||||||||
2023 |
2022 |
|||||||||
Investments in Convertible Notes (Note 7) |
||||||||||
Beginning balance |
$ | $ | ||||||||
Purchases |
||||||||||
Net unrealized losses (1) |
( |
) | ( |
) | ||||||
Ending balance |
$ | $ | ||||||||
Deferred Consideration (Note 9) |
||||||||||
Beginning balance |
$ | |
$ | |||||||
Net realized losses (2) |
||||||||||
Net unrealized (gains)/losses (3) |
( |
) | ||||||||
Settlements |
( |
) | ( |
) | ||||||
Ending balance |
$ | $ | |
|||||||
March 31, 2023 |
December 31, 2022 |
|||||||||
Financial instruments owned |
||||||||||
Trading securities |
$ | $ | ||||||||
Other assets—seed capital (WisdomTree blockchain-enabled funds) |
||||||||||
$ | |
$ | |
|||||||
March 31, 2023 |
December 31, 2022 | |||||||||
Debt instruments: Pass-through GSEs (amortized cost) |
$ | |
$ | |
||||||
March 31, 2023 |
December 31, 2022 | |||||||||
Cost/amortized cost |
$ | $ | ||||||||
Gross unrealized losses |
( |
) | ( |
) | ||||||
Gross unrealized gains |
||||||||||
Fair value |
$ | |
$ | |
||||||
March 31, 2023 |
December 31, 2022 | |||||||||
Due within one year |
$ | $ | ||||||||
Due one year through five years |
||||||||||
Due five years through ten years |
||||||||||
Due over ten years |
||||||||||
|
|
|
|
|
| |||||
Total |
$ | |
$ | |
||||||
|
|
|
|
|
|
March 31, 2023 |
December 31, 2022 |
|||||||||||||||||
Carrying Value |
Cost |
Carrying Value |
Cost |
|||||||||||||||
Securrency, Inc.—Series A convertible preferred stock |
$ | $ | $ | $ | ||||||||||||||
Securrency, Inc.—Series B convertible preferred stock |
||||||||||||||||||
Securrency, Inc.—convertible note |
||||||||||||||||||
|
|
|
|
|
|
|
|
|||||||||||
Subtotal—Securrency, Inc. |
$ | $ | $ | $ | ||||||||||||||
Fnality International Limited—convertible note |
||||||||||||||||||
Other investments |
||||||||||||||||||
|
|
|
|
|
|
|
|
|||||||||||
$ | |
$ | |
$ | |
$ | |
|||||||||||
|
|
|
|
|
|
|
|
March 31, 2023 |
||||
Conversion of Securrency Series A Shares upon a future equity financing |
||||
Redemption of Securrency Series A Shares upon a corporate transaction |
||||
Default |
March 31, 2023 |
December 31, 2022 | |||
Conversion of note upon a future equity financing |
|
| ||
Redemption of note upon a corporate transaction |
|
| ||
Default |
|
| ||
Time to potential outcome (in years) |
|
|
March 31, 2023 |
December 31, 2022 | |||
Conversion of note upon a future financing round |
|
| ||
Redemption of note upon a change of control |
|
| ||
Default |
|
| ||
Time to potential outcome (in years) |
|
|
March 31, 2023 |
December 31, 2022 |
|||||||
Equipment |
$ | |
$ | |
||||
Less: accumulated depreciation |
( |
( |
||||||
Total |
$ | $ | ||||||
March 31, 2023 |
December 31, 2022 |
|||||||
Forward-looking gold price (low)—per ounce |
$ | $ | ||||||
Forward-looking gold price (high)—per ounce |
$ | $ | ||||||
Forward-looking gold price (weighted average)—per ounce |
$ | $ | |
|||||
Discount rate |
|
|||||||
Perpetual growth rate |
Three Months Ended March 31, |
||||||||
2023 |
2022 |
|||||||
Contractual Gold Payments |
$ | $ | ||||||
Contractual Gold Payments—gold ounces paid |
||||||||
Gain/(loss) on revaluation of deferred consideration—gold payments (1) |
$ | |
$ | ( |
(1) |
Gains on revaluation of deferred consideration—gold payments result from a decrease in spot gold prices, a decrease in the forward-looking price of gold, a decrease in the perpetual growth rate and an increase in the discount rate used to compute the present value of the annual payment obligations. Losses on revaluation of deferred consideration—gold payments result from an increase in spot gold prices, an increase in the forward-looking price of gold, an increase in the perpetual growth rate and a decrease in the discount rate used to compute the present value of the annual payment obligations. |
2023 Notes |
2021 Notes |
2020 Notes |
||||||||||
Principal outstanding |
$ |
$ |
$ |
|||||||||
Maturity date (unless earlier converted, repurchased or redeemed) |
||||||||||||
Interest rate |
||||||||||||
Conversion price |
$ |
$ |
$ |
|||||||||
Conversion rate |
||||||||||||
Redemption price |
$ |
$ |
$ |
• | Interest rate: |
• | Conversion price: |
• | Conversion: |
• | Cash settlement of principal amount: |
• | Redemption price: |
Convertible Notes then in effect for at least |
• | Limited investor put rights: |
• | Conversion rate increase in certain customary circumstances: |
• | Seniority and Security: Non-Voting Convertible Preferred Stock (Note 11). |
March 31, 2023 |
December 31, 2022 | |||||||||||||||||||||||||||
2023 Notes |
2021 Notes |
2020 Notes |
Total |
2021 Notes |
2020 Notes |
Total | ||||||||||||||||||||||
Principal amount |
$ | |
$ | |
$ | |
$ | |
$ | |
$ | |
$ | |
||||||||||||||
Plus: Premium |
||||||||||||||||||||||||||||
|
|
|
|
|
|
|
|
|
|
|
|
|
|
|
|
|
|
|
|
| ||||||||
Gross proceeds |
||||||||||||||||||||||||||||
Less: Unamortized issuance costs |
( |
( |
( |
( |
( |
( |
( |
|||||||||||||||||||||
|
|
|
|
|
|
|
|
|
|
|
|
|
|
|
|
|
|
|
|
| ||||||||
Carrying amount |
$ | $ | $ | $ | $ | $ | ||||||||||||||||||||||
|
|
|
|
|
|
|
|
|
|
|
|
|
|
|
|
|
|
|
|
| ||||||||
Effective interest rate (1) |
||||||||||||||||||||||||||||
|
|
|
|
|
|
|
|
|
|
|
|
|
|
|
|
|
|
|
|
|
March 31, 2023 |
December 31, 2022 | |||||||
Issuance of Series A Preferred Stock |
$ | |
$ | |
||||
Less: Issuance costs |
( |
) | ( |
) | ||||
|
|
|
|
|
| |||
Series A Preferred Stock—carrying value |
$ | $ | ||||||
|
|
|
|
|
| |||
Cash dividends declared per share (quarterly) |
$ | $ | ||||||
|
|
|
|
|
|
Three Months Ended March 31, |
||||||||
2023 |
2022 |
|||||||
Lease cost: |
||||||||
Operating lease cost |
$ | $ | ||||||
Short-term lease cost |
||||||||
|
|
|
|
|||||
Total lease cost |
$ | $ | |
|||||
|
|
|
|
|||||
Other information: |
||||||||
Cash paid for amounts included in the measurement of operating liabilities (operating leases) |
$ | |
$ | |||||
|
|
|
|
|||||
Right-of-use |
n/a | n/a | ||||||
|
|
|
|
|||||
Weighted-average remaining lease term (in years)—operating leases |
||||||||
|
|
|
|
|||||
Weighted-average discount rate—operating leases |
||||||||
|
|
|
|
Remainder of 2023 |
$ | |||||
2024 |
||||||
2025 |
||||||
2026 |
||||||
2027 |
||||||
2028 and thereafter |
||||||
|
|
|||||
Total future minimum lease payments (undiscounted) |
$ | |
||||
|
|
Amounts recognized in the Company’s Consolidated Balance Sheets |
||||||
Lease liability—short term |
$ | |||||
Lease liability—long term |
||||||
|
|
|||||
Subtotal |
||||||
Difference between undiscounted and discounted cash flows |
||||||
|
|
|||||
Total future minimum lease payments (undiscounted) |
$ | |
||||
|
|
March 31, 2023 |
December 31, 2022 |
| ||||||||
Carrying Amount—Assets (Securrency): |
||||||||||
Preferred stock—Series A Shares |
$ | $ | ||||||||
Preferred stock—Series B Shares |
||||||||||
Convertible note |
||||||||||
|
|
|
|
|||||||
Subtotal—Securrency |
$ | $ | ||||||||
Carrying Amount—Assets (Fnality): |
||||||||||
Convertible note |
||||||||||
Carrying Amount—Assets (Other investments): |
||||||||||
|
|
|
|
|||||||
Total (Note 7) |
$ | $ | ||||||||
|
|
|
|
|||||||
Maximum exposure to loss |
$ | |
$ | |
||||||
|
|
|
|
Three Months Ended March 31, |
||||||||
2023 |
2022 |
|||||||
Revenues from contracts with customers: |
||||||||
Advisory fees |
$ | $ | ||||||
Other |
||||||||
|
|
|
|
|||||
Total operating revenues |
$ | |
$ | |
||||
|
|
|
|
Three Months Ended March 31, |
||||||||
2023 |
2022 |
|||||||
Revenues from contracts with customers: |
||||||||
United States |
$ | $ | ||||||
Jersey |
||||||||
Ireland |
||||||||
|
|
|
|
|||||
Total operating revenues |
$ | |
$ | |
||||
|
|
|
|
March 31, 2023 |
December 31, 2022 |
|||||||||
Receivable from WTT |
$ | $ | ||||||||
Receivable from ManJer Issuers |
||||||||||
Receivable from WMAI and WTICAV |
||||||||||
|
|
|
|
|||||||
Total |
$ | |
$ | |
||||||
|
|
|
|
Three Months Ended March 31, |
||||||||||
2023 |
2022 |
|||||||||
Advisory services provided to WTT |
$ | $ | ||||||||
Advisory services provided to ManJer Issuers |
||||||||||
Advisory services provided to WMAI and WTICAV |
||||||||||
|
|
|
|
|||||||
Total |
$ | |
$ | |
||||||
|
|
|
|
Stock options: |
Generally issued for terms of | |
RSAs/RSUs: |
Awards are valued based on the Company’s stock price on grant date and generally vest ratably, on an annual basis, over three years. |
PRSUs: | These awards cliff vest three years from the grant date and contain a market condition whereby the number of PRSUs ultimately vesting is tied to how the Company’s total shareholder return (“TSR”) compares to a peer group of other publicly traded asset managers over the three-year period. A Monte Carlo simulation is used to value these awards. | |
The number of PRSUs vesting ranges from • If the relative TSR is below the 25 th percentile, then • If the relative TSR is at the 25th percentile, then • If the relative TSR is above the 25th percentile, then linear scaling is applied such that the percent of the target number of PRSUs vesting is • If the Company’s TSR is negative, the target number of PRSUs vesting is capped at |
March 31, 2023 | ||||||||
Unrecognized Stock- Based Compensation |
Weighted-Average Remaining Vesting Period (Years) | |||||||
Employees and directors |
$ | |
RSA |
RSU |
PRSU | ||||||||||
Balance at January 1, 2023 |
||||||||||||
Granted |
(1) | |||||||||||
Vested |
( |
) | ( |
) | ( |
) (2) | ||||||
Forfeited |
( |
) | ( |
) | ( |
) (2) | ||||||
|
|
|
|
|
|
|
|
| ||||
Balance at March 31, 2023 |
|
|
|
|||||||||
|
|
|
|
|
|
|
|
| ||||
|
(1) |
Represents the target number of PRSUs granted and outstanding. The number of PRSUs that ultimately vest ranges from 90-day average stock prices; (ii) valuation date stock prices; (iii) historical stock price volatilities ranging from |
(2) |
The payout on PRSUs vesting in January 2023 was |
Three Months Ended March 31, | ||||||||
Basic Earnings/(Loss) per Share |
2023 |
2022 | ||||||
Net income/(loss) |
$ | $ | ( |
) | ||||
Less: Income distributed to participating securities |
( |
) | ( |
) | ||||
Less: Undistributed income allocable to participating securities |
( |
) | ||||||
|
|
|
|
|
| |||
Net income/(loss) available to common stockholders—Basic EPS |
$ | $ | ( |
) | ||||
Weighted average common shares (in thousands) |
|
|||||||
|
|
|
|
|
| |||
Basic earnings/(loss) per share |
$ | |
$ | ( |
) | |||
|
|
|
|
|
|
Three Months Ended March 31, | ||||||||
Diluted Earnings/(Loss) per Share |
2023 |
2022 | ||||||
Net earnings/(loss) available to common stockholders |
$ | $ | ( |
) | ||||
Add back: Undistributed income allocable to participating securities |
||||||||
Less: Reallocation of undistributed income allocable to participating securities considered potentially dilutive |
( |
) | ||||||
|
|
|
|
|
| |||
Net income/(loss) available to common stockholders—Diluted EPS |
$ | $ | ( |
) | ||||
|
|
|
|
|
| |||
Weighted Average Diluted Shares (in thousands) : |
||||||||
Weighted average common shares |
||||||||
Dilutive effect of common stock equivalents, excluding participating securities |
||||||||
|
|
|
|
|
| |||
Weighted average diluted shares, excluding participating securities (in thousands) |
||||||||
|
|
|
|
|
| |||
Diluted earnings/(loss) per share |
$ | $ | ( |
) | ||||
|
|
|
|
|
|
Three Months Ended March 31, | ||||||||
Reconciliation of Weighted Average Diluted Shares (in thousands) |
2023 |
2022 | ||||||
Weighted average diluted shares as disclosed on the Consolidated Statements of Operations |
(1) | |||||||
Less: Participating securities: |
||||||||
Weighted average shares of common stock issuable upon conversion of the Series A Preferred Stock (Note 11) |
( |
) | ||||||
Potentially dilutive restricted stock awards |
( |
) | ||||||
|
|
|
|
|
| |||
Weighted average diluted shares used to calculate diluted earnings/(loss) per share as disclosed in the table above |
|
|
||||||
|
|
|
|
|
|
(1) |
Excludes non-participating common stock equivalents for the three months ended March 31, 2022, as the Company reported a net loss for the period (shares herein are reported in thousands). |
March 31, 2023 |
December 31, 2022 |
|||||||||
Deferred tax assets: |
||||||||||
Capital losses |
$ | |
$ | |
||||||
Unrealized losses |
||||||||||
NOLs—Foreign |
||||||||||
Accrued expenses |
||||||||||
Goodwill and intangible assets |
||||||||||
Stock-based compensation |
||||||||||
Interest carryforwards |
||||||||||
Operating lease liabilities |
||||||||||
Foreign currency translation adjustment |
||||||||||
NOLs—U.S. |
||||||||||
Outside basis differences |
March 31, 2023 |
December 31, 2022 |
|||||||||
Other |
||||||||||
|
|
|
|
|||||||
Deferred tax assets |
||||||||||
|
|
|
|
|||||||
Deferred tax liabilities: |
||||||||||
Fixed assets and prepaid assets |
||||||||||
Unremitted earnings—European subsidiaries |
||||||||||
Right of use assets—operating leases |
||||||||||
|
|
|
|
|||||||
Deferred tax liabilities |
||||||||||
|
|
|
|
|||||||
Total deferred tax assets less deferred tax liabilities |
||||||||||
Less: Valuation allowance |
( |
( |
||||||||
|
|
|
|
|||||||
Deferred tax assets, net |
$ | $ | ||||||||
|
|
|
|
Total |
Unrecognized Tax Benefits |
Interest and Penalties | ||||||||||
Balance at January 1, 2023 |
$ | |
$ | |
$ | |
||||||
Decrease—Lapse of statute of limitations |
( |
) | ( |
) | ( |
) | ||||||
|
|
|
|
|
|
|
|
| ||||
Balance at March 31, 2023 |
$ | $ | $ | |||||||||
|
|
|
|
|
|
|
|
|
(1) |
The gross unrecognized tax benefits were accrued in British pounds. |
Total |
||||
Balance at January 1, 2023 |
$ | |
||
Changes |
||||
Balance at March 31, 2023 |
$ | |||
Balance at March 31, 2023 |
||||||||||||
Item |
Gross Asset |
Accumulated Amortization |
Net Asset |
|||||||||
ETFS acquisition |
$ | |
$ | |
$ | |
||||||
Software development |
( |
|||||||||||
Balance at March 31, 2023 |
$ | $ | ( |
$ | ||||||||
Balance at December 31, 2022 |
||||||||||||
Item |
Gross Asset |
Accumulated Amortization |
Net Asset |
|||||||||
ETFS acquisition |
$ | |
$ | |
$ | |
||||||
Software development |
( |
|||||||||||
Balance at December 31, 2022 |
$ | $ | ( |
$ | ||||||||
Remained of 2023 |
$ | |||
2024 |
||||
2025 |
||||
2026 |
||||
2027 |
||||
2028 and thereafter |
||||
Total expected amortization expense |
$ | |
||
ITEM 2. MANAGEMENT’S DISCUSSION AND ANALYSIS OF FINANCIAL CONDITION AND RESULTS OF OPERATIONS
The following discussion and analysis of our financial condition and results of operations should be read together with our consolidated financial statements and the related notes and the other financial information included elsewhere in this Report. In addition to historical consolidated financial information, the following discussion contains forward-looking statements that reflect our plans, estimates and beliefs. Our actual results could differ materially from those discussed in the forward-looking statements. Factors that could cause or contribute to these differences include those discussed below. For a more complete description of the risks noted above and other risks that could cause our actual results to materially differ from our current expectations, please see Item 1A “Risk Factors” in our Annual Report on Form 10-K for the fiscal year ended December 31, 2022. We assume no obligation to update or revise publicly any forward-looking statements, whether as a result of new information, future events or otherwise, unless required by law.
Executive Summary
We are a global financial innovator, offering a well-diversified suite of ETPs, models and solutions. We empower investors to shape their future and support financial professionals to better serve their clients and grow their businesses. We leverage the latest financial infrastructure to create products that provide access, transparency and an enhanced user experience. Building on our heritage of innovation, we are also developing next-generation digital products and structures, including Digital Funds and tokenized assets, as well as our blockchain-native digital wallet, WisdomTree Prime™.
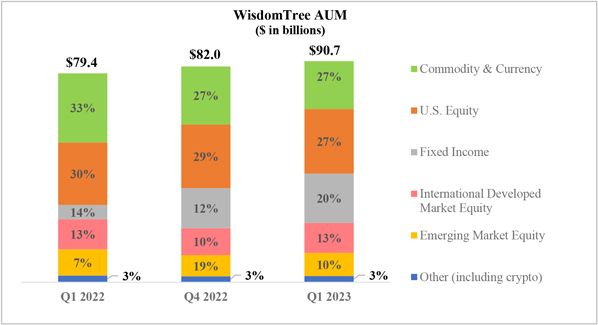
We have approximately $90.7 billion in AUM as of March 31, 2023. Our family of ETPs includes products that provide exposure to equities, commodities, fixed income, leveraged-and-inverse, currency, cryptocurrency and alternative strategies. We have launched many first-to-market products and pioneered alternative weighting we call “Modern Alpha,” which combines the outperformance potential of active management with the benefits of passive management to offer investors cost-effective funds that are built to perform. Most of our equity-based funds employ a fundamentally weighted investment methodology, which weights securities based on factors such as dividends, earnings or investment factors, whereas most other industry indexes use a capitalization weighted methodology. These products are distributed through all major channels in the asset management industry, including banks, brokerage firms, registered investment advisers, institutional investors, private wealth managers and online brokers primarily through our sales force. We believe technology is altering the way financial advisors conduct business and through our Advisor Solutions program we offer technology-enabled and research-driven solutions including portfolio construction, asset allocation, practice management services and digital tools to help financial advisors address technology challenges and grow and scale their businesses.
We are at the forefront of innovation and believe that tokenization and leveraging the utility of blockchain technology is the next evolution in financial services. We are building the foundation that will allow us to lead in this coming evolution. WisdomTree Prime™, our blockchain-native digital wallet, is currently in beta testing and positions us to expand our blockchain-enabled financial services product offerings with a new direct-to-consumer channel where spending, saving and investing are united. As we continue to pursue our digital assets strategy, we are embracing a concept we refer to as “responsible DeFi,” which we believe upholds the foundational principles of regulation in this innovative and quickly evolving space. We believe that our expansion into digital assets will complement our existing core competencies in a holistic manner, diversify our revenue streams and contribute to our growth.
We were incorporated under the laws of the state of Delaware on September 19, 1985 as Financial Data Systems, Inc., were renamed WisdomTree Investments, Inc. on September 6, 2005, and ultimately renamed WisdomTree, Inc. on November 7, 2022.
33
Assets Under Management
WisdomTree ETPs
We offer ETPs covering equity, commodity, fixed income, leveraged-and-inverse, currency, alternatives and cryptocurrency. The chart below sets forth the asset mix of our ETPs at March 31, 2023, December 31, 2022 and March 31, 2022:
Market Environment
The outlook for the first quarter of 2023 improved as developed markets continued to stave off a recession despite rising interest rates. The outlook for emerging markets has improved since the zero-Covid policy was abandoned in China. In March, gold prices increased to over $2,000 per ounce for the first time in over a year amid market volatility sparked by the Silicon Valley Bank’s collapse and further turbulence in the banking sector.
The S&P 500, MSCI EAFE (local currency), MSCI Emerging Markets Index (U.S. dollar) and gold prices increased by 7.5%, 7.7%, 4.0% and 9.2%, respectively, during the quarter. In addition, the European and Japanese equities markets both appreciated with the MSCI EMU Index and MSCI Japan Index increasing 12.3% and 7.3%, respectively, in local currency terms for the quarter. Also, the U.S. dollar weakened 1.8%, 2.6% and 1.3% versus the euro, British pound and the Japanese yen, respectively, the during the quarter.
34
U.S. Listed ETF Industry Flows
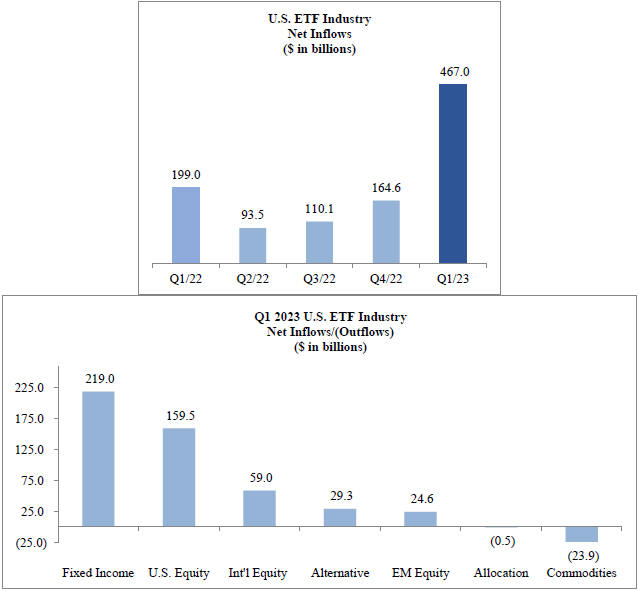
U.S. listed ETF net flows for the three months ended March 31, 2023 were $467 billion. Fixed income and U.S. equity gathered the majority of those flows.
Source: Morningstar
35
European Listed ETP Industry Flows
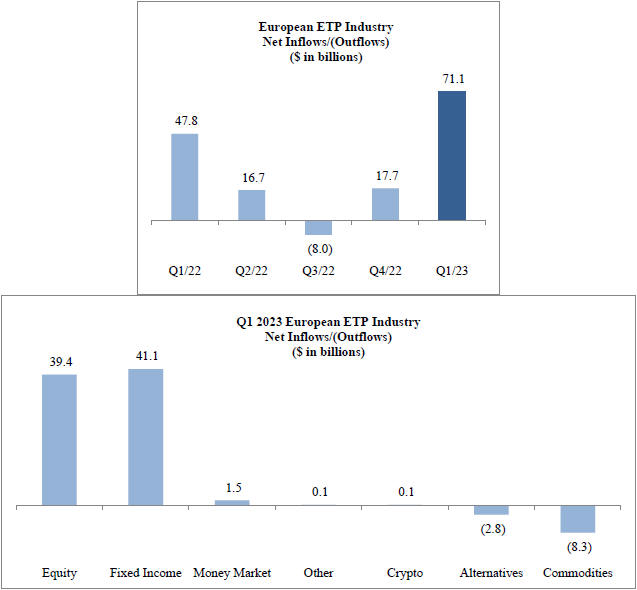
European listed ETP net flows were $71.1 billion for the three months ended March 31, 2023. Equities and fixed income gathered the majority of those flows.
Source: Morningstar
Our Operating and Financial Results
We operate as an ETP sponsor and asset manager, providing investment advisory services globally through our subsidiaries in the U.S. and Europe.
U.S. Listed ETFs
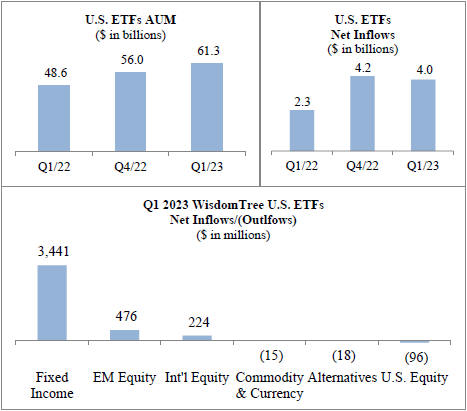
The AUM of our U.S. listed exchange traded funds, or U.S. listed ETFs, increased from $56.0 billion at December 31, 2022 to $61.3 billion at March 31, 2023 due to net inflows and market appreciation.
36
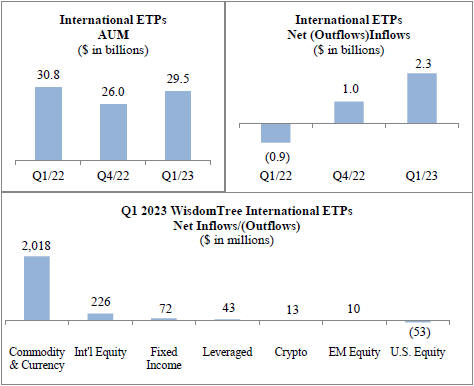
European Listed ETPs
The AUM of our European listed (including internationally cross-listed) ETPs, or European listed ETPs, increased from $26.0 billion at December 31, 2022 to $29.5 billion at March 31, 2023, due to net inflows and market appreciation.
37
Consolidated Operating Results
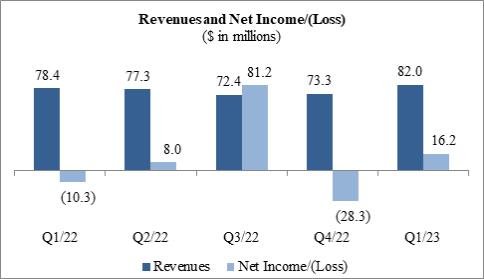
The following table sets forth our revenues and net income/(loss) for the most recent five quarters.
• | Revenues – Total revenues increased 4.7% from the three months ended March 31, 2022 to $82.0 million due to higher average AUM and higher other income from large flows into some of our European products. These items were partly offset by a lower average advisory fee. |
• | Expenses – Total operating expenses increased 7.9% from the three months ended March 31, 2022 to $65.5 million primarily due to higher compensation from increased headcount and stock-based compensation expense, fund management and administration costs and other expenses. These increases were partly offset by lower professional fees. |
• | Other Income/(Expenses) – Other income/(expenses) includes interest income and interest expense, gains/(losses) on revaluation of deferred consideration–gold payments, impairments, loss on extinguishment of convertible notes and other losses and gains. Further information is provided herein. |
• | Net income/(loss) – We reported net income of $16.2 million and a net loss of ($10.3) million during the three months ended March 31, 2023 and 2022, respectively. |
Expense Guidance Update for the Year Ending December 31, 2023
Compensation Expense
Our compensation expense for the year ending December 31, 2023 is currently estimated to range from $100.0 million to $106.0 million. This range considers variability in incentive compensation, with drivers including the magnitude of our flows, our share price performance in relation to our peers as well as revenue, operating income and operating margin performance. Given the strong start to 2023, we anticipate trending toward the high end of this range.
Discretionary Spending
Discretionary spending includes, marketing, sales, professional fees, occupancy and equipment, depreciation and amortization and other expenses. During the three months ended March 31, 2023, our discretionary spending was $13.2 million. We currently estimate our discretionary spending for the year ending December 31, 2023 to range from $56.0 million to $59.0 million (unchanged from our guidance provided last quarter), as we anticipate an uptick in marketing spend.
Not included in the guidance above are potential non-recurring expenses in response to an activist campaign, including $1.0 million incurred during the three months ended March 31, 2023.
Gross Margin
We define gross margin as total operating revenues less fund management and administration expenses. Gross margin percentage is calculated as gross margin divided by total operating revenues. Our gross margin was 79.1% during the three months ended March 31, 2023. Our gross margin guidance for the year ending December 31, 2023 is estimated to be 78% given anticipated product launches, changes in other income which may rise or fall depending upon the magnitude of flows of our European-listed products and uncertain market conditions.
38
Contractual Gold Payments
We currently estimate our contractual gold payments expense for the year ending December 31, 2023 to be approximately $18.0 million (unchanged from our guidance provided last quarter) taking into consideration current gold prices.
Third-Party Distribution Fees
We currently estimate third-party distribution fees to range from $8.0 million to $9.0 million (unchanged from our guidance provided last quarter) for the year ending December 31, 2023. Given the AUM on our platforms we anticipate trending toward the high end of this guidance.
Interest Expense
Our interest expense for the year ending December 31, 2023 is currently estimated to be $15.0 million. Our interest cost for the three months ended June 30, 2023 is estimated to be $4.1 million, which should then reduce to $3.5 million per quarter going forward upon the settlement of $60.0 million in aggregate principal amount of our 2020 Notes (defined below) maturing in June 2023.
Income Tax Expense
We currently estimate that our consolidated normalized effective tax rate will be 23% (unchanged from our guidance provided last quarter). This estimated rate may change and is dependent upon our actual taxable income earned in relation to our forecasts.
This normalized effective tax rate excludes items that are non-recurring and not core to our operating business including but not limited to the impact of any revaluation on deferred consideration – gold payments, the loss on extinguishment of convertible notes, remeasurement of contingent consideration from the sale of our former Canadian ETF business, gains and losses on financial instruments owned and investments, valuation allowances on capital losses, reductions in unrecognized tax benefits and any stock-based compensation windfalls or shortfalls.
39
Key Operating Statistics
The following table presents key operating statistics that serve as indicators for the performance of our business:
Three Months Ended | ||||||||||||
March 31, 2023 |
December 31, 2022 |
March 31, 2022 |
||||||||||
GLOBAL ETPs (in millions) |
||||||||||||
Beginning of period assets |
$ | 81,993 | $ | 70,878 | $ | 77,479 | ||||||
Inflows/(outflows) |
6,341 | 5,264 | 1,319 | |||||||||
Market appreciation/(depreciation) |
2,406 | 5,851 | 609 | |||||||||
End of period assets |
$ | 90,740 | $ | 81,993 | $ | 79,407 | ||||||
|
|
|
|
|
|
|
||||||
Average assets during the period |
$ | 87,508 | $ | 77,649 | $ | 77,809 | ||||||
Average advisory fee during the period |
0.36% | 0.36% | 0.40% | |||||||||
Number of ETPs—end of the period |
350 | 348 | 341 | |||||||||
US LISTED ETFs (in millions) |
||||||||||||
Beginning of period assets |
$ | 55,973 | $ | 48,043 | $ | 48,210 | ||||||
Inflows/(outflows) |
4,012 | 4,232 | 2,250 | |||||||||
Market appreciation/(depreciation) |
1,298 | 3,698 | (1,838) | |||||||||
End of period assets |
$ | 61,283 | $ | 55,973 | $ | 48,622 | ||||||
|
|
|
|
|
|
|
||||||
Average assets during the period |
$ | 59,430 | $ | 53,655 | $ | 47,499 | ||||||
Number of ETPs—end of the period |
80 | 79 | 77 | |||||||||
EUROPEAN LISTED ETPs (in millions) |
||||||||||||
Beginning of period assets |
$ | 26,020 | $ | 22,835 | $ | 29,269 | ||||||
Inflows/(outflows) |
2,329 | 1,032 | (931) | |||||||||
Market appreciation/(depreciation) |
1,108 | 2,153 | 2,447 | |||||||||
End of period assets |
$ | 29,457 | $ | 26,020 | $ | 30,785 | ||||||
|
|
|
|
|
|
|
||||||
Average assets during the period |
$ | 28,078 | $ | 23,994 | $ | 30,310 | ||||||
Number of ETPs—end of the period |
270 | 269 | 264 | |||||||||
PRODUCT CATEGORIES (in millions) |
||||||||||||
Commodity & Currency |
||||||||||||
Beginning of period assets |
$ | 22,097 | $ | 19,561 | $ | 24,598 | ||||||
Inflows/(outflows) |
2,003 | 796 | (1,053) | |||||||||
Market appreciation/(depreciation) |
824 | 1,740 | 2,757 | |||||||||
|
|
|
|
|
|
|
||||||
End of period assets |
$ | 24,924 | $ | 22,097 | $ | 26,302 | ||||||
|
|
|
|
|
|
|
||||||
Average assets during the period |
$ | 23,806 | $ | 20,345 | $ | 25,891 | ||||||
U.S. Equity |
||||||||||||
Beginning of period assets |
$ | 24,112 | $ | 20,952 | $ | 23,860 | ||||||
(Outflows)/inflows |
(149) | 1,021 | 779 | |||||||||
Market appreciation/(depreciation) |
571 | 2,139 | (901) | |||||||||
|
|
|
|
|
|
|
||||||
End of period assets |
$ | 24,534 | $ | 24,112 | $ | 23,738 | ||||||
|
|
|
|
|
|
|
||||||
Average assets during the period |
$ | 24,726 | $ | 23,492 | $ | 23,134 | ||||||
Fixed Income |
||||||||||||
Beginning of period assets |
$ | 15,273 | $ | 11,695 | $ | 4,356 | ||||||
Inflows/(outflows) |
3,513 | 3,393 | 1,242 | |||||||||
Market (depreciation)/appreciation |
(78) | 185 | (180) | |||||||||
|
|
|
|
|
|
|
||||||
End of period assets |
$ | 18,708 | $ | 15,273 | $ | 5,418 | ||||||
|
|
|
|
|
|
|
||||||
Average assets during the period |
$ | 17,176 | $ | 13,962 | $ | 4,691 |
40
Three Months Ended | ||||||||||||
March 31, 2023 |
December 31, 2022 |
March 31, 2022 | ||||||||||
International Developed Market Equity |
||||||||||||
Beginning of period assets |
$ | 10,195 | $ | 9,183 | $ | 11,894 | ||||||
Inflows/(outflows) |
450 | 40 | 97 | |||||||||
Market appreciation/(depreciation) |
788 | 972 | (569 | ) | ||||||||
|
|
|
|
|
|
|
|
| ||||
End of period assets |
$ | 11,433 | $ | 10,195 | $ | 11,422 | ||||||
|
|
|
|
|
|
|
|
| ||||
Average assets during the period |
$ | 10,879 | $ | 10,000 | $ | 11,543 | ||||||
Emerging Market Equity |
||||||||||||
Beginning of period assets |
$ | 8,116 | $ | 7,495 | $ | 10,375 | ||||||
Inflows/(outflows) |
486 | (53 | ) | 189 | ||||||||
Market appreciation/(depreciation) |
209 | 674 | (573 | ) | ||||||||
|
|
|
|
|
|
|
|
| ||||
End of period assets |
$ | 8,811 | $ | 8,116 | $ | 9,991 | ||||||
|
|
|
|
|
|
|
|
| ||||
Average assets during the period |
$ | 8,666 | $ | 7,770 | $ | 10,116 | ||||||
Leveraged & Inverse |
||||||||||||
Beginning of period assets |
$ | 1,754 | $ | 1,523 | $ | 1,775 | ||||||
Inflows/(outflows) |
43 | 59 | (2 | ) | ||||||||
Market (depreciation)/appreciation |
(12 | ) | 172 | 83 | ||||||||
|
|
|
|
|
|
|
|
| ||||
End of period assets |
$ | 1,785 | $ | 1,754 | $ | 1,856 | ||||||
|
|
|
|
|
|
|
|
| ||||
Average assets during the period |
$ | 1,757 | $ | 1,623 | $ | 1,830 | ||||||
Alternatives |
||||||||||||
Beginning of period assets |
$ | 310 | $ | 306 | $ | 261 | ||||||
(Outflows)/inflows |
(18 | ) | 12 | 29 | ||||||||
Market appreciation/(depreciation) |
14 | (8 | ) | 3 | ||||||||
|
|
|
|
|
|
|
|
| ||||
End of period assets |
$ | 306 | $ | 310 | $ | 293 | ||||||
|
|
|
|
|
|
|
|
| ||||
Average assets during the period |
$ | 308 | $ | 305 | $ | 275 | ||||||
Cryptocurrency |
||||||||||||
Beginning of period assets |
$ | 136 | $ | 163 | $ | 357 | ||||||
Inflows/(outflows) |
13 | (4 | ) | 37 | ||||||||
Market appreciation/(depreciation) |
90 | (23 | ) | (11 | ) | |||||||
|
|
|
|
|
|
|
|
| ||||
End of period assets |
$ | 239 | $ | 136 | $ | 383 | ||||||
|
|
|
|
|
|
|
|
| ||||
Average assets during the period |
$ | 190 | $ | 152 | $ | 324 | ||||||
Closed ETPs |
||||||||||||
Beginning of period assets |
$ | — | $ | — | $ | 3 | ||||||
Inflows/(outflows) |
— | — | 1 | |||||||||
|
|
|
|
|
|
|
|
| ||||
End of period assets |
$ | — | $ | — | $ | 4 | ||||||
|
|
|
|
|
|
|
|
| ||||
Average assets during the period |
$ | — | $ | — | $ | 5 | ||||||
Headcount |
279 | 273 | 253 |
Note: Previously issued statistics may be restated due to fund closures and trade adjustments
Source: WisdomTree
41
Three Months Ended March 31, 2023 Compared to Three Months Ended March 31, 2022
Selected Operating and Financial Information
Three Months Ended March 31, |
Change | Percent Change | ||||||||||||||
2023 | 2022 | |||||||||||||||
AUM (in millions) |
||||||||||||||||
Average AUM |
$ | 87,508 | $ | 77,809 | $ | 9,699 | 12.5 | % | ||||||||
|
|
|
|
|
|
|
|
| ||||||||
Operating Revenues (in thousands) |
||||||||||||||||
Advisory fees |
$ | 77,637 | $ | 76,517 | $ | 1,120 | 1.5 | % | ||||||||
Other income |
4,407 | 1,851 | 2,556 | 138.1 | % | |||||||||||
|
|
|
|
|
|
|
|
| ||||||||
Total revenues |
$ | 82,044 | $ | 78,368 | $ | 3,676 | 4.7 | % | ||||||||
|
|
|
|
|
|
|
|
|
Average AUM
Our average AUM increased 12.5 % from $77.8 billion at March 31, 2022 to $87.5 billion at March 31, 2023 due to net inflows partly offset by market depreciation.
Operating Revenues
Advisory fees
Advisory fee revenues increased 1.5% from $76.5 million during the three months ended March 31, 2022 to $77.6 million in the comparable period in 2023 due to higher average AUM, partly offset by a decline in our average advisory fee. Our average advisory fee decreased from 0.40% during the three months ended March 31, 2022 to 0.36% during the comparable period in 2023 due to AUM mix shift.
Other income
Other income increased 138.1% from $1.9 million during the three months ended March 31, 2022 to $4.4 million in the comparable period in 2023 primarily due to large flows into some of our European products.
Operating Expenses
(in thousands) |
Three Months Ended March 31, |
Change | Percent Change | |||||||||||||
2023 | 2022 | |||||||||||||||
Compensation and benefits |
$ | 27,398 | $ | 24,787 | $ | 2,611 | 10.5% | |||||||||
Fund management and administration |
17,153 | 15,494 | 1,659 | 10.7% | ||||||||||||
Marketing and advertising |
4,007 | 4,023 | (16 | ) | (0.4%) | |||||||||||
Sales and business development |
2,994 | 2,609 | 385 | 14.8% | ||||||||||||
Contractual gold payments |
4,486 | 4,450 | 36 | 0.8% | ||||||||||||
Professional fees |
3,715 | 4,459 | (744 | ) | (16.7%) | |||||||||||
Occupancy, communications and equipment |
1,101 | 753 | 348 | 46.2% | ||||||||||||
Depreciation and amortization |
109 | 47 | 62 | 131.9% | ||||||||||||
Third-party distribution fees |
2,253 | 2,212 | 41 | 1.9% | ||||||||||||
Other |
2,257 | 1,845 | 412 | 22.3% | ||||||||||||
|
|
|
|
|
|
|
|
|
|
|
| |||||
Total operating expenses |
$ | 65,473 | $ | 60,679 | $ | 4,794 | 7.9% | |||||||||
|
|
|
|
|
|
|
|
|
|
|
|
42
Three Months Ended March 31, |
||||||||
As a Percent of Revenues: |
2023 | 2022 | ||||||
Compensation and benefits |
33.5% | 31.5% | ||||||
Fund management and administration |
20.9% | 19.8% | ||||||
Marketing and advertising |
4.9% | 5.1% | ||||||
Sales and business development |
3.6% | 3.3% | ||||||
Contractual gold payments |
5.5% | 5.7% | ||||||
Professional fees |
4.5% | 5.7% | ||||||
Occupancy, communications and equipment |
1.3% | 1.0% | ||||||
Depreciation and amortization |
0.1% | 0.1% | ||||||
Third-party distribution fees |
2.7% | 2.8% | ||||||
Other |
2.8% | 2.4% | ||||||
|
|
|
|
|||||
Total operating expenses |
79.8% | 77.4% | ||||||
|
|
|
|
Compensation and benefits
Compensation and benefits expense increased 10.5% from $24.8 million during the three months ended March 31, 2022 to $27.4 million in the comparable period in 2023 due to increased headcount and higher stock-based compensation expense. Headcount was 253 and 279 at March 31, 2022 and 2023, respectively.
Fund management and administration
Fund management and administration expense increased 10.7% from $15.5 million during the three months ended March 31, 2022 to $17.2 million in the comparable period in 2023 primarily due to higher average AUM, product launches and inflows. We had 77 U.S. listed ETFs and 264 European listed ETPs at March 31, 2022 compared to 80 U.S. listed ETFs and 270 European listed ETPs at March 31, 2023.
Marketing and advertising
Marketing and advertising expense was essentially unchanged from the three months ended March 31, 2022.
Sales and business development
Sales and business development expense increased 14.8% from $2.6 million during the three months ended March 31, 2022 to $3.0 million in the comparable period in 2023 primarily resulting from increases in conference and events spending as well as market data costs.
Contractual gold payments
Contractual gold payments expense was essentially unchanged from the three months ended March 31, 2022. This expense was associated with the annual payment of 9,500 ounces of gold and was calculated using the average daily spot price of $1,874 and $1,889 per ounce during the three months ended March 31, 2022 and 2023, respectively.
Professional fees
Professional fees decreased 16.7% from $4.5 million during the three months ended March 31, 2022 to $3.7 million in the comparable period in 2023 primarily due to lower expenses incurred in response to an activist campaign.
Occupancy, communications and equipment
Occupancy, communications and equipment expense increased 46.2% from $0.8 million during the three months ended March 31, 2022 to $1.1 million in the comparable period in 2023 as we signed new office leases in the U.S. and Europe.
Depreciation and amortization
Depreciation and amortization expense increased 131.9% from $0.05 million during the three months ended March 31, 2022 to $0.1 million in the comparable period in 2023 due to amortization of software development costs.
Third-party distribution fees
Third-party distribution fees were essentially unchanged from the three months ended March 31, 2022.
43
Other
Other expenses increased 22.3% from $1.8 million during the three months ended March 31, 2022 to $2.3 million in the comparable period in 2023 primarily due to higher insurance, public relations, travel and directors expenses.
Other Income/(Expenses)
Three Months Ended March 31, |
Change | Percent Change |
||||||||||||||
(in thousands) |
2023 | 2022 | ||||||||||||||
Interest expense |
$ | (4,002) | $ | (3,732) | $ | (270) | 7.2% | |||||||||
Gain/(loss) on revaluation of deferred consideration |
20,592 | (17,018) | 37,610 | n/a | ||||||||||||
Interest income |
1,083 | 794 | 289 | 36.4% | ||||||||||||
Impairments |
(4,900) | — | (4,900) | 100.0% | ||||||||||||
Loss on extinguishment of convertible notes |
(9,721) | — | (9,721) | 100.0% | ||||||||||||
Other losses, net |
(2,007) | (24,707) | 22,700 | (91.9%) | ||||||||||||
|
|
|
|
|
|
|
|
|||||||||
Total other income/(expenses), net |
$ | 1,045 | $ | (44,663) | $ | 45,708 | n/a | |||||||||
|
|
|
|
|
|
|
|
Three Months Ended March 31, | ||||||||
As a Percent of Revenues: |
2023 | 2022 | ||||||
Interest expense |
(4.9%) | (4.8%) | ||||||
Gain/(loss) on revaluation of deferred consideration |
25.1% | (21.7%) | ||||||
Interest income |
1.3% | 1.0% | ||||||
Impairments |
(6.0%) | — | ||||||
Loss on extinguishment of convertible notes |
(11.8%) | — | ||||||
Other losses, net |
(2.4%) | (31.5%) | ||||||
|
|
|
|
|||||
Total other income/(expenses), net |
1.3% | (57.0%) | ||||||
|
|
|
|
Interest expense
Interest expense increased 7.2% from $3.7 million during the three months ended March 31, 2022 to $4.0 million in the comparable period in 2023 due to a higher level of debt outstanding and a higher effective interest rate. Our effective interest rate during the three months ended March 31, 2022 and 2023 was 4.6% and 5.0%, respectively.
Gain/(loss) on revaluation of deferred consideration
We recognized a loss on revaluation of deferred consideration of ($17.0) million and a gain on revaluation of deferred consideration of $20.6 million during the three months ended March 31, 2022 and 2023, respectively. The gain recognized during the three months ended March 31, 2023, was primarily due to an increase in the discount rate used to compute the present value of the annual payment obligations, partly offset by higher gold prices. The magnitude of any gain or loss is highly correlated to changes in the discount rate and the magnitude of the change in the forward-looking price of gold.
Interest income
Interest income increased 36.4% from $0.8 million during the three months ended March 31, 2022 to $1.1 million in the comparable period in 2023 due to rising interest rates.
Impairments
During the three months ended March 31, 2023, we recognized a non-cash impairment charge of $4.9 million on the Securrency Series A Shares.
Loss on Extinguishment of Convertible Notes
During the three months ended March 31, 2023, we recognized a loss on extinguishment of convertible notes of $9.7 million arising from the repurchase of $115.0 million in aggregate principal amount of our 2020 Notes.
Other losses, net
Other net losses were $2.0 million for the first quarter of 2023. This quarter includes a non-cash charge of $1.4 million arising from the release of a tax-related indemnification asset upon the expiration of the statute of limitations (an equal and offsetting benefit has been recognized in income tax expense). This quarter also includes losses on our investments of $3.9 million. These items were partly offset by gains on our financial instruments owned of $2.0 million and a gain of $1.5 million related to the remeasurement of contingent consideration payable to us from the sale of our former Canadian ETF business. Gains and losses also generally arise from the sale of gold earned from management fees paid by our physically-backed gold exchange-traded products (“ETPs”), foreign exchange fluctuations and other miscellaneous items.
44
Income Taxes
Our effective income tax rate for the first quarter of 2023 was 7.9%, resulting in income tax expense of $1.4 million. The effective tax rate differs from the federal statutory rate of 21% primarily due to a non-taxable gain on revaluation of deferred consideration and a reduction in unrecognized tax benefits upon the expiration of the statute of limitations. These items were partly offset by a non-deductible loss on extinguishment of our convertible notes and an increase in the deferred tax asset valuation allowance on losses recognized on our investments.
Our effective income tax rate for the three months ended March 31, 2022 of 62.0% resulted in an income tax benefit of $16.7 million. Our tax rate differs from the federal statutory rate of 21% primarily due to a $19.9 million reduction in unrecognized tax benefits (including interest and penalties), a lower tax rate on foreign earnings and tax windfalls associated with the vesting of stock-based compensation awards. These items were partly offset by a non-taxable loss on revaluation of deferred consideration and an increase in the deferred tax asset valuation allowance on losses recognized on securities owned.
Non-GAAP Financial Measurements
In an effort to provide additional information regarding our results as determined by GAAP, we also disclose certain non-GAAP information which we believe provides useful and meaningful information. Our management reviews these non-GAAP financial measurements when evaluating our financial performance and results of operations; therefore, we believe it is useful to provide information with respect to these non-GAAP measurements so as to share this perspective of management. Non-GAAP measurements do not have any standardized meaning, do not replace nor are superior to GAAP financial measurements and are unlikely to be comparable to similar measures presented by other companies. These non-GAAP financial measurements should be considered in the context with our GAAP results. The non-GAAP financial measurements contained in this Report include:
• | Adjusted net income and diluted earnings per share. We disclose adjusted net income and diluted earnings per share as non-GAAP financial measurements in order to report our results exclusive of items that are non-recurring or not core to our operating business. We believe presenting these non-GAAP financial measures provides investors with a consistent way to analyze our performance. These non-GAAP financial measures exclude the following: |
• | Unrealized gains or losses on the revaluation of deferred consideration: Deferred consideration is an obligation we assumed in connection with the ETFS Acquisition that is carried at fair value. This item represents the present value of an obligation to pay fixed ounces of gold into perpetuity and is measured using forward-looking gold prices. Changes in the forward-looking price of gold and changes in the discount rate used to compute the present value of the annual payment obligations may have a material impact on the carrying value of the deferred consideration and our reported financial results. We exclude this item when arriving at adjusted net income and diluted earnings per share as it is not core to our operating business. The item is not adjusted for income taxes as the obligation was assumed by a wholly-owned subsidiary of ours that is based in Jersey, a jurisdiction where we are subject to a zero percent tax rate. |
• | Gains or losses on financial instruments owned: We account for our financial instruments owned as trading securities, which requires these instruments to be measured at fair value with gains and losses reported in net income. We exclude these items when calculating our non-GAAP financial measurements as the gains and losses introduce volatility in earnings and are not core to our operating business. |
• | Tax shortfalls and windfalls upon vesting and exercise of stock-based compensation awards: GAAP requires the recognition of tax windfalls and shortfalls within income tax expense. These items arise upon the vesting and exercise of stock-based compensation awards and the magnitude is directly correlated to the number of awards vesting/exercised as well as the difference between the price of our stock on the date the award was granted and the date the award vested or was exercised. We exclude these items when determining adjusted net income and diluted earnings per share as they introduce volatility in earnings and are not core to our operating business. |
• | Other items: Loss on extinguishment of convertible notes, impairments, remeasurement of contingent consideration payable to us from the sale of our former Canadian ETF business, unrealized gains and losses recognized on our investments, changes in deferred tax asset valuation allowance and expenses incurred in response to an activist campaign are excluded when calculating our non-GAAP financial measurements. |
45
Three Months Ended | ||||||||
Adjusted Net Income and Diluted Earnings per Share: |
March 31, |
March 31, 2022 | ||||||
Net income/(loss), as reported |
$ | 16,233 | $ | (10,261 | ) | |||
(Deduct)/add back: (Gain)/loss on revaluation of deferred consideration |
(20,592 | ) | 17,018 | |||||
Add back: Loss on extinguishment of convertible notes, net of income taxes |
9,623 | — | ||||||
Add back: Impairments |
4,900 | — | ||||||
Deduct: Remeasurement of contingent consideration – sale of former Canadian ETF business |
(1,477 | ) | — | |||||
(Deduct)/add back: (Gains)/losses on financial instruments owned, net of income taxes |
(1,479 | ) | 3,893 | |||||
Add back: Increase in deferred tax asset valuation allowance on financial instruments owned and investments |
477 | 2,010 | ||||||
Add back: Unrealized loss recognized on our investments, net of income taxes |
2,966 | 124 | ||||||
Deduct: Tax windfalls upon vesting and exercise of stock-based compensation awards |
(185 | ) | (565 | ) | ||||
Add back: Expenses incurred in response to an activist campaign, net of income taxes |
732 | 1,844 | ||||||
|
|
|
|
|
| |||
Adjusted net income |
$ | 11,198 | $ | 14,063 | ||||
Deduct: Income distributed to participating securities |
(498 | ) | (549 | ) | ||||
Deduct: Undistributed income allocable to participating securities |
(672 | ) | (1,041 | ) | ||||
|
|
|
|
|
| |||
Adjusted net income available to common stockholders |
10,028 | 12,473 | ||||||
Weighted average diluted shares, excluding participating securities (See Note 11 to our Consolidated Financial Statements) |
144,431 | 142,814 | ||||||
|
|
|
|
|
| |||
Adjusted earnings per share—diluted |
$ | 0.07 | $ | 0.09 | ||||
|
|
|
|
|
|
Liquidity and Capital Resources
The following table summarizes key data regarding our liquidity, capital resources and use of capital to fund our operations:
March 31, 2023 |
December 31, 2022 |
|||||||||
Balance Sheet Data (in thousands): |
||||||||||
Cash and cash equivalents |
$ | 119,099 | $ | 132,101 | ||||||
Financial instruments owned, at fair value |
130,180 | 126,239 | ||||||||
Accounts receivable |
35,496 | 30,549 | ||||||||
Securities held-to-maturity |
253 | 259 | ||||||||
|
|
|
|
|
||||||
Total: Liquid assets |
285,028 | 289,148 | ||||||||
Less: Total current liabilities |
(130,926) | (148,434) | ||||||||
Less: Other assets—seed capital (WisdomTree blockchain-enabled funds) |
(12,413) | (1,765) | ||||||||
Less: Regulatory capital requirements |
(28,726) | (25,988) | ||||||||
|
|
|
|
|
||||||
Total: Available liquidity |
$ | 112,963 | $ | 112,961 | ||||||
|
|
|
|
|
Three Months Ended March 31, | ||||||||||
2023 |
2022 | |||||||||
Cash Flow Data (in thousands): |
||||||||||
Operating cash flows | $ | (5,397 | ) | $ | (2,692 | ) | ||||
Investing cash flows | (2,008 | ) | (18,721 | ) | ||||||
Financing cash flows | (6,070 | ) | (8,236 | ) | ||||||
Foreign exchange rate effect | 473 | (665 | ) | |||||||
|
|
|
|
|
| |||||
Decrease in cash and cash equivalents | $ | (13,002 | ) | $ | (30,314 | ) | ||||
|
|
|
|
|
|
Liquidity
We consider our available liquidity to be our liquid assets, less our current liabilities and regulatory capital requirements of certain European subsidiaries. Liquid assets consist of cash and cash equivalents, financial instruments owned, at fair value, accounts receivable and securities held-to-maturity. Our financial instruments owned, at fair value are highly liquid investments. Accounts receivable are current assets and primarily represent receivables from advisory fees we earn from our ETPs. Our current liabilities consist primarily of convertible notes maturing in the next 12 months, payments owed to vendors and third parties in the normal course of business, deferred consideration and accrued incentive compensation for employees.
46
Cash and cash equivalents decreased by $13.0 million during the three months ended March 31, 2023 due to $130.0 million of proceeds from the issuance of convertible notes, $18.3 million of proceeds from the sale of financial instruments owned, at fair value and $0.4 million from other activities. These increases were offset by $124.3 million used to repurchase convertible notes, $20.3 million used to purchase financial instruments owned, at fair value, $5.4 million used in operating activities, $4.8 million used to pay dividends, $3.5 million used to cover convertible notes issuance costs and $3.4 million used to repurchase our common stock.
Cash and cash equivalents decreased by $30.3 million during the three months ended March 31, 2022 due to $25.5 million used to purchase securities owned, $6.9 million used to purchase investments, $4.8 million used to pay dividends on our common stock, $3.4 million used to repurchase our common stock, $2.7 million of net cash used in operating activities and $0.6 million used in other activities. These decreases were partly offset by $13.6 million of proceeds from the sale of securities owned.
Issuance of Convertible Notes
On February 14, 2023, we issued and sold $130.0 million in aggregate principal amount of 5.75% Convertible Senior Notes due 2028 (the “2023 Notes”) pursuant to an indenture dated February 14, 2023, between us and U.S. Bank Trust Company, National Association, as trustee, in a private offering to qualified institutional buyers pursuant to Rule 144A under the Securities Act of 1933, as amended (“Rule 144A”).
On June 14, 2021, we issued and sold $150.0 million in aggregate principal amount of 3.25% Convertible Senior Notes due 2026 (the “2021 Notes”) pursuant to an indenture dated June 14, 2021, between us and the trustee, in a private offering to qualified institutional buyers pursuant to Rule 144A.
On June 16, 2020, we issued and sold $150.0 million in aggregate principal amount of 4.25% Convertible Senior Notes due 2023 (the “June 2020 Notes”) pursuant to an indenture dated June 16, 2020, between us and the trustee, in a private offering to qualified institutional buyers pursuant to Rule 144A. On August 13, 2020, we issued and sold $25.0 million in aggregate principal amount of 4.25% Convertible Senior Notes due 2023 at a price equal to 101% of the principal amount thereof, plus interest deemed to have accrued since June 16, 2020, which constitute a further issuance of, and form a single series with, our June 2020 Notes (the “August 2020 Notes” and together with the June 2020 Notes, the “2020 Notes”).
In connection with the issuance of the 2023 Notes, we repurchased $115.0 million in aggregate principal amount of the 2020 Notes. As a result of this repurchase, we recognized a loss on extinguishment of approximately $9.7 million during the three months ended March 31, 2023.
After the issuance of the 2023 Notes (and together with the remaining 2020 Notes and the 2021 Notes, the “Convertible Notes”), we had $340.0 million in aggregate principal amount of Convertible Notes outstanding.
Key terms of the Convertible Notes are as follows:
2023 Notes | 2021 Notes | 2020 Notes | ||||||||||||
Principal outstanding |
$130.0 | $150.0 | $60.0 | |||||||||||
Maturity date (unless earlier converted, repurchased or redeemed) |
August 15, 2028 | June 15, 2026 | June 15, 2023 | |||||||||||
Interest rate |
5.75% | 3.25% | 4.25% | |||||||||||
Conversion price |
$9.54 | $11.04 | $5.92 | |||||||||||
Conversion rate |
104.8658 | 90.5797 | 168.9189 | |||||||||||
Redemption price |
$12.40 | $14.35 | $7.70 |
• | Interest rate: Payable semiannually in arrears on February 15 and August 15 of each year for the 2023 Notes (beginning on August 15, 2023) and June 15 and December 15 of each year for the 2020 Notes and the 2021 Notes. |
• | Conversion price: Convertible at an initial conversion rate into shares of our common stock, per $1,000 principal amount of notes (equivalent to an initial conversion price set forth in the table above), subject to adjustment. |
• | Conversion: Holders may convert at their option at any time prior to the close of business on the business day immediately preceding May 15, 2028, March 15, 2026 and March 15, 2023 for the 2023 Notes, 2021 Notes and 2020 Notes, respectively, only under the following circumstances: (i) if the last reported sale price of our common stock for at least 20 trading days during a period of 30 consecutive trading days ending on the last trading day of the immediately preceding calendar quarter is greater than or equal to 130% of the conversion price for the respective Convertible Notes on each applicable trading day; (ii) during the five business day period after any ten consecutive trading day period (the “measurement period”) in which the trading price per $1,000 principal amount of the Convertible Notes for each trading day of the measurement period was less than 98% of the product of the last reported sales price of our common stock and the conversion rate on each such trading day; (iii) upon a notice of redemption delivered by us in accordance with the terms of the indentures but only with respect to the Convertible Notes called (or deemed called) for redemption; or (iv) upon the occurrence of specified corporate events. On or after May 15, 2028, March 15, 2026 and March 15, 2023 in |
47
respect of the 2023 Notes, 2021 Notes and 2020 Notes, respectively, until the close of business on the second scheduled trading day immediately preceding the maturity date, holders may convert their Convertible Notes at any time, regardless of the foregoing circumstances. |
• | Cash settlement of principal amount: Upon conversion, we will pay cash up to the aggregate principal amount of the Convertible Notes to be converted. At our election, we will also settle our conversion obligation in excess of the aggregate principal amount of the Convertible Notes being converted in either cash, shares of our common stock or a combination of cash and shares of its common stock. |
• | Redemption price: We may redeem for cash all or any portion of the Convertible Notes, at our option, on or after August 20, 2025, June 20, 2023 and June 20, 2021 in respect of the 2023 Notes, 2021 Notes and 2020 Notes, respectively, and on or prior to the 55th scheduled trading day immediately preceding the maturity date, if the last reported sale price of our common stock has been at least 130% of the conversion price for the respective Convertible Notes then in effect for at least 20 trading days, including the trading day immediately preceding the date on which we provide notice of redemption, during any 30 consecutive trading day period ending on, and including, the trading day immediately preceding the date on which we provide notice of redemption, at a redemption price equal to 100% of the principal amount of the notes to be redeemed, plus accrued and unpaid interest to, but excluding the redemption date. No sinking fund is provided for the Convertible Notes. |
• | Limited investor put rights: Holders of the Convertible Notes have the right to require us to repurchase for cash all or a portion of their notes at 100% of their principal amount, plus any accrued and unpaid interest, upon the occurrence of certain change of control transactions or liquidation, dissolution or common stock delisting events. |
• | Conversion rate increase in certain customary circumstances: In certain circumstances, conversions in connection with a “make-whole fundamental change” (as defined in the indentures) or conversions of Convertible Notes called (or deemed called) for redemption may result in an increase to the conversion rate, provided that the conversion rate will not exceed 167.7853 shares, 144.9275 shares and 270.2702 shares of our common stock per $1,000 principal amount of the 2023 Notes, 2021 Notes and 2020 Notes, respectively (the equivalent of 59,767,426 shares of our common stock), subject to adjustment. |
• | Seniority and Security: The Convertible Notes rank equal in right of payment, and are our senior unsecured obligations, but are subordinated in right of payment to our obligations to make certain redemption payments (if and when due) in respect of its Series A Non-Voting Convertible Preferred Stock (See Note 11 to our Consolidated Financial Statements). |
The indentures contain customary terms and covenants, including that upon certain events of default occurring and continuing, either the trustee or the holders of not less than 25% in aggregate principal amount of the Convertible Notes outstanding may declare the entire principal amount of all the Convertible Notes to be repurchased, plus any accrued special interest, if any, to be immediately due and payable.
Capital Resources
Our principal source of financing is our operating cash flow. We believe that current cash flows generated by our operating activities and existing cash balances should be sufficient for us to fund our operations for the foreseeable future.
Our ability to satisfy our contractual obligations as they arise are discussed in the section titled “Contractual Obligations” below.
Use of Capital
Our business does not require us to maintain a significant cash position. However, certain of our subsidiaries are required to maintain a minimum level of regulatory capital, which at March 31, 2023 was approximately $28.7 million in the aggregate. Notwithstanding these regulatory capital requirements, we expect that our main uses of cash will be to fund the ongoing operations of our business. We also maintain a capital return program which includes a $0.03 per share quarterly cash dividend and authority to purchase our common stock through April 27, 2025, including purchases to offset future equity grants made under our equity plans.
During the three months ended March 31, 2023, we repurchased 604,505 shares of our common stock under the repurchase program for an aggregate cost of $3.4 million. Currently, approximately $96.6 million remains under this program for future purchases.
Contractual Obligations
Convertible Notes
We currently have $340.0 million in aggregate principal amount of Convertible Notes outstanding, of which $60.0 million, $150.0 million and $130.0 million are scheduled to mature on June 15, 2023, June 15, 2026 and August 15, 2028, respectively, unless earlier converted, repurchased or redeemed. Conditional conversions or a requirement to repurchase the Convertible Notes upon the occurrence of a fundamental change may accelerate payment.
48
The Convertible Notes require cash settlement of the principal amount, while settlement of the conversion obligation in excess of the aggregate principal amount may be satisfied in either cash, shares of our common stock or a combination of cash and shares of our common stock. We anticipate settling the $60.0 million in aggregate principal amount of 2020 Notes scheduled to mature in June 2023 and may settle and/or refinance the remaining obligations when due.
See the section titled “Issuance of Convertible Notes” above for additional information.
Deferred Consideration—Gold Payments
Deferred consideration represents an obligation we assumed in April 2018 in connection with our acquisition of the European exchange-traded commodity, currency and leveraged-and-inverse business of ETFS Capital. The obligation is for fixed payments to ETFS Capital of physical gold bullion equating to 9,500 ounces of gold per year through March 31, 2058 and then subsequently reduced to 6,333 ounces of gold per year continuing into perpetuity (“Contractual Gold Payments”). The present value of the deferred consideration was $179.8 million at March 31, 2023.
The Contractual Gold Payments are paid from advisory fee income generated by any of our sponsored financial products backed by physical gold with no recourse back to us for any unpaid amounts that exceed advisory fees earned.
Operating Leases
Total future minimum lease payments with respect to our operating lease liabilities were $1.2 million at March 31, 2023. Cash flows generated by our operating activities and existing cash balances should be sufficient to satisfy the future minimum lease payments.
See Note 12 to our Consolidated Financial Statements for additional information.
Off-Balance Sheet Arrangements
We do not have any off-balance sheet financing or other arrangements and have neither created nor are party to any special-purpose or off-balance sheet entities for the purpose of raising capital, incurring debt or operating our business.
Critical Accounting Policies and Estimates
Goodwill and Intangible Assets
Goodwill is the excess of the purchase price over the fair values of the identifiable net assets at the acquisition date. We test goodwill for impairment at least annually and at the time of a triggering event requiring re-evaluation, if one were to occur. Goodwill is considered impaired when the estimated fair value of the reporting unit that was allocated the goodwill is less than its carrying value. If the estimated fair value of such reporting unit is less than its carrying value, goodwill impairment is recognized based on that difference, not to exceed the carrying amount of goodwill. A reporting unit is an operating segment or a component of an operating segment provided that the component constitutes a business for which discrete financial information is available and management regularly reviews the operating results of that component.
Goodwill is allocated to our U.S. Business and European Business components. For impairment testing purposes, these components are aggregated as a single reporting unit as they fall under the same operating segment and have similar economic characteristics.
Goodwill is assessed for impairment annually on November 30th. When performing our goodwill impairment test, we consider a qualitative assessment, when appropriate, and the market approach and its market capitalization when determining the fair value of the reporting unit. The results of our most recent analysis indicated no impairment based upon a quantitative assessment.
Indefinite-lived intangible assets are tested for impairment at least annually and are reviewed for impairment whenever events or changes in circumstances indicate that the carrying amount of an asset may not be recoverable. Indefinite-lived intangible assets are impaired if their estimated fair value is less than their carrying value. We may rely on a qualitative assessment when performing our intangible asset impairment test. Otherwise, the impairment evaluation is performed at the lowest level of reasonably identifiable cash flows independent of other assets. The annual impairment testing date for our intangible assets is November 30th. The results of our most recent analysis indicated no impairment based upon a quantitative assessment (discounted cash flow analysis) which relied upon significant unobservable inputs including projected revenue growth rates ranging from 3% to 8% (5% weighted average) and a weighted average cost of capital of 11.0%.
Investments
We account for equity investments that do not have a readily determinable fair value under the measurement alternative prescribed within ASU 2016-01, Financial Instruments – Recognition and Measurement of Financial Assets and Financial Liabilities,
49
to the extent such investments are not subject to consolidation or the equity method. Under the measurement alternative, these financial instruments are carried at cost, less any impairment (assessed quarterly), plus or minus changes resulting from observable price changes in orderly transactions for an identical or similar investment of the same issuer. In addition, income is recognized when dividends are received only to the extent they are distributed from net accumulated earnings of the investee. Otherwise, such distributions are considered returns of investment and are recorded as a reduction of the cost of the investment.
Investments in debt instruments are accounted for at fair value, with changes in fair value reported in other income/(expenses).
See Note 8 to our Consolidated Financial Statements for information.
Deferred Consideration—Gold Payments
Deferred consideration represents the present value of an obligation to pay gold to a third party into perpetuity and is measured using forward-looking gold prices observed on the CMX exchange, a selected discount rate and perpetual growth rate. The weighted average forward-looking gold price per ounce, discount rate and perpetual growth rate were $2,401, 13.3% and 1.5%, respectively, at March 31, 2023. Changes in the fair value of this obligation are reported as (gain)/loss on revaluation of deferred consideration–gold payments on our Consolidated Statements of Operations.
During the three months ended March 31, 2023, we reported a gain on deferred consideration—gold payments of $20.6 million. A 1.0% increase in the weighted average forward-looking gold price per ounce would have decreased this reported gain by $1.3 million, a 1 percentage point increase in the discount rate would have increased this reported gain by $12.9 million and a 1 percentage point increase in the perpetual growth rate would have decreased this reported gain by $9.3 million. See Note 9 to our Consolidated Financial Statements for additional information.
Revenue Recognition
We earn substantially all of our revenue in the form of advisory fees from our ETPs and recognize this revenue over time, as the performance obligation is satisfied. Advisory fees are based on a percentage of the ETPs’ average daily net assets. Progress is measured using the practical expedient under the output method resulting in the recognition of revenue in the amount for which we have a right to invoice.
ITEM 3. QUANTITATIVE AND QUALITATIVE DISCLOSURES ABOUT MARKET RISK
The following information, together with information included in other parts of this Management’s Discussion and Analysis of Financial Condition and Results of Operations, describes key aspects of our market risk.
Market Risk
Market risk to us generally represents the risk of changes in the value of our ETPs that results from fluctuations in securities or commodity prices, foreign currency exchange rates against the U.S. dollar, and interest rates. Nearly all our revenues are derived from advisory agreements for the WisdomTree ETPs. Under these agreements, the advisory fee we receive is based on the average market value of the assets in the WisdomTree ETP portfolios we manage.
Fluctuations in the value of the ETPs are common and are generated by numerous factors such as market volatility, the global economy, inflation, changes in investor strategies and sentiment, availability of alternative investment vehicles, domestic and foreign government regulations, emerging markets developments and others. Accordingly, changes in any one or a combination of these factors may reduce the value of investment securities and, in turn, the underlying AUM on which our revenues are earned. These declines may cause investors to withdraw funds from our ETPs in favor of investments that they perceive as offering greater opportunity or lower risk, thereby compounding the impact on our revenues. We believe challenging and volatile market conditions will continue to be present in the foreseeable future.
Interest Rate Risk
We invest our corporate cash in short-term interest earning assets, primarily in federal agency debt instruments, WisdomTree fixed income ETFs, U.S. treasuries, corporate bonds, money market instruments at a commercial bank and other securities which totaled $134.3 million and $130.8 million as of March 31, 2022 and 2023, respectively. During the three months ended March 31, 2023, we recognized losses on these securities of $2.0 million and any losses recognized in the future may be material to our operating results. We do not anticipate that changes in interest rates will have a material impact on our financial condition or cash flows.
In addition, our Convertible Notes bear interest at fixed rates of 5.75%, 3.25% and 4.25% for the 2023 Notes, 2021 Notes and 2020 Notes, respectively. Therefore, we have no direct financial statement risk associated with changes in interest rates. However, the fair value of the Convertible Notes changes primarily when the market price of our common stock fluctuates or interest rates change.
50
Exchange Rate Risk
We are subject to currency translation exposure on the results of our non-U.S. operations, primarily in the United Kingdom and Europe. Foreign currency translation risk is the risk that exchange rate gains or losses arise from translating foreign entities’ statements of earnings and balance sheets from functional currency to our reporting currency (the U.S. dollar) for consolidation purposes. The advisory fees earned on our international listed ETPs are predominantly in U.S. dollars (and also paid in gold ounces, as described below); however, expenses for corporate overhead are generally incurred in British pounds. Currently, we do not enter into derivative financial instruments aimed at offsetting certain exposures in the statement of operations or the balance sheet but may seek to do so in the future.
Exchange rate risk associated with the euro is not considered to be significant.
Commodity and Cryptocurrency Price Risk
Fluctuations in the prices of commodities and cryptocurrencies that are linked to certain of our ETPs could have a material adverse effect on our AUM and revenues. In addition, a portion of the advisory fee revenues we receive on our ETPs backed by gold, other precious metals and cryptocurrencies are paid in the underlying metal or cryptocurrency. In addition, we pay gold ounces to satisfy our deferred consideration obligation (See Note 9 to our Consolidated Financial Statements). While we readily sell the gold, precious metals and cryptocurrencies that we earn under these advisory contracts, we still may maintain a position. We currently do not enter into arrangements to hedge against fluctuations in the price of these commodities and cryptocurrencies and any hedging we may undertake in the future may not be cost-effective or sufficient to hedge against this exposure.
ITEM 4. CONTROLS AND PROCEDURES
Evaluation of Disclosure Controls and Procedures
As of March 31, 2023, our management, with the participation of our Chief Executive Officer and Chief Financial Officer, evaluated the effectiveness of our disclosure controls and procedures pursuant to Rule 13a-15(b) promulgated under the Exchange Act. Based upon that evaluation, our Chief Executive Officer and Chief Financial Officer concluded that, as of March 31, 2023, our disclosure controls and procedures were effective at a reasonable assurance level in ensuring that material information required to be disclosed by us in the reports that we file or submit under the Exchange Act is recorded, processed, summarized and reported within the time periods specified in the rules, regulations and forms of the SEC, including ensuring that such material information is accumulated by and communicated to our management, including our Chief Executive Officer and Chief Financial Officer, as appropriate to allow timely decisions regarding required disclosure.
Changes in Internal Control over Financial Reporting
During the quarter ended March 31, 2023, there were no changes in our internal control over financial reporting that have materially affected, or are reasonably likely to materially affect, our internal control over financial reporting.
PART II: OTHER INFORMATION
ITEM 1. LEGAL PROCEEDINGS
We may be subject to reviews, inspections and investigations by the SEC, Commodity Futures Trading Commission (CFTC), National Futures Association (NFA), state and foreign regulators, as well as legal proceedings arising in the ordinary course of business. See Note 13 to our Consolidated Financial Statements for additional information regarding claims brought by investors in our WisdomTree WTI Crude Oil 3x Daily Leveraged ETP totaling approximately €15.8 million ($17.2 million).
ITEM 1A. RISK FACTORS
You should carefully consider the information set forth in Part 1, Item1A. “Risk Factors” in our Annual Report on Form 10-K for the fiscal year ended December 31, 2022.
ITEM 2. UNREGISTERED SALES OF EQUITY SECURITIES AND USE OF PROCEEDS
Recent sales of Unregistered Securities
None.
Use of Proceeds
Not applicable.
51
Purchases of Equity Securities by the Issuer and Affiliated Purchasers
The following table provides information with respect to purchases made by or on behalf of the Company or any “affiliated purchaser” of shares of our common stock.
Total Number of Shares Purchased |
Average Price Paid Per Share |
Total Number of Shares Purchased as Part of Publicly Announced Plans or Programs |
Approximate Dollar Value of Shares that May Yet Be Purchased Under the Plans or Programs | |||||||||||||
Period |
(in thousands) | |||||||||||||||
January 1, 2023 to January 31, 2023 |
602,327 | $ | 5.60 | 602,327 | ||||||||||||
February 1, 2023 to February 28, 2023 |
— | $ | — | — | ||||||||||||
March 1, 2023 to March 31, 2023 |
2,178 | $ | 5.62 | 2,178 | ||||||||||||
|
|
|
|
|
|
|||||||||||
Total |
604,505 | $ | 5.60 | 604,505 | $ | 96,592 | ||||||||||
|
|
|
|
|
|
|
|
|
On February 22, 2022, our Board of Directors approved an increase of $85.7 million to our share repurchase program and extended the term for three years through April 27, 2025. During the three months ended March 31, 2023, we repurchased 604,505 shares of our common stock under this program for an aggregate cost of approximately $3.4 million. As of March 31, 2023, $96.6 million remained under this program for future repurchases.
ITEM 3. DEFAULTS UPON SENIOR SECURITIES
None.
ITEM 4. MINE SAFETY DISCLOSURES
Not applicable.
ITEM 5. OTHER INFORMATION
None.
52
ITEM 6. EXHIBITS
EXHIBIT INDEX
53
Exhibit Number |
Description | |
4.13 |
Stockholder Rights Agreement, dated March 17, 2023, between the Registrant and Continental Stock Transfer & Trust Company, as Rights Agent (incorporated by reference to Exhibit 4.1 of the Registrant’s Registration Statement on Form 8-A filed with the SEC on March 20, 2023) | |
4.14 |
Amendment No. 1 to Stockholder Rights Agreement, dated as of May 4, 2023, between the Registrant and Continental Stock Transfer & Trust Company, as Rights Agent (incorporated by reference to Exhibit 4.1 of the Registrant’s Current Report on Form 8-K filed with the SEC on May 5, 2023). | |
10.1(1) |
Amendment to Employment Agreement between the Registrant and Alexis Marinof, dated April 21, 2023 | |
10.2(1) |
Form of Amendment, dated April 21, 2023, to Employment Agreements between the Registrant and each of Jonathan Steinberg, Peter M. Ziemba, R. Jarrett Lilien and Marci Frankenthaler | |
10.3(1) |
WisdomTree, Inc. Executive Severance Plan | |
10.4(1) |
Form of Employee Confidentiality, Assignment and Restrictive Covenant Agreement executed by participants of the WisdomTree, Inc. Executive Severance Plan | |
31.1(1) |
Rule 13a-14(a) / 15d—14(a) Certification | |
31.2(1) |
Rule 13a-14(a) / 15d—14(a) Certification | |
32.1(2) |
Certification pursuant to 18 U.S.C. Section 1350, as adopted pursuant to Section 906 of the Sarbanes-Oxley Act of 2002 | |
101(1) |
Financial Statements from the Quarterly Report on Form 10-Q of the Company for the three months ended March 31, 2023, formatted in XBRL: (i) Consolidated Balance Sheets at March 31, 2023 (Unaudited) and December 31, 2022; (ii) Consolidated Statements of Operations and Comprehensive Income/(Loss) for the three months ended March 31, 2023 and March 31, 2022 (Unaudited); (iii) Consolidated Statements of Changes in Stockholders’ Equity for the three months ended March 31, 2023 and March 31, 2022 (Unaudited) (iv) Consolidated Statements of Cash Flows for the three months ended March 31, 2023 and March 31, 2022 (Unaudited); and (v) Notes to Consolidated Financial Statements, as blocks of text and in detail. | |
101.SCH(1) |
Inline XBRL Taxonomy Extension Schema Document | |
101.CAL(1) |
Inline XBRL Taxonomy Extension Calculation Linkbase Document | |
101.DEF(1) |
Inline XBRL Taxonomy Extension Definition Linkbase Document | |
101.LAB(1) |
Inline XBRL Taxonomy Extension Labels Linkbase Document | |
101.PRE(1) |
Inline XBRL Taxonomy Extension Presentation Linkbase Document | |
104(1) |
Cover Page Interactive Data File (formatted as inline XBRL with applicable taxonomy extension information contained in Exhibits 101.*) |
(1) | Filed herewith. |
(2) | Furnished herewith. |
54
SIGNATURE
Pursuant to the requirements of the Exchange Act, the registrant has duly caused this report to be signed on its behalf by the undersigned hereunto duly authorized on this 9th day of May 2023.
WISDOMTREE, INC. | ||
By: | /s/ Jonathan Steinberg | |
Jonathan Steinberg | ||
Chief Executive Officer (Principal Executive Officer) | ||
WISDOMTREE, INC. | ||
By: | /s/ Bryan Edmiston | |
Bryan Edmiston | ||
Chief Financial Officer (Principal Financial Officer and Principal Accounting Officer) |
55