Exhibit 99.1

Gold Royalty Buyout May 2023
Exhibit 99.1
Gold Royalty Buyout May 2023
Forward looking statements This presentation contains forward-looking statements that are based on our management’s beliefs and assumptions and on information currently available to our management. Although we believe that the expectations reflected in these forward-looking statements are reasonable, these statements relate to future events or our future financial performance, and involve known and unknown risks, uncertainties and other factors that may cause our actual results, levels of activity, performance or achievements to be materially different from any future results, levels of activity, performance or achievements expressed or implied by these forward-looking statements. In some cases, you can identify forward-looking statements by terminology such as “may,” “will,” “should,” “expects,” “intends,” “plans,” “anticipates,” “believes,” “estimates,” “predicts,” “potential,” “continue” or the negative of these terms or other comparable terminology. These statements are only predictions. You should not place undue reliance on forward-looking statements because they involve known and unknown risks, uncertainties and other factors, which are, in some cases, beyond our control and which could materially affect results. Factors that may cause actual results to differ materially from current expectations include, among other things, the risks described below. If one or more of these or other risks or uncertainties occur, or if our underlying assumptions prove to be incorrect, actual events or results may vary significantly from those implied or projected by the forward-looking statements. No forward-looking statement is a guarantee of future performance. You should read this presentation completely and with the understanding that our actual future results may be materially different from any future results expressed or implied by these forward-looking statements. In particular, forward-looking statements in this presentation may include statements about: the potential effects of the Gold Royalty Buyout transaction on WisdomTree’s earnings per share, net income, operating income, operating margin, interest income, dilution and the price of its common stock. Our business is subject to many risks and uncertainties, including without limitation: • declining prices of securities, gold and other precious metals and other commodities and changes in interest rates and general market conditions can adversely affect our business by reducing the market value of the assets we manage or causing WisdomTree ETP investors to sell their fund shares and trigger redemptions; • fluctuations in the amount and mix of our AUM, whether caused by disruptions in the financial markets or otherwise, including but not limited to a pandemic event such as COVID-19, or the war in Ukraine, may negatively impact revenues and operating margins, and may impede our ability to refinance our debt upon maturity or increase the cost of borrowing upon a refinancing; • competitive pressures could reduce revenues and profit margins; • we derive a substantial portion of our revenues from a limited number of products, and as a result, our operating results are particularly exposed to investor sentiment toward investing in the products’ strategies and our ability to maintain the AUM of these products, as well as the performance of these products and market-specific and political and economic risk; • a significant portion of our AUM is held in products with exposure to U.S. and international developed markets and we therefore have exposure to domestic and foreign market conditions and are subject to currency exchange rate risks; • withdrawals or broad changes in investments in our ETPs by investors with significant positions may negatively impact revenues and operating margins; • we face increased operational, regulatory, financial and other risks as a result of conducting our business internationally; • many of our ETPs have a limited track record, and poor investment performance could cause our revenues to decline; • we depend on third parties to provide many critical services to operate our business and our ETPs. The failure of key vendors to adequately provide such services could materially affect our operating business and harm WisdomTree ETP investors; and • actions of activist stockholders against us have been costly and may be disruptive and cause uncertainty about the strategic direction of our business. Other factors, such as general economic conditions, including currency exchange rate fluctuations, also may have an effect on the results of our operations. For a more complete description of the risks noted above and other risks that could cause our actual results to differ from our current expectations, see “Risk Factors” in our Annual Report on Form 10-K for the year ended December 31, 2022. The forward-looking statements in this presentation represent our views as of the date of this presentation. We anticipate that subsequent events and developments may cause our views to change. However, while we may elect to update these forward-looking statements at some point in the future, we have no current intention of doing so except to the extent required by applicable law. Therefore, these forward-looking statements do not represent our views as of any date other than the date of this presentation.
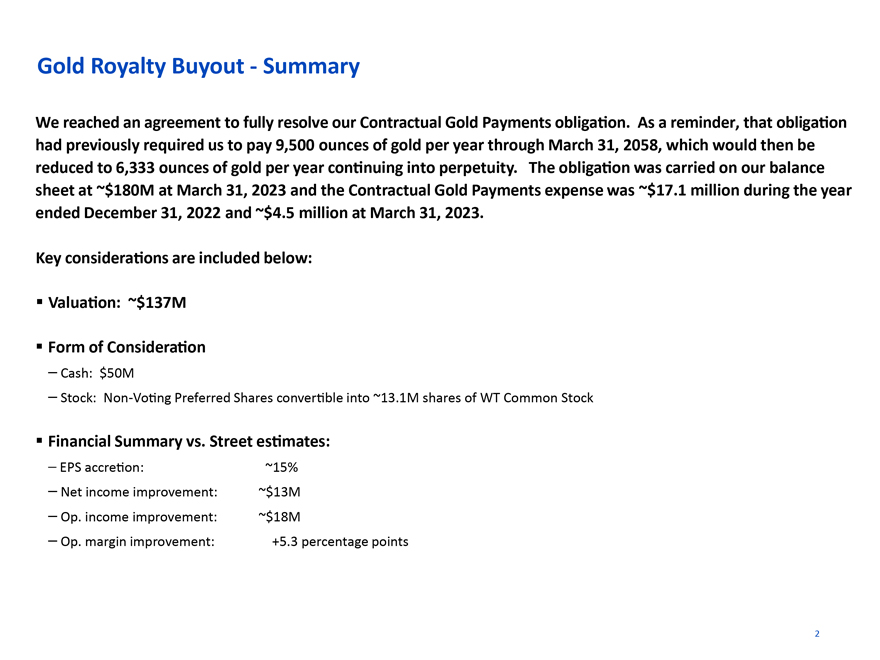
1 Gold Royalty Buyout—Summary We reached an agreement to fully resolve our Contractual Gold Payment obligation. As a reminder, that obligation had previously required us to pay 9,500 ounces of gold per year through March 31, 2058, which would then be reduced to 6,333 ounces of gold per year continuing into perpetuity. The obligation was carried on our balance sheet at ~$180M at March 31, 2023 and the Contractual Gold Payment expense was ~$17.1 million during the year ended December 31, 2022 and ~$4.5 million at March 31, 2023. Key considerations are included below: ï,§ Valuation: ~$137M ï,§ Form of Consideration – Cash: $50M – Stock: Non-Voting Preferred Shares convertible into ~13.1M shares of WT Common Stock ï,§ Financial Summary vs. Street estimates: – EPS accretion: ~15% – Net income improvement: ~$13M – Op. income improvement: ~$18M – Op. margin improvement: +5.3 percentage points 2 2
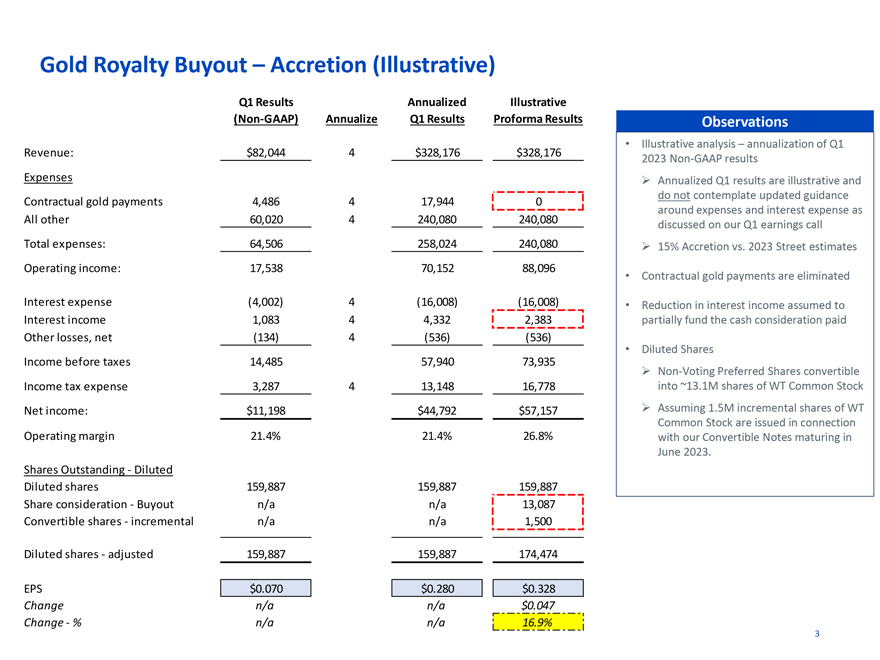
Gold Royalty Buyout – Accretion (Illustrative) Q1 Results Annualized Illustrative (Non-GAAP) Annualize Q1 Results Proforma Results Revenue: $82,044 4 $328,176 $328,176 Expenses Contractual gold payments 4,486 4 17,944 0 All other 60,020 4 240,080 240,080 Total expenses: 64,506 258,024 240,080 Operating income: 17,538 70,152 88,096 Interest expense (4,002) 4 (16,008) (16,008) Interest income 1,083 4 4,332 2,383 Other losses, net (134) 4 (536) (536) Income before taxes 14,485 57,940 73,935 Income tax expense 3,287 4 13,148 16,778 Net income: $11,198 $44,792 $57,157 Operating margin 21.4% 21.4% 26.8% Shares Outstanding—Diluted Diluted shares 159,887 159,887 159,887 Share consideration—Buyout n/a n/a 13,087 Convertible shares—incremental n/a n/a 1,500 Diluted shares—adjusted 159,887 159,887 174,474 EPS $0.070 $0.280 $0.328 Change n/a n/a $0.047 Change—% n/a n/a 16.9% Observations • Illustrative analysis – annualization of Q1 2023 Non-GAAP resultsïƒ~ Annualized Q1 results are illustrative and do not contemplate updated guidance around expenses and interest expense as discussed on our Q1 earnings callïƒ~ 15% Accretion vs. 2023 Street estimates • Contractual gold payments are eliminated • Reduction in interest income assumed to partially fund the cash consideration paid • Diluted Shares ïƒ~ Non-Voting Preferred Shares convertible into ~13.1M shares of WT Common Stockïƒ~ Assuming 1.5M incremental shares of WT Common Stock are issued in connection with our Convertible Notes maturing in June 2023. 3 3

Appendix
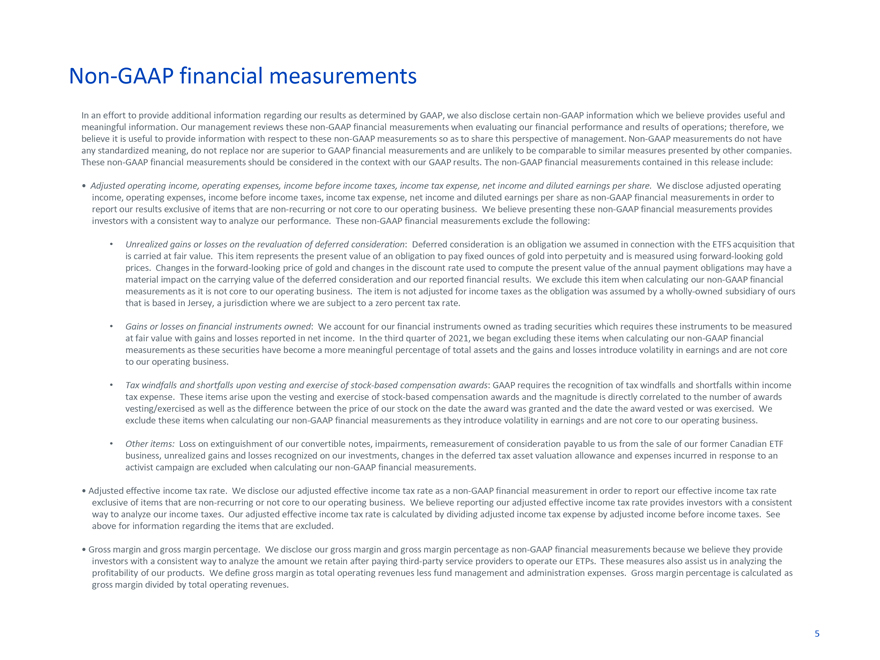
Non-GAAP financial measurements In an effort to provide additional information regarding our results as determined by GAAP, we also disclose certain non-GAAP information which we believe provides useful and meaningful information. Our management reviews these non-GAAP financial measurements when evaluating our financial performance and results of operations; therefore, we believe it is useful to provide information with respect to these non-GAAP measurements so as to share this perspective of management. Non-GAAP measurements do not have any standardized meaning, do not replace nor are superior to GAAP financial measurements and are unlikely to be comparable to similar measures presented by other companies. These non-GAAP financial measurements should be considered in the context with our GAAP results. The non-GAAP financial measurements contained in this release include: • Adjusted operating income, operating expenses, income before income taxes, income tax expense, net income and diluted earnings per share. We disclose adjusted operating income, operating expenses, income before income taxes, income tax expense, net income and diluted earnings per share as non-GAAP financial measurements in order to report our results exclusive of items that are non-recurring or not core to our operating business. We believe presenting these non-GAAP financial measurements provides investors with a consistent way to analyze our performance. These non-GAAP financial measurements exclude the following: • Unrealized gains or losses on the revaluation of deferred consideration: Deferred consideration is an obligation we assumed in connection with the ETFS acquisition that is carried at fair value. This item represents the present value of an obligation to pay fixed ounces of gold into perpetuity and is measured using forward-looking gold prices. Changes in the forward-looking price of gold and changes in the discount rate used to compute the present value of the annual payment obligations may have a material impact on the carrying value of the deferred consideration and our reported financial results. We exclude this item when calculating our non-GAAP financial measurements as it is not core to our operating business. The item is not adjusted for income taxes as the obligation was assumed by a wholly-owned subsidiary of ours that is based in Jersey, a jurisdiction where we are subject to a zero percent tax rate. • Gains or losses on financial instruments owned: We account for our financial instruments owned as trading securities which requires these instruments to be measured at fair value with gains and losses reported in net income. In the third quarter of 2021, we began excluding these items when calculating our non-GAAP financial measurements as these securities have become a more meaningful percentage of total assets and the gains and losses introduce volatility in earnings and are not core to our operating business. • Tax windfalls and shortfalls upon vesting and exercise of stock-based compensation awards: GAAP requires the recognition of tax windfalls and shortfalls within income tax expense. These items arise upon the vesting and exercise of stock-based compensation awards and the magnitude is directly correlated to the number of awards vesting/exercised as well as the difference between the price of our stock on the date the award was granted and the date the award vested or was exercised. We exclude these items when calculating our non-GAAP financial measurements as they introduce volatility in earnings and are not core to our operating business. • Other items: Loss on extinguishment of our convertible notes, impairments, remeasurement of consideration payable to us from the sale of our former Canadian ETF business, unrealized gains and losses recognized on our investments, changes in the deferred tax asset valuation allowance and expenses incurred in response to an activist campaign are excluded when calculating our non-GAAP financial measurements. • Adjusted effective income tax rate. We disclose our adjusted effective income tax rate as a non-GAAP financial measurement in order to report our effective income tax rate exclusive of items that are non-recurring or not core to our operating business. We believe reporting our adjusted effective income tax rate provides investors with a consistent way to analyze our income taxes. Our adjusted effective income tax rate is calculated by dividing adjusted income tax expense by adjusted income before income taxes. See above for information regarding the items that are excluded. • Gross margin and gross margin percentage. We disclose our gross margin and gross margin percentage as non-GAAP financial measurements because we believe they provide investors with a consistent way to analyze the amount we retain after paying third-party service providers to operate our ETPs. These measures also assist us in analyzing the profitability of our products. We define gross margin as total operating revenues less fund management and administration expenses. Gross margin percentage is calculated as gross margin divided by total operating revenues. 5
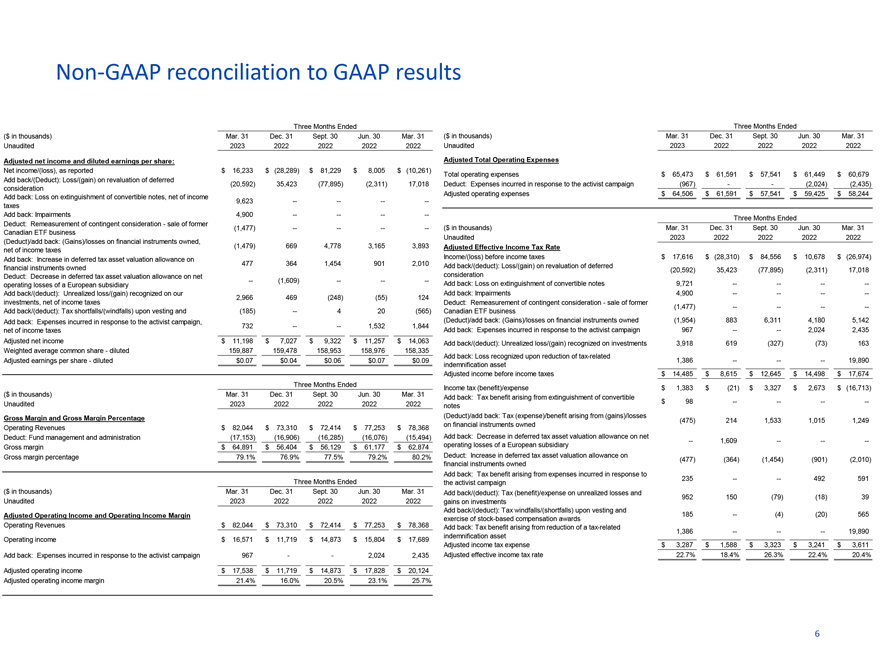
Non-GAAP reconciliation to GAAP results Three Months Ended ($ in thousands) Mar. 31 Dec. 31 Sept. 30 Jun. 30 Mar. 31 Unaudited 2023 2022 2022 2022 2022 Adjusted net income and diluted earnings per share: Net income/(loss), as reported $ 16,233 $ (28,289) $ 81,229 $ 8,005 $ (10,261) Add back/(Deduct): Loss/(gain) on revaluation of deferred (20,592) 35,423 (77,895) (2,311) 17,018 consideration Add back: Loss on extinguishment of convertible notes, net of income 9,623 ——— -taxes Add back: Impairments 4,900 ——— -Deduct: Remeasurement of contingent consideration—sale of former (1,477) ——— -Canadian ETF business (Deduct)/add back: (Gains)/losses on financial instruments owned, (1,479) 669 4,778 3,165 3,893 net of income taxes Add back: Increase in deferred tax asset valuation allowance on 477 364 1,454 901 2,010 financial instruments owned Deduct: Decrease in deferred tax asset valuation allowance on net —(1,609) —— -operating losses of a European subsidiary Add back/(deduct): Unrealized loss/(gain) recognized on our 2,966 469 (248) (55) 124 investments, net of income taxes Add back/(deduct): Tax shortfalls/(windfalls) upon vesting and (185) —4 20 (565) Add back: Expenses incurred in response to the activist campaign, 732 ——1,532 1,844 net of income taxes Adjusted net income $ 11,198 $ 7,027 $ 9,322 $ 11,257 $ 14,063 Weighted average common share—diluted 159,887 159,478 158,953 158,976 158,335 Adjusted earnings per share—diluted $0.07 $0.04 $0.06 $0.07 $0.09 Three Months Ended ($ in thousands) Mar. 31 Dec. 31 Sept. 30 Jun. 30 Mar. 31 Unaudited 2023 2022 2022 2022 2022 Gross Margin and Gross Margin Percentage Operating Revenues $ 82,044 $ 73,310 $ 72,414 $ 77,253 $ 78,368 Deduct: Fund management and administration (17,153) (16,906) (16,285) (16,076) (15,494) Gross margin $ 64,891 $ 56,404 $ 56,129 $ 61,177 $ 62,874 Gross margin percentage 79.1% 76.9% 77.5% 79.2% 80.2% Three Months Ended ($ in thousands) Mar. 31 Dec. 31 Sept. 30 Jun. 30 Mar. 31 Unaudited 2023 2022 2022 2022 2022 Adjusted Operating Income and Operating Income Margin Operating Revenues $ 82,044 $ 73,310 $ 72,414 $ 77,253 $ 78,368 Operating income $ 16,571 $ 11,719 $ 14,873 $ 15,804 $ 17,689 Add back: Expenses incurred in response to the activist campaign 967 — 2,024 2,435 Adjusted operating income $ 17,538 $ 11,719 $ 14,873 $ 17,828 $ 20,124 Adjusted operating income margin 21.4% 16.0% 20.5% 23.1% 25.7% Three Months Ended ($ in thousands) Mar. 31 Dec. 31 Sept. 30 Jun. 30 Mar. 31 Unaudited 2023 2022 2022 2022 2022 Adjusted Total Operating Expenses Total operating expenses $ 65,473 $ 61,591 $ 57,541 $ 61,449 $ 60,679 Deduct: Expenses incurred in response to the activist campaign (967) — (2,024) (2,435) Adjusted operating expenses $ 64,506 $ 61,591 $ 57,541 $ 59,425 $ 58,244 Three Months Ended ($ in thousands) Mar. 31 Dec. 31 Sept. 30 Jun. 30 Mar. 31 Unaudited 2023 2022 2022 2022 2022 Adjusted Effective Income Tax Rate Income/(loss) before income taxes $ 17,616 $ (28,310) $ 84,556 $ 10,678 $ (26,974) Add back/(deduct): Loss/(gain) on revaluation of deferred (20,592) 35,423 (77,895) (2,311) 17,018 consideration Add back: Loss on extinguishment of convertible notes 9,721 ——— -Add back: Impairments 4,900 ——— -Deduct: Remeasurement of contingent consideration—sale of former (1,477) ——— -Canadian ETF business (Deduct)/add back: (Gains)/losses on financial instruments owned (1,954) 883 6,311 4,180 5,142 Add back: Expenses incurred in response to the activist campaign 967 ——2,024 2,435 Add back/(deduct): Unrealized loss/(gain) recognized on investments 3,918 619 (327) (73) 163 Add back: Loss recognized upon reduction of tax-related 1,386 ———19,890 indemnification asset Adjusted income before income taxes $ 14,485 $ 8,615 $ 12,645 $ 14,498 $ 17,674 Income tax (benefit)/expense $ 1,383 $ (21) $ 3,327 $ 2,673 $ (16,713) Add back: Tax benefit arising from extinguishment of convertible $ 98 ——— -notes (Deduct)/add back: Tax (expense)/benefit arising from (gains)/losses (475) 214 1,533 1,015 1,249 on financial instruments owned Add back: Decrease in deferred tax asset valuation allowance on net —1,609 —— -operating losses of a European subsidiary Deduct: Increase in deferred tax asset valuation allowance on (477) (364) (1,454) (901) (2,010) financial instruments owned Add back: Tax benefit arising from expenses incurred in response to 235 ——492 591 the activist campaign Add back/(deduct): Tax (benefit)/expense on unrealized losses and 952 150 (79) (18) 39 gains on investments Add back/(deduct): Tax windfalls/(shortfalls) upon vesting and 185 —(4) (20) 565 exercise of stock-based compensation awards Add back: Tax benefit arising from reduction of a tax-related 1,386 ———19,890 indemnification asset Adjusted income tax expense $ 3,287 $ 1,588 $ 3,323 $ 3,241 $ 3,611 Adjusted effective income tax rate 22.7% 18.4% 26.3% 22.4% 20.4% 6
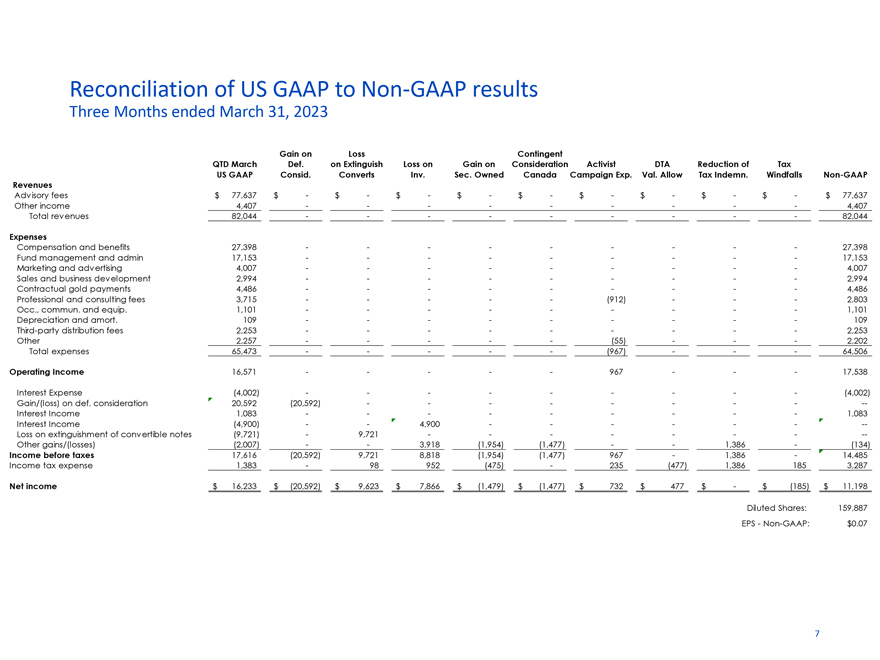
Reconciliation of US GAAP to Non-GAAP results Three Months ended March 31, 2023 Gain on Loss Contingent QTD March Def. on Extinguish Loss on Gain on Consideration Activist DTA Reduction of Tax US GAAP Consid. Converts Inv. Sec. Owned Canada Campaign Exp. Val. Allow Tax Indemn. Windfalls Non-GAAP Revenues Advisory fees $ 77,637 $—$—$—$—$—$—$—$—$—$ 77,637 Other income 4,407 — — — ——4,407 Total revenues 82,044 — — — ——82,044 Expenses Compensation and benefits 27,398 — — — ——27,398 Fund management and admin 17,153 — — — ——17,153 Marketing and advertising 4,007 — — — ——4,007 Sales and business development 2,994 — — — ——2,994 Contractual gold payments 4,486 — — — ——4,486 Professional and consulting fees 3,715 — ——(912) ——2,803 Occ., commun. and equip. 1,101 — — — ——1,101 Depreciation and amort. 109 — — — ——109 Third-party distribution fees 2,253 — — — ——2,253 Other 2,257 — ——(55) ——2,202 Total expenses 65,473 — ——(967) ——64,506 Operating Income 16,571 — ——967 ——17,538 Interest Expense (4,002) — — — ——(4,002) Gain/(loss) on def. consideration 20,592 (20,592) — — — — —Interest Income 1,083 — — — ——1,083 Interest Income (4,900) — 4,900 — — — —Loss on extinguishment of convertible notes (9,721)—9,721 — — ———Other gains/(losses) (2,007) — 3,918 (1,954) (1,477) — 1,386—(134) Income before taxes 17,616 (20,592) 9,721 8,818 (1,954) (1,477) 967—1,386—14,485 Income tax expense 1,383—98 952 (475)—235 (477) 1,386 185 3,287 Net income $ 16,233 $ (20,592) $ 9,623 $ 7,866 $ (1,479) $ (1,477) $ 732 $ 477 $—$ (185) $ 11,198 Diluted Shares: 159,887 EPS—Non-GAAP: $0.07 7

WISDOMTREE®