UNITED STATES
SECURITIES AND EXCHANGE COMMISSION
Washington, D.C. 20549
________________________
Form
________________________
(Mark One)
| QUARTERLY REPORT PURSUANT TO SECTION 13 OR 15(d) OF THE SECURITIES EXCHANGE ACT OF 1934 |
For the quarterly period ended
or
| TRANSITION REPORT PURSUANT TO SECTION 13 OR 15(d) OF THE SECURITIES EXCHANGE ACT OF 1934 |
For the transition period from____to____.
Commission File Number
________________________
(Exact name of registrant as specified in its charter)
________________________
| (State or other jurisdiction of incorporation or organization) | (IRS Employer Identification No.) |
| | |
| (Address of principal executive offices) | (Zip Code) |
(Registrant’s telephone number, including area code)
________________________
Securities registered pursuant to Section 12(b) of the Exchange Act:
| Title of each class | Trading Symbol(s) | Name of each exchange on which registered |
| | The |
Indicate by check mark whether the registrant
(1) has filed all reports required to be filed by Section 13 or 15(d) of the Securities Exchange Act of 1934, as amended (the
“Exchange Act”) during the preceding 12 months (or for such shorter period that the registrant was required to file such reports),
and (2) has been subject to such filing requirements for the past 90 days. ☒
Indicate by check mark whether the registrant
has submitted electronically every Interactive Data File required to be submitted pursuant to Rule 405 of Regulation S-T (§232.405
of this chapter) during the preceding 12 months (or for such shorter period that the registrant was required to submit such files). ☒
Indicate by check mark whether the registrant is a large accelerated filer, an accelerated filer, a non-accelerated filer, a smaller reporting company, or emerging growth company. See definitions of “large accelerated filer,” “accelerated filer,” “smaller reporting company” and “emerging growth company” in Rule 12b-2 of the Exchange Act.
| ☒ | Accelerated filer | ☐ | |
| Non-accelerated filer | ☐ | Smaller reporting company | |
| Emerging growth company | |||
If an emerging growth company, indicate by check mark if the registrant has elected not to use the extended transition period for complying with any new or revised financial accounting standards provided pursuant to Section 13(a) of the Exchange Act ☐
Indicate by check mark whether the registrant
is a shell company (as defined in Rule 12b-2 of the Exchange Act). Yes ☐ No
As of August 4, 2025, there were
WISDOMTREE, INC.
Form 10-Q
For the Quarterly Period Ended June 30, 2025
TABLE OF CONTENTS
| PART I: FINANCIAL INFORMATION | 4 | |
| ITEM 1. | FINANCIAL STATEMENTS | 4 |
| ITEM 2. | MANAGEMENT’S DISCUSSION AND ANALYSIS OF FINANCIAL CONDITION AND RESULTS OF OPERATIONS | 31 |
| ITEM 3. | QUANTITATIVE AND QUALITATIVE DISCLOSURES ABOUT MARKET RISK | 50 |
| ITEM 4. | CONTROLS AND PROCEDURES | 50 |
| PART II: OTHER INFORMATION | 51 | |
| ITEM 1. | LEGAL PROCEEDINGS | 51 |
| ITEM 1A. | RISK FACTORS | 51 |
| ITEM 2. | UNREGISTERED SALES OF EQUITY SECURITIES AND USE OF PROCEEDS | 56 |
| ITEM 3. | DEFAULTS UPON SENIOR SECURITIES | 56 |
| ITEM 4. | MINE SAFETY DISCLOSURES | 57 |
| ITEM 5. | OTHER INFORMATION | 57 |
| ITEM 6. | EXHIBITS | 58 |
Unless otherwise indicated, references to “the Company,” “we,” “us,” “our” and “WisdomTree” mean WisdomTree, Inc. and its subsidiaries.
WisdomTree®, WisdomTree Prime®, WisdomTree Connect™ and Modern Alpha® are trademarks of WisdomTree, Inc. in the United States and in other countries. All other trademarks are the property of their respective owners.
| 2 |
CAUTIONARY NOTE REGARDING FORWARD-LOOKING STATEMENTS
This Quarterly Report on Form 10-Q, or Report, contains forward-looking statements that are based on our management’s beliefs and assumptions and on information currently available to our management. These statements may include projections relating to our proposed acquisition of Ceres Partners, LLC, including expected accretion to earnings, strategic benefits and related assumptions. Although we believe that the expectations reflected in these forward-looking statements are reasonable, these statements relate to future events or our future financial performance, and involve known and unknown risks, uncertainties and other factors that may cause our actual results, levels of activity, performance or achievements to be materially different from any future results, levels of activity, performance or achievements expressed or implied by these forward-looking statements.
In some cases, you can identify forward-looking statements by terminology such as “may,” “will,” “should,” “expects,” “intends,” “plans,” “anticipates,” “believes,” “estimates,” “predicts,” “potential,” “continue” or the negative of these terms or other comparable terminology. These statements are only predictions. You should not place undue reliance on forward-looking statements because they involve known and unknown risks, uncertainties and other factors, which are, in some cases, beyond our control and which could materially affect our results. Factors that may cause actual results to differ materially from current expectations include, among other things, those listed in the section entitled “Risk Factors” included in our Annual Report on Form 10-K for the fiscal year ended December 31, 2024 and in subsequent reports filed with or furnished to the Securities and Exchange Commission, or the SEC. If one or more of these or other risks or uncertainties occur, or if our underlying assumptions prove to be incorrect, actual events or results may vary significantly from those implied or projected by the forward-looking statements. No forward-looking statement is a guarantee of future performance. You should read this Report and the documents that we reference in this Report and have filed with the SEC as exhibits to this Report, completely and with the understanding that our actual future results may be materially different from any future results expressed or implied by these forward-looking statements.
In particular, forward-looking statements in this Report may include statements about:
| ● | anticipated trends, conditions and investor sentiment in the global markets and exchange-traded products, or ETPs; |
| ● | anticipated levels of inflows into and outflows out of our ETPs; |
| ● | our ability to deliver favorable rates of return to investors; |
| ● | competition in our business; |
| ● | whether we will experience future growth; |
| ● | our ability to develop new products and services and their potential for success; |
| ● | our ability to maintain current vendors or find new vendors to provide services to us at favorable costs; |
| ● | our ability to successfully implement our strategy relating to digital assets and blockchain-enabled financial services, including WisdomTree Prime and WisdomTree Connect, and achieve its objectives; |
| ● | our ability to successfully operate and expand our business in non-U.S. markets; |
| ● | the effect of laws and regulations that apply to our business; |
| ● | the potential benefits of the proposed acquisition of Ceres Partners, LLC, including financial or strategic outcomes; and |
| ● | our ability to consummate, and to successfully implement our strategic goals relating to, the proposed acquisition, and integrate the acquired business. |
The forward-looking statements in this Report represent our views as of the date of this Report. We anticipate that subsequent events and developments may cause our views to change. However, while we may elect to update these forward-looking statements at some point in the future, we have no current intention of doing so except to the extent required by applicable law. Therefore, these forward-looking statements do not represent our views as of any date other than the date of this Report.
| 3 |
PART I: FINANCIAL INFORMATION
| ITEM 1. | FINANCIAL STATEMENTS |
WisdomTree, Inc. and Subsidiaries
Consolidated Balance Sheets
(In Thousands, Except Per Share Amounts)
June 30, 2025 | December 31, 2024 | |||||||
| Assets | (unaudited) | |||||||
| Current assets: | ||||||||
| Cash, cash equivalents and restricted cash (including $ | $ | $ | ||||||
| Financial instruments owned, at fair value (including $ | ||||||||
| Accounts receivable (including $ | ||||||||
| Income taxes receivable | ||||||||
| Prepaid expenses | ||||||||
| Other current assets | ||||||||
| Total current assets | ||||||||
| Fixed assets, net | ||||||||
| Deferred tax assets, net (Note 17) | ||||||||
| Investments (Note 6) | ||||||||
| Right of use assets—operating leases (Note 10) | ||||||||
| Goodwill (Note 19) | ||||||||
| Intangible assets, net (Note 19) | ||||||||
| Other noncurrent assets | ||||||||
| Total assets | $ | $ | ||||||
| Liabilities and stockholders’ equity | ||||||||
| Liabilities | ||||||||
| Current liabilities: | ||||||||
| Fund management and administration payable | $ | $ | ||||||
| Compensation and benefits payable | ||||||||
| Payable to Gold Bullion Holdings (Jersey) Limited (“GBH”) (Note 9) | ||||||||
| Income taxes payable | ||||||||
| Operating lease liabilities (Note 10) | ||||||||
| Convertible notes—current (Note 8) | ||||||||
| Accounts payable and other liabilities | ||||||||
| Total current liabilities | ||||||||
| Convertible notes (Note 8) | ||||||||
| Payable to GBH (Note 9) | ||||||||
| Operating lease liabilities (Note 10) | ||||||||
| Total liabilities | ||||||||
| Contingencies (Note 11) | ||||||||
| Stockholders’ equity | ||||||||
| Preferred stock, par value $ | ||||||||
| Common stock, par value $ | ||||||||
| Additional paid-in capital | ||||||||
| Accumulated other comprehensive income/(loss) | ( | ) | ||||||
| Retained earnings | ||||||||
| Total stockholders’ equity | ||||||||
| Total liabilities and stockholders’ equity | $ | $ | ||||||
The accompanying notes are an integral part of these consolidated financial statements.
| 4 |
WisdomTree, Inc. and Subsidiaries
Consolidated Statements of Operations
(In Thousands, Except Per Share Amounts)
(Unaudited)
Three Months Ended June 30, | Six Months Ended June 30, | |||||||||||||||
| 2025 | 2024 | 2025 | 2024 | |||||||||||||
| Operating Revenues: | ||||||||||||||||
| Advisory fees | $ | $ | $ | $ | ||||||||||||
| Other revenues | ||||||||||||||||
| Total revenues | ||||||||||||||||
| Operating Expenses: | ||||||||||||||||
| Compensation and benefits | ||||||||||||||||
| Fund management and administration | ||||||||||||||||
| Marketing and advertising | ||||||||||||||||
| Sales and business development | ||||||||||||||||
| Professional fees | ||||||||||||||||
| Occupancy, communications and equipment | ||||||||||||||||
| Depreciation and amortization | ||||||||||||||||
| Third-party distribution fees | ||||||||||||||||
| Acquisition-related costs | ||||||||||||||||
| Other | ||||||||||||||||
| Total operating expenses | ||||||||||||||||
| Operating income | ||||||||||||||||
| Other Income/(Expenses): | ||||||||||||||||
| Interest expense | ( | ) | ( | ) | ( | ) | ( | ) | ||||||||
| Interest income | ||||||||||||||||
| Other gains and losses, net | ( | ) | ||||||||||||||
| Income before income taxes | ||||||||||||||||
| Income tax expense | ||||||||||||||||
| Net income | $ | $ | $ | $ | ||||||||||||
| Earnings per share—basic | $ | $ | $ | $ | ||||||||||||
| Earnings per share—diluted | $ | $ | $ | $ | ||||||||||||
| Weighted-average common shares—basic | ||||||||||||||||
| Weighted-average common shares—diluted | ||||||||||||||||
| Cash dividends declared per common share | $ | $ | $ | $ | ||||||||||||
The accompanying notes are an integral part of these consolidated financial statements.
| 5 |
WisdomTree, Inc. and Subsidiaries
Consolidated Statements of Comprehensive Income
(In Thousands)
(Unaudited)
Three Months Ended June 30, | Six Months Ended June 30, | |||||||||||||||
| 2025 | 2024 | 2025 | 2024 | |||||||||||||
| Net income | $ | $ | $ | $ | ||||||||||||
| Other comprehensive income/(loss) | ||||||||||||||||
| Foreign currency translation adjustment, net of income taxes | ( | ) | ( | ) | ||||||||||||
| Other comprehensive income/(loss) | ( | ) | ( | ) | ||||||||||||
| Comprehensive income | $ | $ | $ | $ | ||||||||||||
The accompanying notes are an integral part of these consolidated financial statements.
| 6 |
WisdomTree, Inc. and Subsidiaries
Consolidated Statements of Changes in Stockholders’ Equity
(In Thousands)
(Unaudited)
| Three Months Ended June 30, 2025 | ||||||||||||||||||||||||
Common Stock | Additional | Accumulated Other | ||||||||||||||||||||||
| Shares Issued | Par Value | Paid-In Capital | Comprehensive Income | Retained Earnings | Total | |||||||||||||||||||
| Balance—April 1, 2025 | $ | $ | $ | $ | $ | |||||||||||||||||||
| Restricted stock issued and vesting of restricted stock units, net | ( | ) | ||||||||||||||||||||||
| Stock-based compensation | — | |||||||||||||||||||||||
| Other comprehensive income | — | |||||||||||||||||||||||
| Dividends | — | ( | ) | ( | ) | |||||||||||||||||||
| Net income | — | |||||||||||||||||||||||
| Balance—June 30, 2025 | $ | $ | $ | $ | $ | |||||||||||||||||||
| Three Months Ended June 30, 2024 | ||||||||||||||||||||||||
Common Stock | Additional | Accumulated Other | ||||||||||||||||||||||
| Shares Issued | Par Value | Paid-In Capital | Comprehensive Loss | Retained Earnings | Total | |||||||||||||||||||
| Balance—April 1, 2024 | $ | $ | $ | ( | ) | $ | $ | |||||||||||||||||
| Restricted stock issued and vesting of restricted stock units, net | ( | ) | ||||||||||||||||||||||
| Stock-based compensation | — | |||||||||||||||||||||||
| Other comprehensive loss | — | ( | ) | ( | ) | |||||||||||||||||||
| Dividends | — | ( | ) | ( | ) | |||||||||||||||||||
| Net income | — | |||||||||||||||||||||||
| Balance—June 30, 2024 | $ | $ | $ | ( | ) | $ | $ | |||||||||||||||||
The accompanying notes are an integral part of these consolidated financial statements.
| 7 |
WisdomTree, Inc. and Subsidiaries
Consolidated Statements of Changes in Stockholders’ Equity
(In Thousands)
(Unaudited)
| Six Months Ended June 30, 2025 | ||||||||||||||||||||||||
Common Stock | Additional | Accumulated Other | ||||||||||||||||||||||
| Shares Issued | Par Value | Paid-In Capital | Comprehensive (Loss)/Income | Retained Earnings | Total | |||||||||||||||||||
| Balance—January 1, 2025 | $ | $ | $ | ( | ) | $ | $ | |||||||||||||||||
| Restricted stock issued and vesting of restricted stock units, net | ( | ) | ||||||||||||||||||||||
| Shares repurchased | ( | ) | ( | ) | ( | ) | ( | ) | ||||||||||||||||
| Stock-based compensation | — | |||||||||||||||||||||||
| Other comprehensive income | — | |||||||||||||||||||||||
| Dividends | — | ( | ) | ( | ) | |||||||||||||||||||
| Net income | — | |||||||||||||||||||||||
| Balance—June 30, 2025 | $ | $ | $ | $ | $ | |||||||||||||||||||
| Six Months Ended June 30, 2024 | ||||||||||||||||||||||||
Common Stock | Additional | Accumulated Other | ||||||||||||||||||||||
| Shares Issued | Par Value | Paid-In Capital | Comprehensive Loss | Retained Earnings | Total | |||||||||||||||||||
| Balance—January 1, 2024 | $ | $ | $ | ( | ) | $ | $ | |||||||||||||||||
| Restricted stock issued and vesting of restricted stock units, net | ( | ) | ||||||||||||||||||||||
| Shares repurchased | ( | ) | ( | ) | ( | ) | ( | ) | ||||||||||||||||
| Stock-based compensation | — | |||||||||||||||||||||||
| Other comprehensive loss | — | ( | ) | ( | ) | |||||||||||||||||||
| Dividends | — | ( | ) | ( | ) | |||||||||||||||||||
| Net income | — | |||||||||||||||||||||||
| Balance—June 30, 2024 | $ | $ | $ | ( | ) | $ | $ | |||||||||||||||||
The accompanying notes are an integral part of these consolidated financial statements.
| 8 |
WisdomTree, Inc. and Subsidiaries
Consolidated Statements of Cash Flows
(In Thousands)
(Unaudited)
Six Months Ended June 30, | ||||||||
| 2025 | 2024 | |||||||
| Cash flows from operating activities: | ||||||||
| Net income | $ | $ | ||||||
| Adjustments to reconcile net income to net cash provided by operating activities: | ||||||||
| Advisory and license fees paid in gold, other precious metals and cryptocurrency | ( | ) | ( | ) | ||||
| Stock-based compensation | ||||||||
| Deferred income taxes | ||||||||
| Amortization of issuance costs—convertible notes | ||||||||
| Depreciation and amortization | ||||||||
| Imputed interest on payable to GBH | ||||||||
| (Gains)/losses on investments | ( | ) | ||||||
| Gains on financial instruments owned, at fair value | ( | ) | ( | ) | ||||
| Amortization of right of use asset | ||||||||
| Changes in operating assets and liabilities: | ||||||||
| Accounts receivable | ( | ) | ||||||
| Income taxes payable | ( | ) | ( | ) | ||||
| Prepaid expenses | ( | ) | ( | ) | ||||
| Gold and other precious metals | ||||||||
| Other assets | ( | ) | ( | ) | ||||
| Fund management and administration payable | ( | ) | ||||||
| Compensation and benefits payable | ( | ) | ( | ) | ||||
| Operating lease liabilities | ( | ) | ( | ) | ||||
| Accounts payable and other liabilities | ||||||||
| Net cash provided by operating activities | ||||||||
| Cash flows from investing activities: | ||||||||
| Purchase of financial instruments owned, at fair value | ( | ) | ( | ) | ||||
| Purchase of investments | ( | ) | ||||||
| Cash paid—software development | ( | ) | ( | ) | ||||
| Purchase of fixed assets | ( | ) | ( | ) | ||||
| Proceeds from the sale of financial instruments owned, at fair value | ||||||||
| Proceeds from held-to-maturity securities maturing or called prior to maturity | ||||||||
| Proceeds from the exit from investment in Securrency, Inc. | ||||||||
| Net cash used in investing activities | ( | ) | ( | ) | ||||
| Cash flows from financing activities: | ||||||||
| Common stock repurchased | ( | ) | ( | ) | ||||
| Dividends paid | ( | ) | ( | ) | ||||
| Excise taxes paid on common stock repurchased | ( | ) | ||||||
| Net cash used in financing activities | ( | ) | ( | ) | ||||
| Increase/(decrease) in cash flow due to changes in foreign exchange rate | ( | ) | ||||||
| Net increase in cash, cash equivalents and restricted cash | ||||||||
| Cash, cash equivalents and restricted cash—beginning of year | ||||||||
| Cash, cash equivalents and restricted cash—end of period | $ | $ | ||||||
| Supplemental disclosure of cash flow information: | ||||||||
| Cash paid for income taxes | $ | $ | ||||||
| Cash paid for interest | $ | $ | ||||||
The accompanying notes
are an integral part of these consolidated financial statements.
| 9 |
WisdomTree, Inc. and Subsidiaries
Notes to Consolidated Financial Statements
(In Thousands, Except Share and Per Share Amounts)
1. Organization and Description of Business
WisdomTree, Inc., through its subsidiaries in the U.S. and Europe (collectively, “WisdomTree” or the “Company”), is a global financial innovator, offering a diverse suite of exchange-traded products (“ETPs”), models, solutions, as well as digital asset-related products. Building on its heritage of innovation, the Company offers next-generation digital products and services related to tokenized real world assets and stablecoins, including blockchain-enabled mutual funds (“Digital Funds”), as well as its blockchain-native digital wallet, WisdomTree Prime, and institutional platform, WisdomTree Connect. The Company has the following wholly-owned operating subsidiaries:
| ● | WisdomTree Asset Management, Inc. is a New York based investment adviser registered with the SEC, providing investment advisory and other management services to the WisdomTree Trust (“WTT”) and WisdomTree exchange-traded funds (“ETFs”). The WisdomTree ETFs are issued in the U.S. by WTT. WTT is a non-consolidated Delaware statutory trust registered with the SEC as an open-end management investment company. The Company has licensed to WTT the use of certain of its own indexes on an exclusive basis for the WisdomTree ETFs in the U.S. |
| ● | WisdomTree Management Jersey Limited (“ManJer”) is a Jersey based management company providing management services to seven issuers (the “ManJer Issuers”) in respect of the ETPs issued and listed by the ManJer Issuers covering commodity, currency, cryptocurrency and leveraged-and-inverse strategies. |
| ● | WisdomTree Multi Asset Management Limited (“WTMAML”) is a Jersey based management company providing management services to WisdomTree Multi Asset Issuer PLC (“WMAI”) in respect of the ETPs issued by WMAI. WMAI is a non-consolidated public limited company domiciled in Ireland. |
| ● | WisdomTree Management Limited (“WML”) is an Ireland based management company providing management services to WisdomTree Issuer ICAV (“WTICAV”) in respect of the WisdomTree UCITS ETFs issued by WTICAV. WTICAV is a non-consolidated public limited company domiciled in Ireland. |
| ● | WisdomTree UK Limited (“WTUK”) is a U.K. based company registered with the Financial Conduct Authority currently providing distribution and support services to ManJer, WTMAML and WML. |
| ● | WisdomTree Europe Limited is a U.K. based company which is the legacy distributor of the WMAI ETPs and WisdomTree UCITS ETFs. These services are now provided directly by WTUK. WisdomTree Europe Limited is no longer regulated and does not provide any regulated services. |
| ● | WisdomTree Ireland Limited (“WT Ireland”) is an Ireland based company authorized by the Central Bank of Ireland providing distribution services to ManJer, WTMAML and WML. |
| ● | WisdomTree Digital Commodity Services, LLC is a New York based company that serves as the sponsor of the WisdomTree Bitcoin Fund, which is currently effective with the SEC. The WisdomTree Bitcoin Fund is an exchange-traded fund that issues common shares of beneficial interest and is listed on the Cboe BZX Exchange, Inc. The WisdomTree Bitcoin Fund provides exposure to the spot price of bitcoin. |
| ● | WisdomTree Digital Management, Inc. (“WT Digital Management”) is a New York based investment adviser registered with the SEC, providing investment advisory and other management services to the WisdomTree Digital Trust (“WTDT”) and WisdomTree Digital Funds. The WisdomTree Digital Funds are issued in the U.S. by WTDT. WTDT is a non-consolidated Delaware statutory trust registered with the SEC as an open-end management investment company. Each Digital Fund uses a blockchain-integrated recordkeeping system to maintain a record of its shares on one or more blockchains (e.g., Stellar or Ethereum), but does not directly or indirectly invest in any assets that rely on blockchain technology, such as cryptocurrencies. |
| ● | WisdomTree Digital Movement, Inc. (“WT Digital Movement”) is a New York based company operating as a money services business registered with the Financial Crimes Enforcement Network. WT Digital Movement has obtained and is seeking additional state money transmitter licenses to operate a platform for the purchase, sale and exchange of tokenized assets, while also providing blockchain-native digital wallet services through WisdomTree Prime to facilitate such activity. |
| ● | WisdomTree Securities, Inc. is a New York based limited purpose broker-dealer (i.e., mutual fund retailer) registered with the SEC and FINRA, facilitating transactions in WisdomTree Digital Funds. |
| ● | WisdomTree Transfers, Inc. is a New York based transfer agent registered with the SEC, providing transfer agency and registrar services for the Digital Funds. The transfer agent uses a blockchain-integrated recordkeeping system for the ownership of WisdomTree Digital Fund shares. |
| ● | WisdomTree Digital Trust Company, LLC is a New York based limited liability trust company that has been formed to operate as a limited purpose trust company under New York Banking Law and is licensed to engage in virtual currency business activity by the New York State Department of Financial Services. |
| 10 |
2. Significant Accounting Policies
Basis of Presentation
These consolidated financial statements have been prepared in conformity with U.S. generally accepted accounting principles (“GAAP”) and in the opinion of management reflect all adjustments, consisting of only normal recurring adjustments, necessary for a fair presentation of the financial statements. The consolidated financial statements include the accounts of the Company’s wholly-owned subsidiaries. All intercompany accounts and transactions have been eliminated in consolidation.
Consolidation
The Company consolidates entities in which it has a controlling financial interest. The Company determines whether it has a controlling financial interest in an entity by first evaluating whether the entity is a voting interest entity (“VOE”) or a variable interest entity (“VIE”). The usual condition for a controlling financial interest in a VOE is ownership of a majority voting interest. If the Company has a majority voting interest in a VOE, the entity is consolidated. The Company has a controlling financial interest in a VIE when the Company has a variable interest that provides it with (i) the power to direct the activities of the VIE that most significantly impact the VIE’s economic performance and (ii) the obligation to absorb losses of the VIE or the right to receive benefits from the VIE that could potentially be significant to the VIE.
The Company reassesses its evaluation of whether an entity is a VOE or VIE when certain reconsideration events occur.
Segment and Geographic Information
The Company, through its subsidiaries in the
U.S. and Europe, is a global financial innovator, offering a diverse suite of ETPs, models, solutions and products leveraging blockchain
technology.
Foreign Currency Translation
Assets and liabilities of subsidiaries whose functional currency is not the U.S. dollar are translated based on the end of period exchange rates from local currency to U.S. dollars. Results of operations are translated at the average exchange rates in effect during the period. The impact of the foreign currency translation adjustment is included in the Consolidated Statements of Comprehensive Income as a component of other comprehensive (loss)/income.
Use of Estimates
The preparation of the Company’s consolidated financial statements in conformity with U.S. GAAP requires management to make estimates and assumptions that affect the reported amounts of assets and liabilities as of the balance sheet dates and the reported amounts of revenues and expenses for the periods presented. Actual results could differ materially from those estimates.
Revenue Recognition
The Company earns a significant portion of its revenues in the form of advisory fees from its ETPs and recognizes this revenue over time, as the performance obligation is satisfied. Advisory fees are based on a percentage of the ETPs’ average daily net assets. Progress is measured using the practical expedient under the output method resulting in the recognition of revenue in the amount for which the Company has a right to invoice.
Other revenues are earned from swap providers associated with certain of the Company’s European listed ETPs, the nature of which are based on a percentage of the ETPs’ average daily net assets. The Company also earns transaction-based income on flows associated with certain European listed ETPs. There is no significant judgment in calculating amounts due, which are invoiced monthly or quarterly in arrears and are not subject to any potential reversal. Progress is measured using the practical expedient under the output method resulting in the recognition of revenue in the amount for which the Company has a right to invoice.
Marketing and Advertising
Marketing and advertising costs, including media advertising and production costs, are expensed when incurred.
| 11 |
Depreciation and Amortization
Depreciation and amortization is provided for using the straight-line method over the estimated useful lives of the related assets as follows:
| Equipment | ||
| Internally-developed software |
The assets listed above are recorded at cost, less accumulated depreciation and amortization.
Stock-Based Awards
Accounting for stock-based compensation requires the measurement and recognition of compensation expense for all equity awards based on estimated fair values. Stock-based compensation is measured based on the grant-date fair value of the award and is amortized over the relevant service period. Forfeitures are recognized when they occur.
Third-Party Distribution Fees
The Company pays a percentage of its advisory fee revenues based on incremental growth in assets under management (“AUM”), subject to caps or minimums, to marketing agents to sell WisdomTree ETPs and for including WisdomTree ETPs on third-party customer platforms and recognizes these expenses as incurred.
Cash, Cash Equivalents and Restricted Cash
The Company considers all highly liquid investments with an original maturity of 90 days or less at the time of purchase to be classified as cash equivalents. The Company maintains deposits with financial institutions in an amount that is in excess of federally insured limits. Restricted cash is required to be maintained in a separate account with withdrawal and usage restrictions.
Accounts Receivable
Accounts receivable are customer and other obligations due under normal trade terms. The Company measures credit losses, if any, by applying historical loss rates, adjusted for current conditions and reasonable and supportable forecasts to amounts outstanding using the aging method.
Financial Instruments Owned
Financial instruments owned are financial instruments classified as either trading or available-for-sale (“AFS”). These financial instruments are recorded on their trade date and are measured at fair value. All equity instruments that have readily determinable fair values are classified by the Company as trading. Debt instruments are classified based primarily on the Company’s intent to hold or sell the instrument. Changes in the fair value of debt instruments classified as trading and AFS are reported in other income/(expenses) and other comprehensive income, respectively, in the period the change occurs. Debt instruments classified as AFS are assessed for impairment on a quarterly basis and an estimate for credit loss is provided when the fair value of the AFS debt instrument is below its amortized cost basis. Credit-related impairments are recognized in earnings with a corresponding adjustment to the instrument’s amortized cost basis if the Company intends to sell the impaired AFS debt instrument or it is more likely than not the Company will be required to sell the instrument before recovering its amortized cost basis. Other credit-related impairments are recognized as an allowance with a corresponding adjustment to earnings. Impairments resulting from noncredit-related factors are recognized in other comprehensive income. Amounts recorded in other comprehensive income are reclassified into earnings upon sale of the AFS debt instrument using the specific identification method.
Investments
The Company accounts for equity investments that do not have a readily determinable fair value under the measurement alternative prescribed in Accounting Standards Codification (“ASC”) Topic 321, Investments – Equity Securities (“ASC 321”), to the extent such investments are not subject to consolidation or the equity method. Under the measurement alternative, these financial instruments are carried at cost, less any impairment (assessed quarterly), plus or minus changes resulting from observable price changes in orderly transactions for an identical or similar investment of the same issuer. In addition, income is recognized when dividends are received only to the extent they are distributed from net accumulated earnings of the investee. Otherwise, such distributions are considered returns of investment and are recorded as a reduction of the cost of the investment.
Investments in debt instruments are accounted for at fair value, with changes in fair value reported in other income/(expenses).
Goodwill
Goodwill is the excess of the purchase price over the fair values of the identifiable net assets at the acquisition date. The Company tests goodwill for impairment at least annually and at the time of a triggering event requiring re-evaluation, if one were to occur. Goodwill is considered impaired when the estimated fair value of the reporting unit that was allocated the goodwill is less than its carrying value. If the estimated fair value of such reporting unit is less than its carrying value, goodwill impairment is recognized based on that difference, not to exceed the carrying amount of goodwill. A reporting unit is an operating segment or a component of an operating segment provided that the component constitutes a business for which discrete financial information is available and management regularly reviews the operating results of that component.
| 12 |
Goodwill is allocated to the Company’s U.S. and European components. For impairment testing purposes, these components are aggregated as a single reporting unit as they fall under the same operating segment and have similar economic characteristics.
Goodwill is assessed for impairment annually on November 30th. When performing its goodwill impairment test, the Company considers a qualitative assessment, when appropriate, and a quantitative assessment using the market approach and its market capitalization when determining the fair value of the reporting unit.
Intangible Assets
Indefinite-lived intangible assets are tested for impairment at least annually and are also reviewed for impairment whenever events or changes in circumstances indicate that the carrying amount of an asset may not be recoverable. Indefinite-lived intangible assets are impaired if their estimated fair values are less than their carrying values.
Finite-lived intangible assets, if any, are amortized over their estimated useful life, which is the period over which the assets are expected to contribute directly or indirectly to the future cash flows of the Company. These intangible assets are tested for impairment at the time of a triggering event, if one were to occur. Finite-lived intangible assets may be impaired when the estimated undiscounted future cash flows generated from the assets are less than their carrying amounts.
The Company may rely on a qualitative assessment when performing its intangible asset impairment test. Otherwise, the impairment evaluation is performed at the lowest level of reasonably identifiable cash flows independent of other assets. The annual impairment testing date for all of the Company’s intangible assets is November 30th.
Software Development Costs
Software development costs incurred after the preliminary project stage is complete are capitalized if it is probable that the project will be completed and the software will be used as intended. Capitalized costs consist of employee compensation costs and fees paid to third parties who are directly involved in the application development efforts and are included in intangible assets, net in the Consolidated Balance Sheets. Such costs are amortized over the estimated useful life of the software on a straight-line basis and are included in depreciation and amortization in the Consolidated Statements of Operations. Once the application development stage is complete, additional costs are expensed as incurred.
Leases
The Company accounts for its lease obligations in accordance with ASC Topic 842, Leases (“ASC 842”), which requires the recognition of both (i) a lease liability equal to the present value of the remaining lease payments and (ii) an offsetting right-of-use asset. The remaining lease payments are discounted using the rate implicit in the lease, if known, or otherwise the Company’s incremental borrowing rate. After lease commencement, right-of-use assets are assessed for impairment and otherwise are amortized over the remaining lease term on a straight-line basis. These recognition requirements are not applied to short-term leases, which are those with a lease term of 12 months or less. Instead, lease payments associated with short-term leases are recognized as an expense on a straight-line basis over the lease term.
ASC 842 also provides a practical expedient which allows for consideration in a contract to be accounted for as a single lease component rather than allocated between lease and non-lease components. The Company has elected to apply this practical expedient to all lease contracts, where applicable.
Convertible Notes
Convertible notes are carried at amortized cost, net of issuance costs. The Company accounts for convertible instruments as a single liability (applicable to the convertible notes) or equity with no separate accounting for embedded conversion features unless the conversion feature meets the criteria for accounting under the substantial premium model or does not qualify for a derivative scope exception. Interest expense is recognized using the effective interest method and includes amortization of issuance costs over the life of the debt.
Acquisition-related Costs
The Company accounts for business combinations in accordance with ASC 805, Business Combinations, with acquisitions recorded using the acquisition method. Transaction costs associated with acquisitions are expensed as incurred.
Contingencies
The Company may be subject to reviews, inspections and investigations by regulatory authorities as well as legal proceedings arising in the ordinary course of business. The Company evaluates the likelihood of an unfavorable outcome of all legal or regulatory proceedings to which it is a party and accrues a loss contingency when the loss is probable and reasonably estimable.
Contingent Payments
The Company recognizes a gain on contingent payments when the contingency is resolved and the gain is realized.
| 13 |
Earnings per Share
Basic earnings per share (“EPS”) is computed by dividing net income available to common stockholders by the weighted-average number of common shares outstanding for the period. Net income available to common stockholders represents net income of the Company reduced by an allocation of earnings to participating securities. Unvested share-based payment awards that contain non-forfeitable rights to dividends or dividend equivalents (whether paid or unpaid) are participating securities and are included in the computation of EPS pursuant to the two-class method. Share-based payment awards that do not contain such rights are not deemed participating securities and are included in diluted shares outstanding (if dilutive).
Diluted EPS is calculated under the treasury stock method and the two-class method. The calculation that results in the lowest diluted EPS amount for the common stock is reported in the Company’s consolidated financial statements. The treasury stock method includes the dilutive effect of potential common shares including unvested stock-based awards and the convertible notes, if any. Potential common shares associated with the convertible notes are computed under the if-converted method. Potential common shares associated with the conversion option embedded in the convertible notes are dilutive when the Company’s average stock price exceeds the conversion price.
Income Taxes
The Company accounts for income taxes using the liability method, which requires the determination of deferred tax assets and liabilities based on the differences between the financial and tax bases of assets and liabilities using the enacted tax rates in effect for the year in which differences are expected to reverse. Deferred tax assets are reduced by a valuation allowance if, based on the weight of available evidence, it is more-likely-than-not that some portion or all the deferred tax assets will not be realized.
Tax positions are evaluated utilizing a two-step
process. The Company first determines whether any of its tax positions are more-likely-than-not to be sustained upon examination, based
solely on the technical merits of the position. Once it is determined that a position meets this recognition threshold, the position is
measured as the largest amount of benefit that is greater than
The Global Intangible Low-Taxed Income (“GILTI”) provisions of current tax law requires the Company to include in its U.S. income tax return foreign subsidiary earnings in excess of an allowable return on the foreign subsidiary’s tangible assets. An accounting policy election is available to either account for the tax effects of GILTI in the period that is subject to such taxes or to provide deferred taxes for book and tax basis differences that upon reversal may be subject to such taxes. The Company accounts for the tax effects of these provisions in the period that is subject to such tax.
Non-income based taxes are recorded as part of other liabilities and other expenses. Excise taxes on stock repurchases are accounted for as a direct component of the share repurchase transaction and reported as a reduction of stockholder’s equity.
Recently Issued Accounting Pronouncements
On November 4, 2024, the Financial Accounting Standards Board (“FASB”) issued ASU 2024-03, Reporting Comprehensive Income—Expense Disaggregation Disclosures, which requires additional information about specific expense categories in the notes to financial statements at interim and annual reporting periods. The guidance is effective for annual reporting periods beginning after December 15, 2026, and interim reporting periods beginning after December 15, 2027. The Company does not anticipate this standard to have a material impact on its financial statements.
Recently Adopted Accounting Pronouncements
On December 14, 2023, the Financial Accounting Standards Board (“FASB”) issued Accounting Standards Update (“ASU”) 2023-09, Improvements to Income Tax Disclosures, which establishes new income tax disclosure requirements in addition to modifying and eliminating certain existing requirements. Under the new guidance, entities must consistently categorize and provide greater disaggregation of information in the rate reconciliation. They must also further disaggregate income taxes paid. The standard is intended to benefit stockholders by providing more detailed income tax disclosures that would be useful in making capital allocation decisions. The guidance applies to all entities subject to income taxes and is effective for annual periods beginning after December 15, 2024. The guidance will be applied on a prospective basis with the option to apply the standard retrospectively. Early adoption is permitted. The Company adopted this standard on a prospective basis for the year ended December 31, 2024. See Note 17 for additional information.
3. Cash, Cash Equivalents and Restricted Cash
Of the total cash, cash equivalents and restricted
cash of $
Certain of the Company’s subsidiaries
are required to maintain a minimum level of regulatory capital, generally satisfied by cash on hand, which was $
| 14 |
4. Fair Value Measurements
The fair value of financial instruments is defined as the price that would be received to sell an asset or paid to transfer a liability (i.e., “the exit price”) in an orderly transaction between market participants at the measurement date. ASC 820, Fair Value Measurement, establishes a hierarchy for inputs used in measuring fair value that maximizes the use of observable inputs and minimizes the use of unobservable inputs by requiring that the most observable inputs be used when available. Observable inputs are inputs that market participants would use in pricing the asset or liability developed based on market data obtained from independent sources. Unobservable inputs reflect assumptions that market participants would use in pricing the asset or liability developed based on the best information available in the circumstances. The hierarchy is broken down into three levels based on the transparency of inputs as follows:
Level 1 – Quoted prices for identical instruments in active markets.
Level 2 – Quoted prices for similar instruments in active markets; quoted prices for identical or similar instruments in markets that are not active; and model-derived valuations whose inputs are observable or whose significant value drivers are observable.
Level 3 – Instruments whose significant drivers are unobservable.
The availability of observable inputs can vary from product to product and is affected by a wide variety of factors, including, for example, the type of product, whether the product is new and not yet established in the marketplace, and other characteristics particular to the transaction. To the extent that valuation is based on models or inputs that are less observable or unobservable in the market, the determination of fair value requires more judgment. Accordingly, the degree of judgment exercised by management in determining fair value is greatest for instruments categorized in Level 3. In certain cases, the inputs used to measure fair value may fall into different levels of the fair value hierarchy. In such cases, for disclosure purposes, the level in the fair value hierarchy within which the fair value measurement in its entirety falls is determined based on the lowest level input that is significant to the fair value measurement in its entirety.
The tables below summarize the categorization of the Company’s assets and liabilities measured at fair value. During the three and six months ended June 30, 2025 and 2024, there were no transfers between Levels 2 and 3.
| June 30, 2025 | ||||||||||||||||
| Total | Level 1 | Level 2 | Level 3 | |||||||||||||
| Assets: | ||||||||||||||||
| Recurring fair value measurements: | ||||||||||||||||
| Cash equivalents | $ | $ | $ | $ | ||||||||||||
| Financial instruments owned, at fair value: | ||||||||||||||||
| ETFs | ||||||||||||||||
| Pass-through GSEs | ||||||||||||||||
| Other assets—seed capital (WisdomTree Digital Funds): | ||||||||||||||||
| U.S. treasuries | ||||||||||||||||
| Equities | ||||||||||||||||
| Fixed income | ||||||||||||||||
| Other investments | ||||||||||||||||
| Total | $ | $ | $ | $ | ||||||||||||
| 15 |
| December 31, 2024 | ||||||||||||||||
| Total | Level 1 | Level 2 | Level 3 | |||||||||||||
| Assets: | ||||||||||||||||
| Recurring fair value measurements: | ||||||||||||||||
| Cash equivalents | $ | $ | $ | $ | ||||||||||||
| Financial instruments owned, at fair value: | ||||||||||||||||
| ETFs | ||||||||||||||||
| Pass-through GSEs | ||||||||||||||||
| Other assets—seed capital (WisdomTree Digital Funds): | ||||||||||||||||
| U.S. treasuries | ||||||||||||||||
| Equities | ||||||||||||||||
| Fixed income | ||||||||||||||||
| Other investments | ||||||||||||||||
| Total | $ | $ | $ | $ | ||||||||||||
| Non-recurring fair value measurements: | ||||||||||||||||
| Fnality International Limited—Series B-1 Preference Shares0F0F(1) | $ | $ | $ | $ | ||||||||||||
_____________________________
| (1) |
Recurring Fair Value Measurements – Methodology
Cash Equivalents (Note 3) – These
financial assets represent cash invested in highly liquid investments with original maturities of less than
Financial instruments owned (Note 5) – Financial instruments owned are investments in ETFs, pass-through GSEs, equities and fixed income. ETFs and equities are generally traded in active, quoted and highly liquid markets and are therefore classified as Level 1 in the fair value hierarchy. Pricing of pass-through GSEs and fixed income includes consideration given to date of issuance, collateral characteristics and market assumptions related to yields, credit risk and timing of prepayments and may be classified as either Level 1 or Level 2.
Fair Value Measurements classified as Level 3 – The following table presents a reconciliation of beginning and ending balances of recurring fair value measurements classified as Level 3:
These instruments consist of the following:
| Three Months Ended June 30, | Six Months Ended June 30, | |||||||||||||||
| 2025 | 2024 | 2025 | 2024 | |||||||||||||
| Investments in Convertible Notes (Note 6) | ||||||||||||||||
| Beginning balance | $ | $ | $ | $ | ||||||||||||
| Purchases | ||||||||||||||||
| Net unrealized gains(1) | ||||||||||||||||
| Ending balance | $ | $ | $ | $ | ||||||||||||
| 16 |
5. Financial instruments owned
These instruments consist of the following:
June 30, | December 31, | |||||||
| Financial instruments owned | ||||||||
| Trading securities | $ | $ | ||||||
| Other assets—seed capital (WisdomTree Digital Funds) | ||||||||
| Total | $ | $ | ||||||
The Company recognized net trading gains/(losses)
on financial instruments owned that were still held at the reporting dates of $
6. Investments
The following is a summary of the Company’s investments:
| June 30, 2025 | December 31, 2024 | |||||||||||||||
| Carrying Value | Cost | Carrying Value | Cost | |||||||||||||
| Fnality International Limited—Series B-1 Preference Shares | $ | $ | $ | $ | ||||||||||||
| Quorus Inc.—Series Seed-1 Preferred Stock | ||||||||||||||||
| Other investments | ||||||||||||||||
| Total | $ | $ | $ | $ | ||||||||||||
Fnality International Limited
The Company owns approximately
This investment is accounted for under the measurement
alternative prescribed in ASC 321, as it does not have a readily determinable fair value and is otherwise not subject to the equity method
of accounting. The investment is assessed for impairment and similar observable transactions on a quarterly basis. During the three months
ended June 30, 2024, the Company recognized a loss of $
| Inputs | ||||
June 17, 2024 | ||||
| Expected volatility | ||||
| Time to exit (in years) | ||||
| Probability that Series B-2 Preference Shares convert into Series B-1 Preference Shares | ||||
Net unrealized gains/(losses) recognized on
this investment were $
There was impairment recognized on this investment during the three and six months ended June 30, 2025 based upon a qualitative assessment.
| 17 |
Quorus Inc.
In June 2025, the Company made a $
This investment is accounted for under the measurement alternative prescribed in ASC 321, as it does not have a readily determinable fair value and is otherwise not subject to the equity method of accounting. The investment is assessed for impairment and similar observable transactions on a quarterly basis. There was impairment recognized on this investment during the three and six months ended June 30, 2025 based upon a qualitative assessment.
Other Investments
On October 2, 2024, the Company purchased an
investment of $
7. Fixed Assets, Net
The following table summarizes fixed assets:
June 30, 2025 | December 31, 2024 | |||||||
| Equipment | $ | $ | ||||||
| Less: accumulated depreciation | ( | ) | ( | ) | ||||
| Total | $ | $ | ||||||
8. Convertible Notes
The Company has the following convertible notes outstanding as of June 30, 2025:
| ● | $ |
| ● | $ |
| ● | $ |
Each class of notes were issued pursuant to indentures dated as of the issuance dates between the Company and U.S. Bank Trust Company, National Association, as trustee (either initially or as successor to U.S. Bank National Association, the “Trustee”), in private offerings to qualified institutional buyers pursuant to Rule 144A under the Securities Act of 1933, as amended.
As of June 30, 2025, the Company had an aggregate
principal amount of $
Key terms of the Convertible Notes are as follows:
| 2026 Notes | 2028 Notes | 2029 Notes | |||||||
| Principal outstanding | $ | $ | $ | ||||||
| Issuance date | |||||||||
| Maturity date (unless earlier converted, repurchased or redeemed) | |||||||||
| Interest rate | |||||||||
| Initial conversion price | $ | $ | $ | ||||||
| Initial conversion rate | |||||||||
| Redemption price | $ | $ | $ | ||||||
| ● | Interest rate: Payable semiannually in arrears on February 15 and August 15 of each year for the 2029 Notes and the 2028 Notes and on June 15 and December 15 of each year for the 2026 Notes. |
| ● | Conversion price: Convertible at an initial conversion rate into shares of the Company’s common stock, per $ |
| 18 |
| ● | Conversion: Holders may convert at their option at any time prior to the close of business on the business day immediately
preceding May 15, 2029 and May 15, 2028 for the 2029 Notes and the 2028 Notes, respectively, and March 15, 2026 for the 2026 Notes, only
under the following circumstances: (i) if the last reported sale price of the Company’s common stock for at least |
| ● | Cash settlement of principal amount: Upon conversion, the Company will pay cash up to the aggregate principal amount of the Convertible Notes to be converted. At its election, the Company will also settle the conversion obligation in excess of the aggregate principal amount of the Convertible Notes being converted in either cash, shares of its common stock or a combination of cash and shares of its common stock. |
| ● | Redemption price: The Company may redeem for cash all or any portion of the Convertible Notes, at its option, on or after August
20, 2026 and August 20, 2025 in respect of the 2029 Notes and the 2028 Notes, respectively, and June 20, 2023 in respect of the 2026 Notes
and on or prior to the 55th scheduled trading day immediately preceding the maturity date, if the last reported sale price
of the Company’s common stock has been at least |
| ● | Limited investor put rights: Holders of the Convertible Notes have the right to require the Company to repurchase for cash
all or a portion of their notes at |
| ● | Conversion rate increase in certain customary circumstances: In certain circumstances, conversions in connection with a “make-whole
fundamental change” (as defined in the indentures) or conversions of Convertible Notes called (or deemed called) for redemption
may result in an increase to the conversion rate, provided that the conversion rate will not exceed |
| ● | Seniority and Security: The Convertible Notes rank equal in right of payment and are the Company’s senior unsecured obligations. |
The indentures contain customary terms and covenants,
including that upon certain events of default occurring and continuing, either the Trustee or the respective holders of not less than
The following table provides a summary of the Convertible Notes at June 30, 2025 and December 31, 2024:
| June 30, 2025 | December 31, 2024 | |||||||||||||||||||||||||||||||
| 2026 Notes | 2028 Notes | 2029 Notes | Total | 2026 Notes | 2028 Notes | 2029 Notes | Total | |||||||||||||||||||||||||
| Principal amount | $ | $ | $ | $ | $ | $ | $ | $ | ||||||||||||||||||||||||
| Less: Unamortized issuance costs | ( | ) | ( | ) | ( | ) | ( | ) | ( | ) | ( | ) | ( | ) | ( | ) | ||||||||||||||||
| Carrying amount | $ | $ | $ | $ | $ | $ | $ | $ | ||||||||||||||||||||||||
| Effective interest rate(1) | ||||||||||||||||||||||||||||||||
_____________________________
| (1) |
Interest expense on the Convertible Notes was
$
| 19 |
The fair value of the Convertible Notes (classified
as Level 2 in the fair value hierarchy) was $
9. Payable to Gold Bullion Holdings (Jersey) Limited (“GBH”)
On November 20, 2023, the Company repurchased
all of its then-outstanding Series C Non-Voting Convertible Preferred Stock, par value $
Under U.S. GAAP, the obligation was recorded
at its present value utilizing a market rate of interest on the closing date of
June 30, 2025 | December 31, 2024 | ||||||||
| Current: | $ | $ | |||||||
| Long-term | |||||||||
| Total | $ | $ | |||||||
Interest expense recognized was $
10. Leases
The Company has entered into operating leases for its office facilities (including its corporate headquarters) and equipment. The Company has no finance leases.
The following table provides additional information regarding the Company’s leases:
Three Months Ended June 30, | Six Months Ended June 30, | |||||||||||||||
| 2025 | 2024 | 2025 | 2024 | |||||||||||||
| Lease cost: | ||||||||||||||||
| Operating lease cost | $ | $ | $ | $ | ||||||||||||
| Short-term lease cost | ||||||||||||||||
| Total lease cost | $ | $ | $ | $ | ||||||||||||
| Other information: | ||||||||||||||||
| Cash paid for amounts included in the measurement of operating liabilities (operating leases) | $ | $ | $ | $ | ||||||||||||
| Right-of-use assets obtained in exchange for new operating lease liabilities | ||||||||||||||||
| Weighted-average remaining lease term (in years)—operating leases | ||||||||||||||||
| Weighted-average discount rate—operating leases | ||||||||||||||||
None of the Company’s leases include variable payments, residual value guarantees or any restrictions or covenants relating to the Company’s ability to pay dividends or incur additional financing obligations.
| 20 |
The following table discloses future minimum lease payments at June 30, 2025 with respect to the Company’s operating lease liabilities:
| Remainder of 2025 | $ | |||
| 2026 | ||||
| 2027 and thereafter | ||||
| Total future minimum lease payments (undiscounted) | $ |
The following table reconciles the future minimum lease payments (disclosed above) at June 30, 2025 to the operating lease liabilities recognized in the Company’s Consolidated Balance Sheets:
| Amounts recognized in the Company’s Consolidated Balance Sheets | ||||
| Lease liability—short term | $ | |||
| Lease liability—long term | ||||
| Subtotal | ||||
| Difference between undiscounted and discounted cash flows | ||||
| Total future minimum lease payments (undiscounted) | $ | |||
11. Contingencies
The Company may be subject to reviews, inspections and investigations by regulatory authorities as well as legal proceedings arising in the ordinary course of business.
Closure of the WisdomTree WTI Crude Oil 3x Daily Leveraged ETP
Between December 2020 and December 2024, WMAI, WTMAML, WTUK and/or WT Ireland were served with eight separate writs of summons to appear before the Courts of Milan, Udine or Turin, Italy by investors seeking damages resulting from the closure of the WisdomTree WTI Crude Oil 3x Daily Leveraged ETP (“3OIL”) in March 2020. The product was dependent on the receipt of payments from a swap provider to satisfy payment obligations to the investors. Due to an extreme adverse move in oil futures relative to the oil futures’ closing price, the swap contract underlying 3OIL was terminated by the swap provider, which resulted in the compulsory redemption of 3OIL, all in accordance with the prospectus.
Since February 2022, seven of the eight actions
have been resolved in the Company’s favor, of which two have been appealed. Total damages sought by all investors related to the
remaining open and appealed claims were approximately €
Additionally, in July 2023, WT Ireland received
a letter from counsel on behalf of additional investors seeking damages of up to approximately €
The Company continues to assess the open and
appealed claims with its external counsel. The Company expects that losses, if any, arising from these claims will be covered under its
insurance policies, less a $
12. Variable Interest Entities
VIEs are entities with any of the following characteristics: (i) the entity does not have enough equity to finance its activities without additional financial support; (ii) the equity holders, as a group, lack the characteristics of a controlling financial interest; or (iii) the entity is structured with non-substantive voting rights.
Consolidation of a VIE is required for the party deemed to be the primary beneficiary, if any. The primary beneficiary is the party who has both (a) the power to direct the activities of a VIE that most significantly impact the entity’s economic performance and (b) an obligation to absorb losses of the entity or a right to receive benefits from the entity that could potentially be significant to the entity. The Company is not the primary beneficiary of any entities in which it has a variable interest as it does not have the power to direct the activities that most significantly impact the entities’ economic performance. Such power is conveyed through the entities’ boards of directors and the Company does not have control over the boards.
| 21 |
The following table presents information about the Company’s variable interests in non-consolidated VIEs:
June 30, 2025 | December 31, 2024 | |||||||
| Carrying Amount—Assets: | ||||||||
| Fnality International Limited—Series B-1 Preference Shares | $ | $ | ||||||
| Other investments | ||||||||
| Total | $ | $ | ||||||
| Maximum exposure to loss | $ | $ | ||||||
13. Revenues from Contracts with Customers
The following table presents the Company’s total revenues from contracts with customers:
Three Months Ended June 30, | Six Months Ended June 30, | |||||||||||||||
| 2025 | 2024 | 2025 | 2024 | |||||||||||||
| Revenues from contracts with customers: | ||||||||||||||||
| Advisory fees | $ | $ | $ | $ | ||||||||||||
| Other revenues | ||||||||||||||||
| Total operating revenues | $ | $ | $ | $ | ||||||||||||
The Company recognizes revenues from contracts with customers when the performance obligation is satisfied, which is when the promised services are transferred to the customer. A service is considered to be transferred when the customer obtains control, which is represented by the transfer of rights with regard to the service. Transfer of control happens either over time or at a point in time. When a performance obligation is satisfied over time, an entity is required to select a single method of measuring progress for each performance obligation that depicts the entity’s performance in transferring control of services to the customer.
A significant portion of the Company’s revenues from contracts with customers is derived primarily from investment advisory agreements with related parties (Note 14). These advisory fees are recognized over time, are earned from the Company’s ETPs and are calculated based on a percentage of the ETPs’ average daily net assets. There is no significant judgment in calculating amounts due which are invoiced monthly in arrears and are not subject to any potential reversal. Progress is measured using the practical expedient under the output method resulting in the recognition of revenue in the amount for which the Company has a right to invoice.
There are no contract assets or liabilities that arise in connection with the recognition of advisory fee revenue. In addition, there are no costs incurred to obtain or fulfill the contracts with customers, all of which are investment advisory agreements with related parties.
Other revenues include revenues the Company earns from swap providers associated with certain of the Company’s European listed ETPs, the nature of which are based on a percentage of the ETPs’ average daily net assets. The Company also earns transaction-based income on flows associated with certain European listed ETPs. There is no significant judgment in calculating amounts due, which are invoiced monthly or quarterly in arrears and are not subject to any potential reversal. Progress is measured using the practical expedient under the output method resulting in the recognition of revenue in the amount for which the Company has a right to invoice.
Geographic Distribution of Revenues
The following table presents the Company’s total revenues geographically as determined by where the respective management companies reside:
Three Months Ended June 30, | Six Months Ended June 30, | |||||||||||||||
| 2025 | 2024 | 2025 | 2024 | |||||||||||||
| Revenues from contracts with customers: | ||||||||||||||||
| United States | $ | $ | $ | $ | ||||||||||||
| Jersey | ||||||||||||||||
| Ireland | ||||||||||||||||
| Total operating revenues | $ | $ | $ | $ | ||||||||||||
| 22 |
14. Related Party Transactions
Investment Advisory Agreements
The Company’s revenues are derived primarily from investment advisory agreements with related parties. Under these agreements, the Company has licensed to related parties the use of certain of its own indexes for the U.S. WisdomTree ETFs, WisdomTree Digital Funds and WisdomTree UCITS ETFs. The relevant boards of trustees or boards of directors (including certain officers of the Company) of each of the related parties is primarily responsible for overseeing the management and affairs of the entities for the benefit of their respective stakeholders and have contracted with the Company to provide for general management and administration services. The Company is also responsible for certain expenses of the related parties, including the cost of transfer agency, custody, fund administration and accounting, legal, audit, and other non-distribution services, excluding extraordinary expenses, taxes and certain other expenses, which are included in fund management and administration in the Consolidated Statements of Operations. In exchange, the Company receives fees based on a percentage of the ETPs’ and the Digital Funds’ average daily net assets. A majority of the independent members of the respective board of trustees or board of directors are required to initially and annually (after the first two years) approve the advisory agreements of the U.S. WisdomTree ETFs and the WisdomTree Digital Funds and these agreements may be terminated by such board of trustees or board of directors upon notice.
The following table summarizes accounts receivable from related parties which are included as a component of accounts receivable in the Consolidated Balance Sheets:
June 30, 2025 | December 31, 2024 | |||||||
| Receivable from WTT | $ | $ | ||||||
| Receivable from ManJer Issuers | ||||||||
| Receivable from WMAI and WTICAV | ||||||||
| Total | $ | $ | ||||||
The allowance for credit losses on accounts receivable from related parties is insignificant when applying historical loss rates, adjusted for current conditions and supportable forecasts, to the amounts outstanding in the table above. Amounts outstanding are all invoiced in arrears, are less than 30 days aged and are collected shortly after the applicable reporting period.
The following table summarizes revenues from advisory services provided to related parties:
Three Months Ended June 30, | Six Months Ended June 30, | |||||||||||||||
| 2025 | 2024 | 2025 | 2024 | |||||||||||||
| Advisory services provided to WTT | $ | $ | $ | $ | ||||||||||||
| Advisory services provided to ManJer Issuers | ||||||||||||||||
| Advisory services provided to WMAI and WTICAV | ||||||||||||||||
| Total | $ | $ | $ | $ | ||||||||||||
Investments in WisdomTree Products
The Company also has investments in certain
WisdomTree products of $
Net unrealized and realized gains/(losses) related
to trading WisdomTree products were $
15. Stock-Based Awards
On July 15, 2022, the Company’s stockholders
approved the 2022 Equity Plan under which the Company may issue up to
The Company grants equity awards to employees and directors, which include restricted stock awards (“RSAs”), restricted stock units (“RSUs”), including deferred RSUs to non-employee directors, performance-based restricted stock units (“PRSUs”) and stock options. Certain awards described below are subject to acceleration under certain conditions.
| 23 |
| Stock options: | Generally issued for
terms of |
| RSAs/RSUs: | Awards are valued based on the Company’s stock price on grant date and generally vest ratably, on an annual basis, over three years. For non-employee directors, such awards generally vest on the one-year anniversary of the grant date. |
| Deferred RSUs: | Awards are valued based on the Company’s stock price on grant date and generally vest on the one-year anniversary of the grant date. The awards are issued pursuant to the Company’s Non-Employee Director Deferred Compensation Program and are settled based on timing elected by the recipient in advance. |
| PRSUs: | These awards cliff vest three years from the grant date and contain a market condition whereby the number of PRSUs ultimately vesting is tied to how the Company’s total shareholder return (“TSR”) compares to a peer group of other publicly traded asset managers over the three-year period. A Monte Carlo simulation is used to value these awards. |
● If the relative TSR is below the 25th percentile, then 0% of the target number of PRSUs granted will vest;
● If the relative TSR is at the 25th percentile, then 50% of the target number of PRSUs granted will vest;
● If the relative TSR is above the 25th percentile, then linear scaling is applied such that the percent of the target number of PRSUs vesting is 100% at the 50th percentile and capped at 200% of the target number of PRSUs granted for performance at the 85th percentile; and
● If the Company’s TSR is negative, the target number of PRSUs vesting is capped at 100% regardless of the relative TSR percentile.
Stock-based compensation expense was $
A summary of unrecognized stock-based compensation expense and average remaining vesting period is as follows:
| June 30, 2025 | ||||||||
Unrecognized Stock-Based | Weighted-Average Remaining Vesting Period (Years) | |||||||
| Employees and directors | $ | |||||||
A summary of stock-based compensation award activity (shares) during the three months ended June 30, 2025 is as follows:
| RSA | RSU | PRSU | ||||||||||
| Balance at April 1, 2025 | ||||||||||||
| Granted | ||||||||||||
| Vested | ( | ) | ||||||||||
| Forfeited | ( | ) | ||||||||||
| Stock dividends accrued | ||||||||||||
| Balance at June 30, 2025 | (1) | |||||||||||
_____________________________
| (1) |
| 24 |
16. Earnings Per Share
The following tables set forth reconciliations of the basic and diluted earnings per share computations for the periods presented:
| Three Months Ended June 30, | Six Months Ended June 30, | |||||||||||||||
| Basic Earnings per Share | 2025 | 2024 | 2025 | 2024 | ||||||||||||
| Net income | $ | $ | $ | $ | ||||||||||||
| Less: Income distributed to participating securities | ( | ) | ( | ) | ||||||||||||
| Less: Undistributed income allocable to participating securities | ( | ) | ( | ) | ( | ) | ||||||||||
| Net income available to common stockholders—Basic EPS | $ | $ | $ | $ | ||||||||||||
| Weighted average common shares (in thousands) | ||||||||||||||||
| Basic earnings per share | $ | $ | $ | $ | ||||||||||||
| Three Months Ended June 30, | Six Months Ended June 30, | |||||||||||||||
| Diluted Earnings per Share | 2025 | 2024 | 2025 | 2024 | ||||||||||||
| Net income available to common stockholders | $ | $ | $ | $ | ||||||||||||
| Add back: Undistributed income allocable to participating securities | ||||||||||||||||
| Less: Reallocation of undistributed income allocable to participating securities considered potentially dilutive | ( | ) | ( | ) | ( | ) | ||||||||||
| Net income available to common stockholders—Diluted EPS | $ | $ | $ | $ | ||||||||||||
| Weighted Average Diluted Shares (in thousands): | ||||||||||||||||
| Weighted average common shares | ||||||||||||||||
| Dilutive effect of common stock equivalents, excluding participating securities | ||||||||||||||||
| Weighted average diluted shares, excluding participating securities (in thousands) | ||||||||||||||||
| Diluted earnings per share | $ | $ | $ | $ | ||||||||||||
Diluted earnings per share presented above is
calculated using the two-class method as this method results in the lowest diluted earnings per share amount for common stock. Total antidilutive
non-participating common stock equivalents were
There were no potential common shares associated with the conversion options embedded in the Convertible Notes included in weighted average diluted shares for the three and six months ended June 30, 2025 and 2024 as the Company’s average stock price was lower than the conversion price.
The following table reconciles weighted average diluted shares as reported on the Company’s Consolidated Statements of Operations for the three and six months ended June 30, 2025 and 2024, which are determined pursuant to the treasury stock method, to the weighted average diluted shares used to calculate diluted earnings per share as disclosed in the table above:
Three Months Ended June 30, | Six Months Ended June 30, | |||||||||||||||
| Reconciliation of Weighted Average Diluted Shares (in thousands) | 2025 | 2024 | 2025 | 2024 | ||||||||||||
| Weighted average diluted shares as disclosed on the Consolidated Statements of Operations | ||||||||||||||||
| Less: Participating securities | ||||||||||||||||
| Weighted average shares of common stock issuable upon conversion of the Series A Preferred Stock | ( | ) | ( | ) | ||||||||||||
| Potentially dilutive restricted stock awards | ( | ) | ( | ) | ( | ) | ||||||||||
| Weighted average diluted shares used to calculate diluted earnings per share as disclosed in the table above | ||||||||||||||||
| 25 |
17. Income Taxes
Effective Income Tax Rate – Three and Six Months Ended June 30, 2025
The Company’s effective income tax rate
during the three months ended June 30, 2025 was
The Company’s effective income tax rate
during the six months ended June 30, 2025 was
Effective Income Tax Rate – Three and Six Months Ended June 30, 2024
The Company’s effective income tax rate
during the three months ended June 30, 2024 was
The Company’s effective income tax rate
during the six months ended June 30, 2024 was
Income Tax Payments
Disclosed below is a summary of income taxes paid by jurisdiction pursuant to the disclosure requirements of ASU 2023-09 for the six months ended June 30, 2025:
Six Months Ended June 30, 2025 | ||||
| United States - Federal | $ | |||
| United States - State and local | ||||
| United Kingdom | ||||
| Other | ||||
| $ | ||||
Deferred Tax Assets
A summary of the components of the Company’s deferred tax assets at June 30, 2025 and December 31, 2024 is as follows:
| June 30, 2025 | December 31, 2024 | |||||||
| Deferred tax assets: | ||||||||
| Capital losses | $ | $ | ||||||
| Accrued expenses | ||||||||
| Stock-based compensation | ||||||||
| NOLs—Foreign | ||||||||
| Interest carryforward. | ||||||||
| Goodwill and intangible assets | ||||||||
| Operating lease liabilities | ||||||||
| Software capitalization | ||||||||
| Foreign currency translation adjustment | ||||||||
| Other | ||||||||
| Deferred tax assets | ||||||||
| Deferred tax liabilities: | ||||||||
| Foreign currency translation adjustment | ||||||||
| Fixed assets and prepaid assets | ||||||||
| Unrealized gains | ||||||||
| Right of use assets—operating leases | ||||||||
| Unremitted earnings—European subsidiaries | ||||||||
| Deferred tax liabilities | ||||||||
| Total deferred tax assets less deferred tax liabilities | ||||||||
| Less: Valuation allowance | ( | ) | ( | ) | ||||
| Deferred tax assets, net | $ | $ | ||||||
| 26 |
Capital Losses – U.S.
The Company’s tax effected capital losses
at June 30, 2025 were $
Net Operating Losses – Europe
One of the Company’s European subsidiaries
generated net operating losses (“NOLs”) outside the U.S. These tax effected NOLs, all of which are carried forward indefinitely,
were $
Valuation Allowance
The Company’s valuation allowance has been established on its net capital losses (net of unrealized gains), as it is more-likely-than-not that these deferred tax assets will not be realized.
Income Tax Examinations
The Company is subject to U.S. federal income tax as well as income tax of multiple state, local and certain foreign jurisdictions. As of June 30, 2025, with few exceptions, the Company was no longer subject to income tax examinations by any taxing authority for the years before 2020.
Uncertain Tax Positions
There were no unrecognized tax benefits at June 30, 2025 and December 31, 2024.
Undistributed Earnings of Foreign Subsidiaries
ASC 740-30, Income Taxes, provides guidance
that U.S. companies do not need to recognize tax effects on foreign earnings that are indefinitely reinvested. The Company repatriates
earnings of its foreign subsidiaries and therefore has recognized a deferred tax liability of $
U.S. Tax Reform
On July 4, 2025, the One Big Beautiful Bill
Act (the “OBBBA”) was enacted, extending or modifying several provisions of the Tax Cuts and Jobs Act of 2017. The OBBBA
left corporate income tax rates unchanged, but reinstated immediate expensing of domestic research and development expenditures, revised
Section 163(j) interest limitations, expanded Section 162(m) aggregation rules, updated GILTI provisions and restored
While the OBBBA is expected to accelerate certain previously deferred tax deductions, it is not otherwise anticipated to have a material impact to the Company’s financial statements.
18. Shares Repurchased
On February 22, 2022, the Company’s Board
of Directors approved an increase of $
The Company repurchased
As of June 30, 2025, $
| 27 |
19. Goodwill and Intangible Assets
Goodwill
The table below sets forth goodwill which is tested annually for impairment on November 30th:
Total | |||||
| Balance at January 1, 2025 | $ | ||||
| Changes | |||||
| Balance at June 30, 2025 | $ | ||||
Of the total goodwill of $
Intangible Assets
The table below sets forth the Company’s intangible assets which are tested annually for impairment on November 30th:
| Balance at June 30, 2025 | ||||||||||||
| Item | Gross Asset | Accumulated Amortization | Net Asset | |||||||||
| ETFS Acquisition | $ | $ | $ | |||||||||
| Software development | ( | ) | ||||||||||
| Balance at June 30, 2025 | $ | $ | ( | ) | $ | |||||||
Balance at December 31, 2024 | ||||||||||||
| Item | Gross Asset | Accumulated | Net Asset | |||||||||
| ETFS Acquisition | $ | $ | $ | |||||||||
| Software development | ( | ) | ||||||||||
| Balance at December 31, 2024 | $ | $ | ( | ) | $ | |||||||
ETFS Acquisition (Indefinite-Lived)
In connection with the ETFS Acquisition, which
was completed on
Software Development (Finite-Lived)
Internally-developed software is amortized over
a useful life of
As of June 30, 2025, expected amortization expense for the unamortized finite-lived intangible assets for the next five years and thereafter is as follows:
| Remainder of 2025 | $ | ||||
| 2026 | |||||
| 2027 | |||||
| 2028 and thereafter | |||||
| Total expected amortization expense | $ |
The weighted-average remaining useful life of
the finite-lived intangible assets is
20. Segment Information
The Company, through its subsidiaries in the U.S. and Europe, offers a diverse suite of ETPs, models, solutions and products leveraging blockchain technology. The Company conducts business as a single operating segment as an ETP sponsor and asset manager, which is based upon the Company’s current organizational and management structure, as well as information used by the CODM to allocate resources and assess performance and other factors. The accounting policies of the segment are the same as those described in Note 2.
| 28 |
The key measures of segment profit or loss that the CODM uses to allocate resources and assess performance are the Company’s consolidated net income, as reported on the Consolidated Statements of Operations, as well as adjusted operating income and adjusted operating income margin, which are exclusive of items that are non-recurring or not core to the Company’s operating business.
The table below discloses these key measures and is inclusive of a reconciliation of the Company’s operating income and operating income margin as computed under U.S. GAAP to the Company’s Non-GAAP adjusted operating income and adjusted operating income margin utilized by the CODM:
Three Months Ended June 30, | Six Months Ended June 30, | |||||||||||||||
| 2025 | 2024 | 2025 | 2024 | |||||||||||||
| Operating revenues | $ | $ | $ | $ | ||||||||||||
| Operating income | ||||||||||||||||
| Add back: Expenses incurred in response to an activist campaign | ||||||||||||||||
| Add back: Acquisition-related costs | ||||||||||||||||
| Adjusted operating income | $ | $ | $ | $ | ||||||||||||
| Operating income margin | ||||||||||||||||
| Adjusted operating income margin | ||||||||||||||||
Expenses incurred in response to an activist
campaign for the three and six months ended June 30, 2024 include $
All expense categories on the Consolidated Statements of Operations are significant and there are no other significant segment expenses that would require disclosure. Assets provided to the CODM are consistent with those reported on the Consolidated Balance Sheets with particular emphasis on the Company’s available liquidity, including its cash, cash equivalents and restricted cash, financial instruments owned, accounts receivable and securities held-to-maturity, reduced by current liabilities, seed capital and regulatory capital requirements.
There are no intra-entity sales or transfers and no significant expense categories regularly provided to the CODM beyond those disclosed in the Consolidated Statements of Operations. The CODM manages the business using consolidated expense information, adjusted for items that are non-recurring or not core to the Company’s operating business as disclosed in the table above, as well as regularly provided budgeted or forecasted expense information for the single operating segment.
Information related to the Company’s products and services and geographical distribution of revenues is disclosed in Note 13.
21. Subsequent Events
Equity Purchase Agreement with Ceres Partners, LLC
On July 31, 2025, the Company and WisdomTree Farmland Holdings, Inc. (the “Purchaser”), a wholly-owned subsidiary of the Company, entered into an Equity Purchase Agreement (the “Purchase Agreement”) with Ceres Partners, LLC, an Indiana limited liability company (“Ceres”), the members of Ceres (together, the “Sellers”), and an individual acting as the Sellers’ representative, pursuant to which the Purchaser agreed to acquire from the Sellers all of the issued and outstanding equity interests of Ceres (the “Ceres Acquisition”), subject to the terms and conditions set forth therein.
Pursuant to the Purchase Agreement, the Purchaser
will acquire Ceres for aggregate consideration consisting of (i) $
The Purchaser, the Sellers and Ceres each have made customary warranties in the Purchase Agreement with respect to its ability to enter into and consummate the Ceres Acquisition. The Sellers and Ceres have made customary warranties in the Purchase Agreement with respect to the business of Ceres. The Purchaser and the Sellers have agreed under the Purchase Agreement to make certain undertakings in seeking regulatory approvals and to maintain the confidentiality of certain information not otherwise required to be disclosed under applicable law. The Sellers and Ceres also have agreed to carry on the business of Ceres in the ordinary course consistent with past practice and not to take certain actions during the period between entry into the Purchase Agreement and the Closing. The Sellers have agreed to non-competition and non-solicitation covenants. The Purchaser also has agreed to matters relating to the employment of continuing employees of Ceres and its affiliate. The Sellers will be subject to customary indemnification rights for transactions of this type, including with respect to breaches of warranties and other specified matters; provided that the Purchaser has obtained a representations and warranties insurance policy related to certain risks associated with the Ceres Acquisition. The indemnification obligations of the Sellers are subject to escrows, thresholds and caps with respect to breaches of certain warranties. The Purchaser will be subject to limited indemnification obligations customary for a transaction of this type. The Company has agreed to guarantee the timely payment and performance of each of the obligations of the Purchaser under the Purchase Agreement.
| 29 |
Simultaneously with the execution of the Purchase Agreement, WisdomTree Asset Management, Inc., a wholly-owned subsidiary of the Company, entered into employment agreements with certain key employees of Ceres, which will become effective as of the Closing.
The Ceres Acquisition is expected to close in the fourth quarter of 2025, subject to the satisfaction or waiver of customary closing conditions, including, among others, obtaining regulatory approvals, required consents and financing. In addition, the completion of the Ceres Acquisition is conditioned upon (i) employment agreements with certain key employees of Ceres being in full force and effect, (ii) Ceres delivering executed consents from both Ceres, as general partner of Ceres Farms, LLC (“Ceres Farms”), and a majority of the investors in Ceres Farms, (iii) the Closing Revenue Run-Rate being no less than 85% of the Base Revenue Run-Rate (each as defined in the Purchase Agreement) and (iv) tail coverage for the insurance coverages currently in effect for the directors, managers and officers of the acquired companies being in full force and effect. The Purchaser’s obligation to consummate the Ceres Acquisition is further subject to the condition that, during the period between July 31, 2025 and the Closing, there has not been a Material Adverse Effect (as defined in the Purchase Agreement).
The Purchase Agreement will terminate if the
Closing has not occurred on or prior to December 31, 2025, subject to the parties agreeing to extend such date, as well as for material
breaches not cured prior to December 31, 2025. If the Purchase Agreement is terminated by the Purchaser, subject to certain other conditions,
the Purchaser will reimburse Ceres for Ceres’ Eligible Expenses (as defined in the Purchase Agreement) subject to a $
The Company evaluated subsequent events through the date of issuance of the consolidated financial statements. There were no other events requiring disclosure.
| 30 |
| ITEM 2. | MANAGEMENT’S DISCUSSION AND ANALYSIS OF FINANCIAL CONDITION AND RESULTS OF OPERATIONS |
The following discussion and analysis of our financial condition and results of operations should be read together with our consolidated financial statements and the related notes and the other financial information included elsewhere in this Report. In addition to historical consolidated financial information, the following discussion contains forward-looking statements that reflect our plans, estimates and beliefs. Our actual results could differ materially from those discussed in the forward-looking statements. Factors that could cause or contribute to these differences include those discussed below. For a more complete description of the risks noted above and other risks that could cause our actual results to materially differ from our current expectations, please see Item 1A “Risk Factors” in our Annual Report on Form 10-K for the fiscal year ended December 31, 2024. We assume no obligation to update or revise publicly any forward-looking statements, whether as a result of new information, future events or otherwise, unless required by law.
Executive Summary
We are a global financial innovator, offering a diverse suite of ETPs, models, solutions, as well as digital asset-related products. Our offerings empower investors to shape their financial future and equip financial professionals to grow their businesses. Leveraging the latest financial infrastructure, we create products that emphasize access, transparency and provide an enhanced user experience. Building on our heritage of innovation, we offer next-generation digital products and services related to tokenized real world assets and stablecoins, including Digital Funds, as well as our blockchain-native digital wallet, WisdomTree Prime, and institutional platform, WisdomTree Connect.
As of June 30, 2025, we managed approximately $126.1 billion in AUM. Our ETPs span a broad range of strategies including equities, fixed income, commodities, leveraged-and-inverse, currency, alternatives and cryptocurrency exposures. We have launched many first-to-market products and pioneered a unique alternative-weighting approach called “Modern Alpha” that combines the outperformance potential of active management with the cost effective benefits of passive management.
Our products are distributed across all major asset management industry channels, including banks, brokerage firms, registered investment advisers, institutional investors, private wealth managers and online brokers, primarily through our dedicated sales team. We believe technology is transforming how financial advisors conduct business, and through our Advisor and Portfolio Solutions programs we offer technology-enabled and research-driven solutions. These include portfolio construction, asset allocation, practice management services and digital tools to help advisors address technology challenges and scale their businesses.
As pioneers in tokenization and blockchain technology, we view this as the next phase in the evolution in financial services. Through our digital assets strategy, we are committed to “responsible DeFi,” aligning with regulatory standards to foster growth in this rapidly evolving space. We believe that expanding into digital assets and blockchain-enabled finance not only complements our core competencies, but will diversify our revenue streams and further contribute to our growth.
We were incorporated under the laws of the state of Delaware on September 19, 1985 as Financial Data Systems, Inc. and were ultimately renamed WisdomTree, Inc. on November 7, 2022.
| 31 |
Pending Acquisition of Ceres Partners, LLC (“Ceres”)
On July 31, 2025, we entered into an Equity Purchase Agreement (the “Purchase Agreement”) with Ceres, pursuant to which we agreed to acquire all of the issued and outstanding equity interests of Ceres (the “Ceres Acquisition”), a leading U.S.-based alternative asset manager specializing in farmland investments. The Ceres Acquisition is expected to close in the fourth quarter of 2025, subject to the satisfaction or waiver of customary closing conditions, including, among others, obtaining regulatory approvals, required consents and financing.
Pursuant to the Purchase Agreement, we will acquire Ceres for aggregate consideration consisting of (i) $275.0 million in cash payable at closing and subject to customary post-closing adjustments, including adjustments to cash, indebtedness and working capital, and (ii) earnout consideration of up to $225.0 million, payable in 2030, contingent upon Ceres achieving a compound annual growth rate in revenue of 12% to 22% during the earnout measurement period of January 1, 2025 through December 31, 2029. For additional information about the Ceres Acquisition, see Note 21 to our Consolidated Financial Statements.
Assets Under Management
WisdomTree ETPs
We offer ETPs covering equity, fixed income, commodities and currency, leveraged-and-inverse, alternatives and cryptocurrency. The chart below sets forth the asset mix of our ETPs at June 30, 2025, March 31, 2025, and June 30, 2024:
Market Environment
The second quarter of 2025 was dominated by uncertainty over U.S. trade tariffs. However, equities made gains as the initially announced tariffs were later suspended and recession fears receded. In fixed income markets, the focus began to turn from interest rate cuts to worries over debt sustainability. In commodities, the S&P GSCI Index declined in the quarter and both the energy and agriculture components were weak.
Digital asset markets were shaped by major regulatory and institutional developments amid macroeconomic uncertainty. Both Bitcoin and Ethereum returned more than 30% during the quarter. The U.S. Senate passed the GENIUS Act, providing long-awaited clarity for stablecoin regulation. Stablecoins are now being implemented by some of the largest financial institutions, fintech firms and crypto native issuers globally.
During the quarter, the S&P 500, the MSCI EAFE Index (local currency), the MSCI EMU Index (local currency), the MSCI Japan Index (local currency), the MSCI Emerging Markets Index (U.S. dollar) and gold prices increased by 10.9%, 5.1%, 5.5% 7.6%, 12.2% and 5.5%, respectively. The U.S. dollar weakened 8.2%, 6.0% and 3.7%, respectively, versus the euro, British pound and Japanese yen during the quarter.
| 32 |
U.S. Listed ETF Industry Flows
U.S. listed ETF industry net flows were $241.5 billion for the three months ended June 30, 2025. U.S. equity and fixed income gathered the majority of those flows.
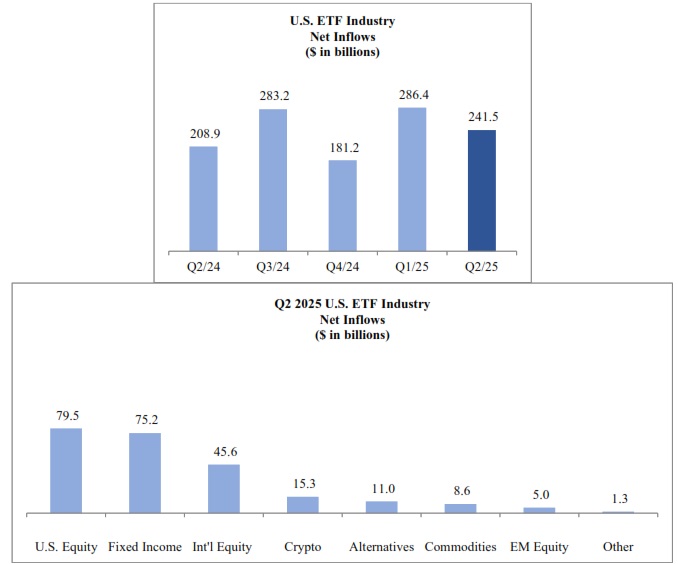
Source: Morningstar
| 33 |
European Listed ETP Industry Flows
European listed ETP industry net flows were $54.9 billion for the three months ended June 30, 2025. Equity and fixed income gathered the majority of those flows.
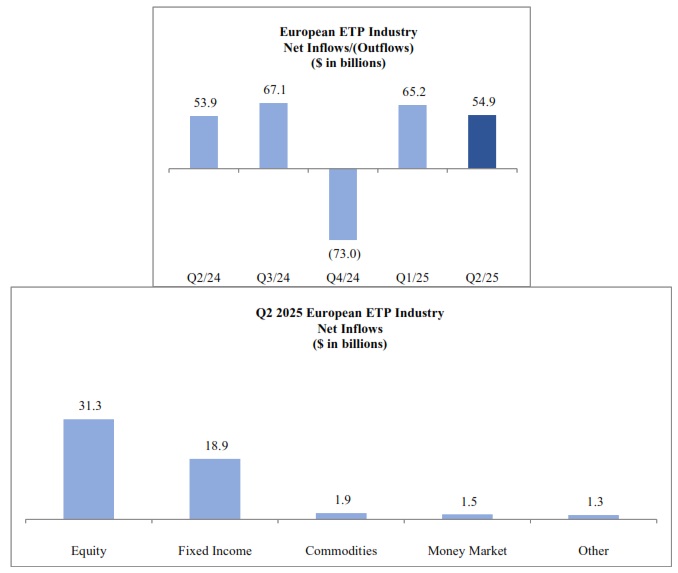
Source: Morningstar
| 34 |
Our Operating and Financial Results
We operate as an ETP sponsor and asset manager, providing investment advisory services globally through our subsidiaries in the U.S. and Europe.
U.S. Listed ETFs
The AUM of our U.S. listed exchange traded funds, or U.S. listed ETFs, increased from $80.5 billion at March 31, 2025 to $85.2 billion at June 30, 2025 due to market appreciation and net inflows.
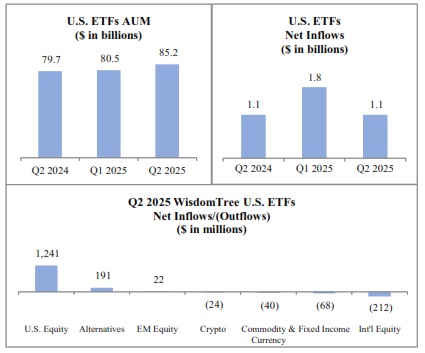
European Listed ETPs
The AUM of our European listed (including internationally cross-listed) ETPs, or European listed ETPs, increased from $35.1 billion at March 31, 2025 to $40.5 billion at June 30, 2025 due to market appreciation and net inflows.
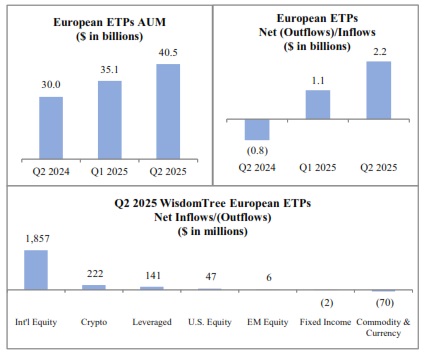
| 35 |
Consolidated Operating Results
The following table sets forth our revenues and net income/(loss) for the most recent five quarters.
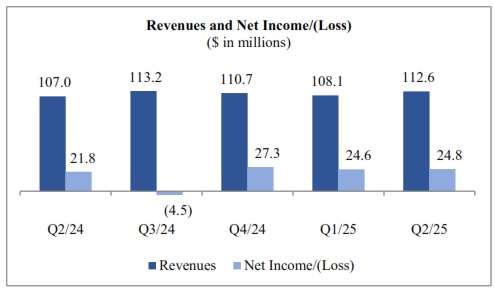
| ● | Revenues – Total revenues increased 5.2% from the three months ended June 30, 2024 to $112.6 million in the comparable period in 2025 due to higher average AUM, partly offset by a lower average advisory fee. |
| ● | Expenses – Total operating expenses increased 6.1% from the three months ended June 30, 2024 to $78.0 million in the comparable period in 2025 primarily due to acquisition-related costs and higher compensation expense arising from increased headcount, as well as higher third-party distribution fees and fund management and administration expenses. These increases were partly offset by lower professional fees. |
| ● | Other Income/(Expenses) – Other income/(expenses) includes interest income and interest expense, impairments and other losses and gains. Further information is provided herein. |
| ● | Net income – We reported net income of $24.8 million and $21.8 million during the three months ended June 30, 2025 and 2024, respectively. |
Guidance Update for the Year Ending December 31, 2025
Compensation to Revenue Ratio
Our compensation to revenue ratio for the year ending December 31, 2025 is currently estimated to range from 28% to 30% (unchanged from our guidance provided last quarter) and takes into consideration planned hires as well as year-end compensation adjustments and the annualization of hires made during 2024. The range also considers variability in incentive compensation with drivers including the magnitude of our flows, revenues and operating income growth, margin expansion and our stock price performance in relation to our peers. A range is provided in consideration of uncertain market conditions.
Discretionary Spending
Discretionary spending includes marketing, sales, professional fees, occupancy and equipment, depreciation and amortization and other expenses. During the six months ended June 30, 2025, our discretionary spending was $34.2 million, exclusive of acquisition-related costs incurred to date. We currently estimate our discretionary spending (exclusive of acquisition-related costs) for the year ending December 31, 2025 to range from $68.0 million to $72.0 million (unchanged from our guidance range provided last quarter). We estimate the impact of foreign exchange rates to adversely impact our forecasted expenses by approximately $3.0 million if British pound and euro foreign exchange rates at June 30, 2025 were to remain constant during the remainder of the year. This is offset by incremental revenues earned on foreign denominated revenues such that the overall impact of foreign exchange rates to our overall net operating results is immaterial.
Gross Margin
We define gross margin as total operating revenues less fund management and administration expenses. Gross margin percentage is calculated as gross margin divided by total operating revenues. Our gross margin was 81.0% during the six months ended June 30, 2025. For the year ending December 31, 2025, we currently estimate that our gross margin percentage will be 81.0% to 82.0% (unchanged from our guidance range provided last quarter).
| 36 |
Third-Party Distribution Fees
We currently estimate third-party distribution expense to be approximately $14.0 million to $15.0 million (previously $11.0 million to $12.0 million) for the year ending December 31, 2025, due to strong organic growth and AUM expansion across our distribution platforms.
Interest Expense
We currently estimate our interest expense for the year ending December 31, 2025 to be $22.0 million (unchanged from our guidance range provided last quarter), which is inclusive of approximately $2.0 million of interest cost we are required to impute under U.S. GAAP related to our interest-free financing of the shares of Series C Non-Voting Convertible Preferred Stock (the “Series C Preferred Stock”) we repurchased from Gold Bullion Holdings (Jersey) Limited (“GBH”), a subsidiary of the World Gold Council, in November 2023.
Interest Income
We currently estimate our interest income for the year ending December 31, 2025 to be $8.0 million (unchanged from the guidance range provided last quarter), based upon the magnitude of our forecasted interest-earning assets.
Income Tax Expense
We currently estimate that our consolidated normalized effective tax rate will be approximately 24.0% to 25.0% for the year ending December 31, 2025 (unchanged from the guidance range provided last quarter), taking into consideration the current distribution of profits between the U.S. and Europe.
This estimated rate may change and is dependent upon our actual taxable income earned in relation to our forecasts as well as any other items which may arise that are not currently forecasted. Such items may include, but are not limited to, increases or decreases in valuation allowances and any stock-based compensation windfalls or shortfalls. Additional corporate tax legislation could also impact our normalized effective tax rate.
Weighted Average Diluted Shares
We currently estimate our weighted average diluted shares to be between 147.0 million and 148.0 million (previously 147.0 million and 149.0 million) during the year ending December 31, 2025. This guidance does not take into consideration any variability in shares associated with our Convertible Notes. While our Convertible Notes require principal to be paid in cash, our diluted shares would need to be increased for any incremental shares associated with an exercise of the conversion option if our stock price exceeds the applicable conversion price of our Convertible Notes of $9.54 per share for the 5.75% Convertible Senior Notes due 2028, $11.04 per share for the 3.25% Convertible Senior Notes due 2026 and $11.82 per share for the 3.25% Convertible Senior Notes due 2029.
| 37 |
Key Operating Statistics
The following table presents key operating statistics that serve as indicators for the performance of our business:
| Three Months Ended | Six Months Ended | |||||||||||||||||||
| June 30, | March 31, | June 30, | June 30, | June 30, | ||||||||||||||||
| 2025 | 2025 | 2024 | 2025 | 2024 | ||||||||||||||||
| GLOBAL ETPs (in millions) | ||||||||||||||||||||
| Beginning of period assets | $ | 115,787 | $ | 109,779 | $ | 107,230 | $ | 109,779 | $ | 100,124 | ||||||||||
| Add: Digital Assets—Jan. 1, 2025 | — | 32 | — | $ | 32 | — | ||||||||||||||
| Inflows | 3,527 | 3,052 | 340 | 6,579 | 2,328 | |||||||||||||||
| Market appreciation | 6,756 | 2,924 | 2,116 | 9,680 | 7,234 | |||||||||||||||
| End of period assets | $ | 126,070 | $ | 115,787 | $ | 109,686 | $ | 126,070 | $ | 109,686 | ||||||||||
| Average assets during the period | $ | 119,185 | $ | 114,622 | $ | 108,479 | $ | 116,904 | $ | 105,470 | ||||||||||
| Average advisory fee during the period | 0.35 | % | 0.35 | % | 0.37 | % | 0.35 | % | 0.37 | % | ||||||||||
| Number of products—end of the period | 383 | 375 | (1) | 350 | 383 | 350 | ||||||||||||||
| U.S. LISTED ETFs (in millions) | ||||||||||||||||||||
| Beginning of period assets | $ | 80,531 | $ | 79,095 | $ | 78,087 | $ | 79,095 | $ | 72,486 | ||||||||||
| Inflows | 1,110 | 1,847 | 1,106 | 2,957 | 3,089 | |||||||||||||||
| Market appreciation/(depreciation) | 3,538 | (411 | ) | 529 | 3,127 | 4,147 | ||||||||||||||
| End of period assets | $ | 85,179 | $ | 80,531 | $ | 79,722 | $ | 85,179 | $ | 79,722 | ||||||||||
| Average assets during the period | $ | 81,525 | $ | 81,127 | $ | 78,523 | $ | 81,326 | $ | 76,677 | ||||||||||
| Number of ETFs – end of the period | 81 | 78 | 78 | 81 | 78 | |||||||||||||||
| EUROPEAN LISTED ETPs (in millions) | ||||||||||||||||||||
| Beginning of period assets | $ | 35,124 | $ | 30,684 | $ | 29,143 | $ | 30,684 | $ | 27,638 | ||||||||||
| Inflows/(outflows) | 2,201 | 1,104 | (766 | ) | 3,305 | (761 | ) | |||||||||||||
| Market appreciation | 3,216 | 3,336 | 1,587 | 6,552 | 3,087 | |||||||||||||||
| End of period assets | $ | 40,541 | $ | 35,124 | $ | 29,964 | $ | 40,541 | $ | 29,964 | ||||||||||
| Average assets during the period | $ | 37,439 | $ | 33,415 | $ | 29,956 | $ | 35,427 | $ | 28,793 | ||||||||||
| Number of ETPs—end of the period | 285 | 280 | 272 | 285 | 272 | |||||||||||||||
| DIGITAL ASSETS ($ in millions) | ||||||||||||||||||||
| Beginning of period assets | $ | 132 | $ | — | $ | — | $ | — | $ | — | ||||||||||
| Add: Digital Assets—Jan. 1, 2025 | — | 32 | — | 32 | — | |||||||||||||||
| Inflows | 216 | 101 | — | 317 | — | |||||||||||||||
| Market appreciation/(depreciation) | 2 | (1 | ) | — | 1 | — | ||||||||||||||
| End of period assets | $ | 350 | $ | 132 | $ | — | $ | 350 | $ | — | ||||||||||
| Average assets during the period | $ | 221 | $ | 80 | $ | — | $ | 151 | $ | — | ||||||||||
| Number of products—end of the period | 17 | 17 | (1) | — | 17 | — | ||||||||||||||
| PRODUCT CATEGORIES (in millions) | ||||||||||||||||||||
| U.S. Equity | ||||||||||||||||||||
| Beginning of period assets | $ | 35,628 | $ | 35,414 | $ | 31,670 | $ | 35,414 | $ | 29,156 | ||||||||||
| Add: Digital Assets—Jan. 1, 2025 | — | 9 | — | 9 | — | |||||||||||||||
| Inflows | 1,288 | 962 | 221 | 2,250 | 757 | |||||||||||||||
| Market appreciation/(depreciation) | 1,701 | (757 | ) | (57 | ) | 944 | 1,921 | |||||||||||||
| End of period assets | $ | 38,617 | $ | 35,628 | $ | 31,834 | $ | 38,617 | $ | 31,834 | ||||||||||
| Average assets during the period | $ | 36,080 | $ | 36,278 | $ | 31,339 | $ | 36,178 | $ | 30,745 | ||||||||||
| Commodity & Currency | ||||||||||||||||||||
| Beginning of period assets | $ | 25,487 | $ | 21,906 | $ | 21,944 | $ | 21,906 | $ | 21,336 | ||||||||||
| Add: Digital Assets—Jan. 1, 2025 | — | 1 | — | 1 | — | |||||||||||||||
| Outflows | (110 | ) | (159 | ) | (1,499 | ) | (269 | ) | (1,959 | ) | ||||||||||
| Market appreciation | 1,319 | 3,739 | 1,542 | 5,058 | 2,610 | |||||||||||||||
| End of period assets | $ | 26,696 | $ | 25,487 | $ | 21,987 | $ | 26,696 | $ | 21,987 | ||||||||||
| Average assets during the period | $ | 25,888 | $ | 23,996 | $ | 22,437 | $ | 24,942 | $ | 21,637 | ||||||||||
| 38 |
| Three Months Ended | Six Months Ended | |||||||||||||||||||
| June 30, | March 31, | June 30, | June 30, | June 30, | ||||||||||||||||
| 2025 | 2025 | 2024 | 2025 | 2024 | ||||||||||||||||
| Fixed Income | ||||||||||||||||||||
| Beginning of period assets | $ | 22,230 | $ | 20,043 | $ | 21,218 | $ | 20,043 | $ | 21,197 | ||||||||||
| Add: Digital Assets—Jan. 1, 2025 | — | 21 | — | 21 | — | |||||||||||||||
| Inflows | 146 | 2,093 | 236 | 2,239 | 222 | |||||||||||||||
| Market appreciation/(depreciation) | 167 | 73 | (24 | ) | 240 | 11 | ||||||||||||||
| End of period assets | $ | 22,543 | $ | 22,230 | $ | 21,430 | $ | 22,543 | $ | 21,430 | ||||||||||
| Average assets during the period | $ | 22,526 | $ | 21,464 | $ | 21,277 | $ | 21,995 | $ | 21,180 | ||||||||||
| International Developed Market Equity | ||||||||||||||||||||
| Beginning of period assets | $ | 18,178 | $ | 17,602 | $ | 18,103 | $ | 17,602 | $ | 15,103 | ||||||||||
| Inflows | 1,645 | 474 | 1,253 | 2,119 | 2,850 | |||||||||||||||
| Market appreciation | 1,902 | 102 | 29 | 2,004 | 1,432 | |||||||||||||||
| End of period assets | $ | 21,725 | $ | 18,178 | $ | 19,385 | $ | 21,725 | $ | 19,385 | ||||||||||
| Average assets during the period | $ | 19,577 | $ | 18,275 | $ | 18,809 | $ | 18,926 | $ | 17,750 | ||||||||||
| Emerging Market Equity | ||||||||||||||||||||
| Beginning of period assets | $ | 9,985 | $ | 10,468 | $ | 11,189 | $ | 10,468 | $ | 10,726 | ||||||||||
| Inflows/(outflows) | 28 | (445 | ) | 57 | (417 | ) | 274 | |||||||||||||
| Market appreciation/(depreciation) | 944 | (38 | ) | 629 | 906 | 875 | ||||||||||||||
| End of period assets | $ | 10,957 | $ | 9,985 | $ | 11,875 | $ | 10,957 | $ | 11,875 | ||||||||||
| Average assets during the period | $ | 10,295 | $ | 10,072 | $ | 11,448 | $ | 10,184 | $ | 11,174 | ||||||||||
| Leveraged & Inverse | ||||||||||||||||||||
| Beginning of period assets | $ | 2,133 | $ | 1,924 | $ | 1,828 | $ | 1,924 | $ | 1,815 | ||||||||||
| Inflows/(outflows) | 141 | 116 | (18 | ) | 257 | (68 | ) | |||||||||||||
| Market appreciation | 357 | 93 | 112 | 450 | 175 | |||||||||||||||
| End of period assets | $ | 2,631 | $ | 2,133 | $ | 1,922 | $ | 2,631 | $ | 1,922 | ||||||||||
| Average assets during the period | $ | 2,354 | $ | 2,083 | $ | 1,905 | $ | 2,219 | $ | 1,849 | ||||||||||
| Cryptocurrency | ||||||||||||||||||||
| Beginning of period assets | $ | 1,553 | $ | 1,912 | $ | 874 | $ | 1,912 | $ | 414 | ||||||||||
| Add: Digital Assets—Jan. 1, 2025 | — | 1 | — | 1 | — | |||||||||||||||
| Inflows/(outflows) | 198 | (89 | ) | 75 | 109 | 233 | ||||||||||||||
| Market appreciation/(depreciation) | 336 | (271 | ) | (111 | ) | 65 | 191 | |||||||||||||
| End of period assets | $ | 2,087 | $ | 1,553 | $ | 838 | $ | 2,087 | $ | 838 | ||||||||||
| Average assets during the period | $ | 1,800 | $ | 1,900 | $ | 856 | $ | 1,850 | $ | 735 | ||||||||||
| Alternatives | ||||||||||||||||||||
| Beginning of period assets | $ | 593 | $ | 510 | $ | 404 | $ | 510 | $ | 377 | ||||||||||
| Inflows | 191 | 100 | 15 | 291 | 19 | |||||||||||||||
| Market appreciation/(depreciation) | 30 | (17 | ) | (4 | ) | 13 | 19 | |||||||||||||
| End of period assets | $ | 814 | $ | 593 | $ | 415 | $ | 814 | $ | 415 | ||||||||||
| Average assets during the period | $ | 665 | $ | 554 | $ | 408 | $ | 610 | $ | 400 | ||||||||||
| Headcount: | 321 | 315 | 304 | 321 | 304 | |||||||||||||||
Note: Previously issued statistics may be restated due to fund closures and trade adjustments.
Source: WisdomTree
_____________________________
(1) Includes 17 digital assets products, which were launched prior to January 1, 2025.
| 39 |
Three Months Ended June 30, 2025 Compared to Three Months Ended June 30, 2024
Selected Operating and Financial Information
| Three Months Ended June 30, |
Change | Percent Change | ||||||||||||||
| 2025 | 2024 | |||||||||||||||
| AUM (in millions) | ||||||||||||||||
| Average AUM | $ | 119,185 | $ | 108,479 | $ | 10,706 | 9.9% | |||||||||
| Operating Revenues (in thousands) | ||||||||||||||||
| Advisory fees | $ | 103,241 | $ | 98,938 | $ | 4,303 | 4.3% | |||||||||
| Other revenues | 9,380 | 8,096 | 1,284 | 15.9% | ||||||||||||
| Total operating revenues | $ | 112,621 | $ | 107,034 | $ | 5,587 | 5.2% | |||||||||
Operating Revenues
Advisory fees
Advisory fee revenues increased 4.3% from $98.9 million during the three months ended June 30, 2024 to $103.2 million in the comparable period in 2025 due to higher average AUM, partly offset by a lower average advisory fee. Our average advisory fee was 0.37% during the three months ended June 30, 2024 and 0.35% during the three months ended June 30, 2025.
Other revenues
Other revenues increased 15.9% from $8.1 million during the three months ended June 30, 2024 to $9.4 million in the comparable period in 2025 due to higher other revenues attributable to our European listed ETPs.
Operating Expenses
| Three Months Ended June 30, | Change | Percent Change | ||||||||||||||
| (in thousands) | 2025 | 2024 | ||||||||||||||
| Compensation and benefits | $ | 32,827 | $ | 30,790 | $ | 2,037 | 6.6 | % | ||||||||
| Fund management and administration | 21,252 | 20,139 | 1,113 | 5.5 | % | |||||||||||
| Marketing and advertising | 5,330 | 5,110 | 220 | 4.3 | % | |||||||||||
| Sales and business development | 4,232 | 3,640 | 592 | 16.3 | % | |||||||||||
| Professional fees | 3,177 | 6,594 | (3,417 | ) | (51.8 | %) | ||||||||||
| Occupancy, communications and equipment | 1,559 | 1,314 | 245 | 18.6 | % | |||||||||||
| Depreciation and amortization | 580 | 418 | 162 | 38.8 | % | |||||||||||
| Third-party distribution fees | 4,083 | 2,687 | 1,396 | 52.0 | % | |||||||||||
| Acquisition-related costs | 1,967 | — | 1,967 | n/a | ||||||||||||
| Other | 2,982 | 2,831 | 151 | 5.3 | % | |||||||||||
| Total operating expenses | $ | 77,989 | $ | 73,523 | $ | 4,466 | 6.1 | % | ||||||||
| Three Months Ended June 30, | ||||||||
| As a Percent of Revenues: | 2025 | 2024 | ||||||
| Compensation and benefits | 29.2% | 28.8% | ||||||
| Fund management and administration | 18.9% | 18.8% | ||||||
| Marketing and advertising | 4.7% | 4.8% | ||||||
| Sales and business development | 3.8% | 3.4% | ||||||
| Professional fees | 2.8% | 6.2% | ||||||
| Occupancy, communications and equipment | 1.4% | 1.2% | ||||||
| Depreciation and amortization | 0.5% | 0.4% | ||||||
| Third-party distribution fees | 3.6% | 2.5% | ||||||
| Acquisition-related costs | 1.7% | 0.0% | ||||||
| Other | 2.6% | 2.6% | ||||||
| Total operating expenses | 69.2% | 68.7% | ||||||
| 40 |
Compensation and benefits
Compensation and benefits expense increased 6.6% from $30.8 million during the three months ended June 30, 2024 to $32.8 million in the comparable period in 2025 due to increased headcount. Headcount was 304 and 321 at June 30, 2024 and 2025, respectively.
Fund management and administration
Fund management and administration expense increased 5.5% from $20.1 million during the three months ended June 30, 2024 to $21.3 million in the comparable period in 2025 primarily due to higher average AUM. We had 78 U.S. listed ETFs and 272 European listed ETPs at June 30, 2024 compared to 81 U.S. listed ETFs, 285 European listed ETPs and 17 digital assets products at June 30, 2025.
Marketing and advertising
Marketing and advertising expense increased 4.3% from $5.1 million during the three months ended June 30, 2024 to $5.3 million in the comparable period in 2025 primarily due to higher spend related to our U.S. listed ETFs.
Sales and business development
Sales and business development expense increased 16.3% from $3.6 million during the three months ended June 30, 2024 to $4.2 million in the comparable period in 2025 primarily due to increases in travel and events spending.
Professional fees
Professional fees expense decreased 51.8% from $6.6 million during the three months ended June 30, 2024 to $3.2 million in the comparable period in 2025 as the prior period included expenses incurred in response to an activist campaign and in connection with a settlement with the SEC regarding certain statements about the ESG screening process for three ETFs advised by WisdomTree Asset Management, Inc. (the “SEC ESG Settlement”).
Occupancy, communications and equipment
Occupancy, communications and equipment expense increased 18.6% from $1.3 million during the three months ended June 30, 2024 to $1.6 million in the comparable period in 2025 primarily due to higher internet and communications expenses.
Depreciation and amortization
Depreciation and amortization expense increased 38.8% from $0.4 million during the three months ended June 30, 2024 to $0.6 million in the comparable period in 2025 primarily due to higher amortization of capitalized software.
Third-party distribution fees
Third-party distribution fees increased 52.0% from $2.7 million during the three months ended June 30, 2024 to $4.1 million in the comparable period in 2025 due to our strong organic growth and AUM expansion across our distribution platforms.
Acquisition-related Costs
During the three months ended June 30, 2025, we recorded $2.0 million of acquisition-related costs, comprised of professional fees related to the Ceres Acquisition.
Other
Other expenses were essentially unchanged from the three months ended June 30, 2024.
| 41 |
Other Income/(Expenses)
| Three Months Ended June 30, | Change | Percent Change | ||||||||||||||
| (in thousands) | 2025 | 2024 | ||||||||||||||
| Interest expense | $ | (5,490 | ) | $ | (4,140 | ) | $ | (1,350 | ) | 32.6% | ||||||
| Interest income | 2,090 | 1,438 | 652 | 45.3% | ||||||||||||
| Other gains and losses, net | 638 | (1,283 | ) | 1,921 | n/a | |||||||||||
| Total other expenses, net | $ | (2,762 | ) | $ | (3,985 | ) | $ | 1,223 | (30.7% | ) | ||||||
Three Months Ended | ||||||||||||||||
| As a Percent of Revenues: | 2025 | 2024 | ||||||||||||||
| Interest expense | (5.0% | ) | (3.8% | ) | ||||||||||||
| Interest income | 1.9% | 1.3% | ||||||||||||||
| Other gains and losses, net | 0.6% | (1.2% | ) | |||||||||||||
| Total other expenses, net | (2.5% | ) | (3.7% | ) | ||||||||||||
Interest expense
Interest expense increased 32.6% from $4.1 million during the three months ended June 30, 2024 to $5.5 million in the comparable period in 2025 due to a higher level of debt outstanding, partly offset by a lower average interest rate. Our effective interest rate during the three months ended June 30, 2024 and 2025 was 5.0% and 3.9%, respectively.
Interest income
Interest income increased 45.3% from $1.4 million during the three months ended June 30, 2024 to $2.1 million in the comparable period in 2025 due to a higher level of interest-earning assets.
Other gains and losses, net
Other gains and losses, net were ($1.3) million and $0.6 million during the three months ended June 30, 2024 and 2025, respectively. The three months ended June 30, 2025 includes net gains of $1.3 million on our financial instruments owned and net gains of $0.6 million on our investments. These items were partly offset by $1.4 million of foreign currency remeasurement losses on U.S. dollars held by foreign subsidiaries. Gains and losses also generally arise from the sale of gold earned from management fees paid by our physically-backed gold ETPs, foreign exchange fluctuations and other miscellaneous items.
Income Taxes
Our effective income tax rate during the three months ended June 30, 2025 was 22.3%, resulting in income tax expense of $7.1 million. The effective tax rate differs from the federal statutory rate of 21.0% primarily due to state and local income taxes, partly offset by a lower tax rate on foreign earnings.
Our effective income tax rate during the three months ended June 30, 2024 was 26.3%, resulting in income tax expense of $7.8 million. The effective tax rate differs from the federal statutory rate of 21.0% primarily due to non-deductible executive compensation, an increase in the deferred tax asset valuation allowance on losses recognized on our investments and state and local income taxes. These items were partly offset by a lower tax rate on foreign earnings.
Six Months Ended June 30, 2025 Compared to Six Months Ended June 30, 2024
Selected Operating and Financial Information
| Six Months Ended June 30, | Change | Percent
Change | ||||||||||||||
2025 | 2024 | |||||||||||||||
| AUM (in millions) | ||||||||||||||||
| Average AUM | $ | 116,904 | $ | 105,470 | $ | 11,434 | 10.8% | |||||||||
| Operating Revenues (in thousands) | ||||||||||||||||
| Advisory fees | $ | 202,790 | $ | 191,439 | $ | 11,351 | 5.9% | |||||||||
| Other revenues | 17,913 | 12,433 | 5,480 | 44.1% | ||||||||||||
| Total revenues | $ | 220,703 | $ | 203,872 | $ | 16,831 | 8.3% | |||||||||
| 42 |
Operating Revenues
Advisory fees
Advisory fee revenues increased 5.9% from $191.4 million during the six months ended June 30, 2024 to $202.8 million in the comparable period in 2025 primarily due to higher average AUM, partly offset by a lower average advisory fee. Our average advisory fee was 0.37% during the six months ended June 30, 2024 and 0.35% during the comparable period in 2025.
Other revenues
Other revenues increased 44.1% from $12.4 million during the six months ended June 30, 2024 to $17.9 million in the comparable period in 2025 due to higher other revenues attributable to our European listed products.
Operating Expenses
| Six Months Ended June 30, | Change | Percent Change | ||||||||||||||
| (in thousands) | 2025 | 2024 | ||||||||||||||
| Compensation and benefits | $ | 66,615 | $ | 61,844 | $ | 4,771 | 7.7% | |||||||||
| Fund management and administration | 41,966 | 40,101 | 1,865 | 4.7% | ||||||||||||
| Marketing and advertising | 10,143 | 9,518 | 625 | 6.6% | ||||||||||||
| Sales and business development | 8,369 | 7,251 | 1,118 | 15.4% | ||||||||||||
| Professional fees | 5,959 | 10,224 | (4,265 | ) | (41.7% | ) | ||||||||||
| Occupancy, communications and equipment | 3,041 | 2,524 | 517 | 20.5% | ||||||||||||
| Depreciation and amortization | 1,120 | 801 | 319 | 39.8% | ||||||||||||
| Third-party distribution fees | 7,195 | 4,994 | 2,201 | 44.1% | ||||||||||||
| Acquisition-related costs | 1,967 | — | 1,967 | 100.0% | ||||||||||||
| Other | 5,534 | 5,154 | 380 | 7.4% | ||||||||||||
| Total operating expenses | $ | 151,909 | $ | 142,411 | $ | 9,498 | 6.7% | |||||||||
| Six Months Ended June 30, | ||||||||
| As a Percent of Revenues: | 2025 | 2024 | ||||||
| Compensation and benefits | 30.1% | 30.4% | ||||||
| Fund management and administration | 19.0% | 19.7% | ||||||
| Marketing and advertising | 4.6% | 4.7% | ||||||
| Sales and business development | 3.8% | 3.6% | ||||||
| Professional fees | 2.7% | 5.0% | ||||||
| Occupancy, communications and equipment | 1.4% | 1.2% | ||||||
| Depreciation and amortization | 0.5% | 0.4% | ||||||
| Third-party distribution fees | 3.3% | 2.4% | ||||||
| Acquisition-related costs | 0.9% | 0.0% | ||||||
| Other | 2.5% | 2.5% | ||||||
| Total operating expenses | 68.8% | 69.9% | ||||||
Compensation and benefits
Compensation and benefits expense increased 7.7% from $61.8 million during the six months ended June 30, 2024 to $66.6 million in the comparable period in 2025 due to higher stock-based compensation expense and increased headcount.
Fund management and administration
Fund management and administration expense increased 4.7% from $40.1 million during the six months ended June 30, 2024 to $42.0 million in the comparable period in 2025 primarily due to higher average AUM.
Marketing and advertising
Marketing and advertising expense increased 6.6% from $9.5 million during the six months ended June 30, 2024 to $10.1 million in the comparable period in 2025 primarily due to higher spending related to our U.S. listed products.
Sales and business development
Sales and business development expense increased 15.4% from $7.3 million during the six months ended June 30, 2024 to $8.4 million in the comparable period in 2025 primarily due to increases in travel and events spending.
| 43 |
Professional fees
Professional fees decreased 41.7% from $10.2 million during the six months ended June 30, 2024 to $6.0 million in the comparable period in 2025 primarily as the prior period included expenses incurred in response to an activist campaign and in connection with the SEC ESG Settlement.
Occupancy, communications and equipment
Occupancy, communications and equipment expense increased 20.5% from $2.5 million during the three months ended June 30, 2024 to $3.0 million in the comparable period in 2025 primarily due to higher internet and communications expenses.
Depreciation and amortization
Depreciation and amortization expense increased 39.8% from $0.8 million during the six months ended June 30, 2024 to $1.1 million in the comparable period in 2025 due to amortization of software development costs.
Third-party distribution fees
Third-party distribution fees increased 44.1% from $5.0 million during the six months ended June 30, 2024 to $7.2 million in the comparable period in 2025 due to our strong organic growth and AUM expansion across our distribution platforms.
Acquisition-related Costs
During the six months ended June 30, 2025, we recorded $2.0 million of acquisition-related costs, comprised of professional fees related to the Ceres Acquisition.
Other
Other expenses were essentially unchanged from the six months ended June 30, 2024.
Other Income/(Expenses)
| Six Months Ended June 30, | Change | Percent Change | ||||||||||||||
| (in thousands) | 2025 | 2024 | ||||||||||||||
| Interest expense | $ | (10,931 | ) | $ | (8,268 | ) | $ | (2,663 | ) | 32.2% | ||||||
| Interest income | 3,987 | 2,836 | 1,151 | 40.6% | ||||||||||||
| Other gains, net | 388 | 1,309 | (921 | ) | (70.4% | ) | ||||||||||
| Total other expenses, net | $ | (6,556 | ) | $ | (4,123 | ) | $ | (2,443 | ) | 59.0% | ||||||
| Six Months Ended June 30, | ||||||||
| As a Percent of Revenues: | 2025 | 2024 | ||||||
| Interest expense | (5.0% | ) | (4.0% | ) | ||||
| Interest income | 1.8% | 1.4% | ||||||
| Other gains, net | 0.2% | 0.6% | ||||||
| Total other expenses, net | (3.0% | ) | (2.0% | ) | ||||
Interest expense
Interest expense increased 32.2% from $8.3 million during the six months ended June 30, 2024 to $10.9 million in the comparable period in 2025 due to a higher level of debt outstanding, partly offset by a lower average interest rate. Our effective interest rate during the six months ended June 30, 2024 and 2025 was 5.0% and 3.9%, respectively.
Interest income
Interest income increased 40.6% from $2.8 million during the six months ended June 30, 2024 to $4.0 million in the comparable period in 2025 due to a higher level of interest-earning assets.
Other gains, net
Other gains, net were $1.3 million and $0.4 million during the six months ended June 30, 2024 and 2025, respectively. This period includes net gains on our investments of $0.9 million, net gains on our financial instruments owned of $0.8 million and $2.4 million of foreign currency remeasurement losses on U.S. dollars held by foreign subsidiaries. Gains and losses also generally arise from the sale of gold earned on management fees paid by our physically-backed gold ETPs, foreign exchange fluctuations and other miscellaneous items.
| 44 |
Income Taxes
Our effective income tax rate for the six months ended June 30, 2025 was 20.6%, resulting in an income tax expense of $12.8 million. Our tax rate differs from the federal statutory rate of 21.0% primarily due tax windfalls associated with the vesting of stock-based compensation awards and a lower tax rate on foreign earnings. These items were partly offset by state and local income taxes.
Our effective income tax rate for the six months ended June 30, 2024 was 23.5%, resulting in an income tax expense of $13.5 million. Our tax rate differs from the federal statutory rate of 21% primarily due to non-deductible executive compensation and state and local income taxes. These items were partly offset by a lower tax rate on foreign earnings and tax windfalls associated with the vesting of stock-based compensation awards.
Non-GAAP Financial Measurements
In an effort to provide additional information regarding our results as determined by GAAP, we also disclose certain non-GAAP information which we believe provides useful and meaningful information. Our management reviews these non-GAAP financial measurements when evaluating our financial performance and results of operations; therefore, we believe it is useful to provide information with respect to these non-GAAP measurements so as to share this perspective of management. Non-GAAP measurements do not have any standardized meaning, do not replace nor are they superior to GAAP financial measurements and are unlikely to be comparable to similar measures presented by other companies. These non-GAAP financial measurements should be considered in the context with our GAAP results. The non-GAAP financial measurements contained in this Report include:
Adjusted Net Income and Diluted Earnings per Share
We disclose adjusted net income and diluted earnings per share as non-GAAP financial measurements in order to report our results exclusive of items that are non-recurring or not core to our operating business. We believe presenting these non-GAAP financial measurements provides investors with a consistent way to analyze our performance. These non-GAAP financial measurements exclude the following:
| ● | Gains or losses on financial instruments owned: We account for our financial instruments owned as trading securities, which requires these instruments to be measured at fair value with gains and losses reported in net income. We exclude these items when calculating our non-GAAP financial measurements as the gains and losses introduce earnings volatility and are not core to our operating business. |
| ● | Foreign currency remeasurement gains and losses on U.S. dollars held by foreign subsidiaries: U.S. GAAP requires account balances to be remeasured into an entity’s functional currency, with resulting gains and losses reported in net income. Foreign subsidiaries holding U.S. dollars remeasure these balances into their functional currencies and recognize the gains and losses. Beginning in the second quarter of 2025, we began excluding these remeasurement effects from our non-GAAP financial measures, as they introduce earnings volatility, are not core to our operations and arise from balances denominated in our reporting currency. |
| ● | Tax windfalls and shortfalls upon vesting of stock-based compensation awards: GAAP requires the recognition of tax windfalls and shortfalls within income tax expense. These items arise upon the vesting of stock-based compensation awards and the magnitude is directly correlated to the number of awards vesting/exercised, as well as the difference between the price of our stock on the date the award was granted and the date the award vested or was exercised. We exclude these items when calculating our non-GAAP financial measurements as they introduce earnings volatility and are not core to our operating business. |
| ● | Imputed interest on our payable to GBH: During the fourth quarter of 2023, we repurchased our Series C Preferred Stock, which was convertible into approximately 13.1 million shares of our common stock, from GBH for aggregate cash consideration of approximately $84.4 million. Under the terms of the transaction, we paid GBH $40.0 million on the closing date, with the remainder of the purchase price payable in equal annual installments on the first, second and third anniversaries of the closing date, with no requirement to pay interest. Under U.S. GAAP, the obligation is recorded at its present value utilizing a market rate of interest on the closing date of 7.0% and the corresponding discount is amortized as interest expense pursuant to the effective interest method of accounting over the life of the obligation. We exclude this item when calculating our non-GAAP financial measurements as recognition of interest expense is non-cash and contrary to the stated terms of our obligation. |
| ● | Other items: Acquisition-related costs, losses on extinguishment of convertible notes, a civil money penalty in connection with the SEC ESG Settlement, gains and losses recognized on our investments, changes in deferred tax asset valuation allowance and expenses incurred in response to an activist campaign are excluded when calculating our non-GAAP financial measurements. We also offset revenues and related expenses pertaining to legal and other related expenses covered by insurance as the gross presentation required under U.S. GAAP serves to overstate our revenues and expenses in the ordinary course of business. |
| 45 |
| Three Months Ended | Six Months Ended | |||||||||||||||
| Adjusted Net Income and Diluted Earnings per Share: | June 30, 2025 | June 30, 2024 | June 30, 2025 | June 30, 2024 | ||||||||||||
| Net income, as reported | $ | 24,777 | $ | 21,759 | $ | 49,406 | $ | 43,870 | ||||||||
| Add back: Acquisition-related costs, net of income taxes | 1,489 | — | 1,489 | — | ||||||||||||
| Add back: Foreign currency remeasurement losses on U.S. dollar balances, net of income taxes | 1,136 | — | 1,136 | — | ||||||||||||
| (Deduct)/add back: (Gains)/losses on financial instruments owned, net of income taxes | (972 | ) | 220 | (639 | ) | (1,342 | ) | |||||||||
| (Deduct)/add back: (Decrease)/increase in deferred tax asset valuation allowance on financial instruments owned and investments | (459 | ) | 391 | (429 | ) | (140 | ) | |||||||||
| (Deduct)/add back: (Gains)/losses recognized on investments, net of income taxes | (458 | ) | 998 | (697 | ) | 905 | ||||||||||
| Add back: Imputed interest on payable to GBH, net of income taxes | 354 | 513 | 698 | 1,017 | ||||||||||||
| Deduct: Tax windfalls upon vesting of stock-based compensation awards | (4 | ) | (40 | ) | (2,087 | ) | (739 | ) | ||||||||
| Add back: Expenses incurred in response to an activist campaign, net of income taxes | — | 3,234 | — | 3,760 | ||||||||||||
| Adjusted net income | $ | 25,863 | $ | 27,075 | $ | 48,877 | $ | 47,331 | ||||||||
| Deduct: Income distributed to participating securities | — | (462 | ) | — | (924 | ) | ||||||||||
| Deduct: Undistributed income allocable to participating securities | — | (2,053 | ) | (23 | ) | (3,506 | ) | |||||||||
| Adjusted net income available to common stockholders | $ | 25,863 | $ | 24,560 | $ | 48,854 | $ | 42,901 | ||||||||
| Weighted average diluted shares, excluding participating securities (in thousands) (See Note 16 to our Consolidated Financial Statements) | 146,640 | 151,208 | 146,431 | 150,642 | ||||||||||||
| Adjusted earnings per share – diluted | $ | 0.18 | $ | 0.16 | $ | 0.33 | $ | 0.28 | ||||||||
Liquidity and Capital Resources
The following table summarizes key data regarding our liquidity, capital resources and use of capital to fund our operations:
| Balance Sheet Data (in thousands): | June 30, 2025 | December 31, 2024 | ||||||
| Cash, cash equivalents and restricted cash | $ | 193,673 | $ | 181,191 | ||||
| Financial instruments owned, at fair value | 97,749 | 85,439 | ||||||
| Accounts receivable | 43,070 | 44,866 | ||||||
| Total: Liquid assets | 334,492 | 311,496 | ||||||
| Less: Total current liabilities | (243,853 | ) | (109,197 | ) | ||||
| Less: Other assets—seed capital (WisdomTree Digital Funds) | (21,859 | ) | (20,866 | ) | ||||
| Less: Regulatory capital requirements | (37,407 | ) | (39,423 | ) | ||||
| Total: Available liquidity | $ | 31,373 | $ | 142,216 | ||||
| Six Months Ended June 30, | ||||||||
2025 | 2024 | |||||||
| Cash Flow Data (in thousands): | ||||||||
| Operating cash flows | $ | 45,176 | $ | 31,172 | ||||
| Investing cash flows | (16,712 | ) | (9,699 | ) | ||||
| Financing cash flows | (23,505 | ) | (17,693 | ) | ||||
| Foreign exchange rate effect | 7,523 | (626 | ) | |||||
| Increase in cash, cash equivalents and restricted cash | $ | 12,482 | $ | 3,154 | ||||
Liquidity
We consider our available liquidity to be our liquid assets, less our current liabilities, seed capital in WisdomTree Digital Funds and regulatory capital requirements of certain of our subsidiaries. Liquid assets consist of cash, cash equivalents and restricted cash, financial instruments owned, at fair value, accounts receivable and securities held-to-maturity. Our financial instruments owned, at fair value are highly liquid investments. Accounts receivable are current assets and primarily represent receivables from advisory fees we earn from our ETPs. Our current liabilities consist primarily of payments owed to vendors and third parties in the normal course of business and accrued incentive compensation for employees.
| 46 |
Cash, cash equivalents and restricted cash increased by $12.5 million during the six months ended June 30, 2025 due to $45.2 million provided from operating activities, $7.5 million increase in cash flow due to changes in foreign exchange rates and $4.5 million of proceeds from the sale of financial instruments owned, at fair value. These increases were partly offset by $15.8 million used to purchase financial instruments owned, at fair value, $12.7 million used to repurchase our common stock, $8.9 million used to pay dividends, $4.0 million used to purchase investments, $1.9 million of excise tax paid on common stock repurchased, $1.3 million used to pay for software development and $0.1 million from other activities.
Cash, cash equivalents and restricted cash increased by $3.2 million during the six months ended June 30, 2024 due to $14.2 million used to purchase financial instruments owned, at fair value, $9.9 million used to pay dividends, $7.8 million used to repurchase our common stock, $1.2 million used to pay for software development and $0.7 million used for other activities. These decreases were partly offset by $31.2 million provided by operating activities, $5.3 million of proceeds from the sale of financial instruments owned, at fair value, and $0.5 million of proceeds from the exit from our investment in Securrency, Inc.
Convertible Notes
We have the following convertible notes outstanding as of June 30, 2025:
| ● | $150.0 million in aggregate principal amount of 3.25% Convertible Senior Notes due 2026 (the “2026 Notes”); |
| ● | $25.8 million in aggregate principal amount of 5.75% Convertible Senior Notes due 2028 (the “2028 Notes”); and |
| ● | $345.0 million in aggregate principal amount of 3.25% Convertible Senior Notes due 2029 (the “2029 Notes”). |
Each class of notes were issued pursuant to indentures dated as of the issuance dates between us and U.S. Bank Trust Company, National Association, as trustee (either initially or as successor to U.S. Bank National Association, the “Trustee”), in private offerings to qualified institutional buyers pursuant to Rule 144A under the Securities Act of 1933, as amended.
As of June 30, 2025, we had an aggregate principal amount of $520.8 million outstanding of the 2026 Notes, the 2028 Notes and the 2029 Notes (collectively, the “Convertible Notes”).
Key terms of the Convertible Notes are as follows:
| 2026 Notes | 2028 Notes | 2029 Notes | ||||
| Principal outstanding | $150.0 | $25.8 | $345.0 | |||
| Issuance date | June 14, 2021 | February 14, 2023 | August 13, 2024 | |||
| Maturity date (unless earlier converted, repurchased or redeemed) | June 15, 2026 | August 15, 2028 | August 15, 2029 | |||
| Interest rate | 3.25% | 5.75% | 3.25% | |||
| Initial conversion price | $11.04 | $9.54 | $11.82 | |||
| Initial conversion rate | 90.5797 | 104.8658 | 84.5934 | |||
| Redemption price | $14.35 | $12.40 | $15.37 |
| ● | Interest rate: Payable semiannually in arrears on February 15 and August 15 of each year for the 2029 Notes and the 2028 Notes and on June 15 and December 15 of each year for the 2026 Notes. |
| ● | Conversion price: Convertible at an initial conversion rate into shares of our common stock, per $1,000 principal amount of notes (equivalent to an initial conversion price set forth in the table above), subject to adjustment. |
| ● | Conversion: Holders may convert at their option at any time prior to the close of business on the business day immediately preceding May 15, 2029 and May 15, 2028 for the 2029 Notes and the 2028 Notes, respectively, and March 15, 2026 for the 2026 Notes, only under the following circumstances: (i) if the last reported sale price of our common stock for at least 20 trading days during a period of 30 consecutive trading days ending on the last trading day of the immediately preceding calendar quarter is greater than or equal to 130% of the conversion price for the respective Convertible Notes on each applicable trading day; (ii) during the five business day period after any ten consecutive trading day period (the “measurement period”) in which the trading price per $1,000 principal amount of the Convertible Notes for each trading day of the measurement period was less than 98% of the product of the last reported sales price of our common stock and the conversion rate on each such trading day; (iii) upon a notice of redemption delivered by us in accordance with the terms of the indentures but only with respect to the Convertible Notes called (or deemed called) for redemption; or (iv) upon the occurrence of specified corporate events. On or after May 15, 2029 and May 15, 2028 in respect of the 2029 Notes and the 2028 Notes, respectively, and March 15, 2026 in respect of the 2026 Notes, until the close of business on the second scheduled trading day immediately preceding the maturity date, holders may convert their Convertible Notes at any time, regardless of the foregoing circumstances. |
| ● | Cash settlement of principal amount: Upon conversion, we will pay cash up to the aggregate principal amount of the Convertible Notes to be converted. At our election, we will also settle the conversion obligation in excess of the aggregate principal amount of the Convertible Notes being converted in either cash, shares of our common stock or a combination of cash and shares of common stock. |
| 47 |
| ● | Redemption price: We may redeem for cash all or any portion of the Convertible Notes, at our option, on or after August 20, 2026 and August 20, 2025 in respect of the 2029 Notes and the 2028 Notes, respectively, and June 20, 2023 in respect of the 2026 Notes and on or prior to the 55th scheduled trading day immediately preceding the maturity date, if the last reported sale price of our common stock has been at least 130% of the conversion price for the respective Convertible Notes then in effect for at least 20 trading days, including the trading day immediately preceding the date on which we provide notice of redemption, during any 30 consecutive trading day period ending on, and including, the trading day immediately preceding the date on which we provide notice of redemption, at a redemption price equal to 100% of the principal amount of the notes to be redeemed, plus accrued and unpaid interest to, but excluding the redemption date. No sinking fund is provided for the Convertible Notes. |
| ● | Limited investor put rights: Holders of the Convertible Notes have the right to require us to repurchase for cash all or a portion of their notes at 100% of their principal amount, plus any accrued and unpaid interest, upon the occurrence of certain change of control transactions or liquidation, dissolution or common stock delisting events. |
| ● | Conversion rate increase in certain customary circumstances: In certain circumstances, conversions in connection with a “make-whole fundamental change” (as defined in the indentures) or conversions of Convertible Notes called (or deemed called) for redemption may result in an increase to the conversion rate, provided that the conversion rate will not exceed 103.6269 shares, 167.7853 shares and 144.9275 shares of our common stock per $1,000 principal amount of the 2029 Notes, the 2028 Notes and the 2026 Notes, respectively (the equivalent of 61,826,817 shares of our common stock based on the aggregate principal amount of Convertible Notes outstanding), subject to adjustment. |
| ● | Seniority and Security: The Convertible Notes rank equal in right of payment and are our senior unsecured obligations. |
The indentures contain customary terms and covenants, including that upon certain events of default occurring and continuing, either the Trustee or the respective holders of not less than 25% in aggregate principal amount of the respective series of Convertible Notes outstanding may declare the entire principal amount of all such respective Convertible Notes to be repurchased, plus any accrued special interest, if any, to be immediately due and payable.
Capital Resources
Our principal source of financing is our operating cash flow. We believe that current cash flows generated by our operating activities and existing cash balances should be sufficient for us to fund our operations for the foreseeable future.
Our ability to satisfy our contractual obligations as they arise are discussed in the section titled “Contractual Obligations” below.
Use of Capital
Our business does not require us to maintain a significant cash position. However, certain of our subsidiaries are required to maintain a minimum level of regulatory capital, which at June 30, 2025 was approximately $37.4 million in the aggregate. Notwithstanding these regulatory capital requirements, we expect that our main uses of cash will be to fund the ongoing operations of our business. We also maintain a capital return program which includes a $0.03 per share quarterly cash dividend and authority to purchase our common stock through April 27, 2028, including purchases to offset future equity grants made under our equity plans and purchases made in open market or privately negotiated transactions.
During the six months ended June 30, 2025, we repurchased 1,282,498 shares of our common stock under the repurchase program for an aggregate cost of $12.7 million. Currently, approximately $150.0 million remains under this program for future purchases.
Contractual Obligations
Convertible Notes
We currently have $520.8 million in aggregate principal amount of Convertible Notes outstanding, of which $150.0 million, $25.8 million and $345.0 million are scheduled to mature on June 15, 2026, August 15, 2028 and August 15, 2029, in respect of the 2026 Notes, the 2028 Notes and the 2029 Notes, respectively, unless earlier converted, repurchased or redeemed. Conditional conversions or a requirement to repurchase the Convertible Notes upon the occurrence of a fundamental change may accelerate payment.
The Convertible Notes require cash settlement of up to the principal amount, while settlement of the conversion obligation in excess of the aggregate principal amount may be satisfied in either cash, shares of our common stock or a combination of cash and shares of our common stock. We may settle and/or refinance these obligations when due.
See the section titled “Convertible Notes” above for additional information.
| 48 |
Payable to GBH
On November 20, 2023, we repurchased our Series C Preferred Stock from GBH for aggregate cash consideration of approximately $84.4 million. Under the terms of the transaction, we have paid GBH $54.8 million to date, with the remainder of the purchase price payable in equal, interest-free installments on the second and third anniversaries of the closing date. The implied price per share was $6.02 when considering the interest-free financing element of the transaction.
Operating Leases
Total future minimum lease payments with respect to our operating lease liabilities were $2.1 million at June 30, 2025. Cash flows generated by our operating activities and existing cash balances should be sufficient to satisfy the future minimum lease payments. See Note 10 to our Consolidated Financial Statements for additional information.
Off-Balance Sheet Arrangements
We do not have any off-balance sheet financing or other arrangements and have neither created nor are party to any special-purpose or off-balance sheet entities for the purpose of raising capital, incurring debt or operating our business.
Critical Accounting Policies and Estimates
Goodwill and Intangible Assets
Goodwill is the excess of the purchase price over the fair values of the identifiable net assets at the acquisition date. We test goodwill for impairment at least annually and at the time of a triggering event requiring re-evaluation, if one were to occur. Goodwill is considered impaired when the estimated fair value of the reporting unit that was allocated the goodwill is less than its carrying value. If the estimated fair value of such reporting unit is less than its carrying value, goodwill impairment is recognized based on that difference, not to exceed the carrying amount of goodwill. A reporting unit is an operating segment or a component of an operating segment provided that the component constitutes a business for which discrete financial information is available and management regularly reviews the operating results of that component.
Goodwill is allocated to our U.S. and European components. For impairment testing purposes, these components are aggregated as a single reporting unit as they fall under the same operating segment and have similar economic characteristics.
Goodwill is assessed for impairment annually on November 30th. When performing our goodwill impairment test, we consider a qualitative assessment, when appropriate, and the market approach and its market capitalization when determining the fair value of the reporting unit. The results of our most recent analysis indicated no impairment based upon a quantitative assessment.
Indefinite-lived intangible assets are tested for impairment at least annually and are reviewed for impairment whenever events or changes in circumstances indicate that the carrying amount of an asset may not be recoverable. Indefinite-lived intangible assets are impaired if their estimated fair value is less than their carrying value. We may rely on a qualitative assessment when performing our intangible asset impairment test. Otherwise, the impairment evaluation is performed at the lowest level of reasonably identifiable cash flows independent of other assets. The annual impairment testing date for our intangible assets is November 30th. The results of our most recent analysis identified no indicators of impairment to be recognized based upon a quantitative assessment (discounted cash flow analysis) which relied upon significant unobservable inputs including projected revenue growth rates of 3.0% and a weighted average cost of capital of 10.5%.
Investments
We account for equity investments that do not have a readily determinable fair value under the measurement alternative prescribed within Accounting Standards Codification Topic 321, Investments – Equity Securities, to the extent such investments are not subject to consolidation or the equity method. Under the measurement alternative, these financial instruments are carried at cost, less any impairment (assessed quarterly), plus or minus changes resulting from observable price changes in orderly transactions for an identical or similar investment of the same issuer. In addition, income is recognized when dividends are received only to the extent they are distributed from net accumulated earnings of the investee. Otherwise, such distributions are considered returns of investment and are recorded as a reduction of the cost of the investment. See Note 6 to our Consolidated Financial Statements for information.
Investments in debt instruments are accounted for at fair value, with changes in fair value reported in other income/(expenses).
Revenue Recognition
We earn a significant portion of our revenues in the form of advisory fees from our ETPs and recognize this revenue over time, as the performance obligation is satisfied. Advisory fees are based on a percentage of the ETPs’ average daily net assets. Progress is measured using the practical expedient under the output method resulting in the recognition of revenue in the amount for which we have a right to invoice.
| 49 |
Other revenues are earned from swap providers associated with certain of our European listed ETPs, the nature of which are based on a percentage of the ETPs’ average daily net assets. We also earn transaction-based income on flows associated with certain European listed ETPs. There is no significant judgment in calculating amounts due, which are invoiced monthly or quarterly in arrears and are not subject to any potential reversal. Progress is measured using the practical expedient under the output method resulting in the recognition of revenue in the amount for which we have a right to invoice.
| ITEM 3. | QUANTITATIVE AND QUALITATIVE DISCLOSURES ABOUT MARKET RISK |
The following information, together with information included in other parts of this Management’s Discussion and Analysis of Financial Condition and Results of Operations, describes key aspects of our market risk.
Market Risk
Market risk to us generally represents the risk of changes in the value of our ETPs and Digital Funds that results from fluctuations in securities or commodity prices, foreign currency exchange rates against the U.S. dollar, and interest rates. Nearly all our revenues are derived from advisory agreements for the WisdomTree ETPs. Under these agreements, the advisory fee we receive is based on the average market value of the assets in the WisdomTree ETP portfolios we manage.
Fluctuations in the value of the ETPs are common and are generated by numerous factors such as market volatility, the global economy, inflation, changes in investor strategies and sentiment, availability of alternative investment vehicles, domestic and foreign government regulations, emerging markets developments and others. Accordingly, changes in any one or a combination of these factors may reduce the value of investment securities and, in turn, the underlying AUM on which our revenues are earned. These declines may cause investors to withdraw funds from our ETPs in favor of investments that they perceive as offering greater opportunity or lower risk, thereby compounding the impact on our revenues. We believe challenging and volatile market conditions will continue to be present in the foreseeable future.
Interest Rate Risk
We invest our corporate cash in short-term interest-earning assets, primarily in federal agency debt instruments, WisdomTree fixed income ETFs, U.S. treasuries, corporate bonds, money market instruments at a commercial bank and other securities which totaled $134.0 million and $212.0 million as of December 31, 2024 and June 30, 2025, respectively. During the three months ended June 30, 2025, we recognized gains on these financial instruments of $1.3 million and any gains/losses recognized in the future may be material to our operating results. We do not anticipate that changes in interest rates will have a material impact on our financial condition or cash flows.
In addition, our Convertible Notes bear interest at fixed rates of 3.25% for the 2026 Notes and the 2029 Notes and 5.75% for the 2028 Notes, respectively. Therefore, we have no direct financial statement risk associated with changes in interest rates. However, the fair value of the Convertible Notes changes primarily when the market price of our common stock fluctuates or interest rates change.
Exchange Rate Risk
We are subject to currency translation exposure on the results of our non-U.S. operations, primarily in the U.K. and Europe. Foreign currency translation risk is the risk that exchange rate gains or losses arise from translating foreign entities’ statements of earnings and balance sheets from functional currency to our reporting currency (the U.S. dollar) for consolidation purposes. A substantial portion of the advisory fees earned on our European listed ETPs are paid in U.S. dollars (and also paid in British pounds, euros as well as gold, other precious metals and cryptocurrency, as described below); however, expenses for corporate overhead are generally incurred in British pounds and euros. Currently, we do not enter into derivative financial instruments aimed at offsetting certain exposures in the statement of operations or the balance sheet but may seek to do so in the future.
Exchange rate risk associated with the euro is not considered to be significant.
Commodity and Cryptocurrency Price Risk
Fluctuations in the prices of commodities and cryptocurrencies that are linked to certain of our ETPs could have a material adverse effect on our AUM and revenues. In addition, a portion of the advisory fee revenues we receive on our ETPs backed by gold, other precious metals and cryptocurrencies are paid in the underlying metal or cryptocurrency. While we readily sell the gold, precious metals and cryptocurrencies that we earn under these advisory contracts, we still may maintain a position. We currently do not enter into arrangements to hedge against fluctuations in the price of these commodities and cryptocurrencies and any hedging we may undertake in the future may not be cost-effective or sufficient to hedge against this exposure.
| ITEM 4. | CONTROLS AND PROCEDURES |
Evaluation of Disclosure Controls and Procedures
As of June 30, 2025, our management, with the participation of our Chief Executive Officer and Chief Financial Officer, evaluated the effectiveness of our disclosure controls and procedures pursuant to Rule 13a-15(b) promulgated under the Exchange Act. Based upon that evaluation, our Chief Executive Officer and Chief Financial Officer concluded that, as of June 30, 2025, our disclosure controls and procedures were effective at a reasonable assurance level in ensuring that material information required to be disclosed by us in the reports that we file or submit under the Exchange Act is recorded, processed, summarized and reported within the time periods specified in the rules, regulations and forms of the SEC, including ensuring that such material information is accumulated by and communicated to our management, including our Chief Executive Officer and Chief Financial Officer, as appropriate to allow timely decisions regarding required disclosure.
| 50 |
Changes in Internal Control over Financial Reporting
During the quarter ended June 30, 2025, there were no changes in our internal control over financial reporting that have materially affected, or are reasonably likely to materially affect, our internal control over financial reporting.
PART II: OTHER INFORMATION
| ITEM 1. | LEGAL PROCEEDINGS |
We may be subject to reviews, inspections and investigations by federal regulators including, but not limited to, the SEC, Commodity Futures Trading Commission (CFTC), National Futures Association (NFA), Financial Industry Regulatory Authority (FINRA), state and foreign regulators, as well as legal proceedings arising in the ordinary course of business. See Note 11 to our Consolidated Financial Statements for additional information regarding actual and potential claims brought by investors in our WisdomTree WTI Crude Oil 3x Daily Leveraged ETP totaling approximately €23.6 million ($27.7 million), including €15.2 million ($17.9 million) of claims resolved in our favor, which have been appealed.
| ITEM 1A. | RISK FACTORS |
In addition to the updated risk factor and other information set forth below and elsewhere in this Report, you should carefully consider the information set forth in Part 1, Item 1A. “Risk Factors” in our Annual Report on Form 10-K for the fiscal year ended December 31, 2024.
Risks Related to the Acquisition of Ceres Partners, LLC
We have made certain assumptions relating to the Ceres Acquisition which may prove to be materially inaccurate, and we may fail to realize all of the anticipated benefits of the acquisition.
We have made certain assumptions relating to the Ceres Acquisition, which may prove to be materially inaccurate. Our failure to identify, or understand the magnitude of, the problems, liabilities or other challenges associated with the Ceres Acquisition could result in incorrect expectations of future results and increased risk of unanticipated or unknown issues or liabilities. Our mitigation strategies for such risks that are identified may be ineffective. These assumptions relate to numerous matters, including:
| ● | opportunities for revenue, earnings and growth in the short- and long-term that may be realized by acquiring Ceres and entering the private asset markets; |
| ● | rates of growth in revenue, earnings, margin and AUM; |
| ● | demand for and performance of private investments, particularly in real estate and farmland; |
| ● | opportunities in strategic adjacencies in demand for solar energy, AI data infrastructure and water; |
| ● | Ceres’ ability to raise additional capital into Ceres’ funds; |
| ● | general economic and business conditions, and the performance of the Ceres business against this backdrop; |
| ● | potential unknown liabilities and unforeseen delays or regulatory conditions associated with the Ceres Acquisition; |
| ● | faulty assumptions or incorrect expectations regarding the process of integrating the Ceres business with ours, including unanticipated delays, costs or inefficiencies; |
| ● | the anticipated benefits and synergies, including timing for when such benefits and synergies may be realized through combining the Ceres business with ours; |
| ● | the amount of attention and resources needed to successfully align our and Ceres’ business practices and operations, which may disrupt our business; |
| ● | the complexities associated with managing the combined businesses; and |
| ● | other financial and strategic risks of the Ceres Acquisition. |
| 51 |
We cannot guarantee that we will achieve our goals or meet our expectations with respect to the Ceres Acquisition. The full benefits of the Ceres Acquisition, including the anticipated financial benefits and the synergies and growth opportunities, may not be realized as expected or may not be achieved within the anticipated timeframe, or at all. Such benefits may not be fully realized for various reasons, including, among others, changes in the assumptions described above.
In addition, we caution you not to place undue reliance on our current expectations regarding the financial impact of the Ceres Acquisition because they are based solely on information provided to us by Ceres in the due diligence process and our internal estimates, which are based on numerous factors, including specifically identified financial benefits and growth avenues. Our experience integrating and operating Ceres may change our expectations with respect to the financial impact of the Ceres Acquisition. In addition, the financial impact of the Ceres Acquisition may differ from our expectations based on numerous other factors, including our failure to fully realize the expected financial benefits as described in the risk factors set forth in this Report. We can provide no assurance that the actual financial impact of the Ceres Acquisition will be consistent with our current expectations.
If our assumptions are inaccurate or we are unable to meet our expectations (including our expectations regarding financial targets and growth rates), our business, financial performance and operating results could be materially and adversely affected. See “Cautionary Note Regarding Forward-Looking Statements” above.
Completion of the Ceres Acquisition is subject to conditions, and if these conditions are not satisfied or waived, the Ceres Acquisition will not be completed.
On July 31, 2025, we agreed to acquire Ceres pursuant to the Purchase Agreement. Completion of the Ceres Acquisition is subject to the satisfaction or waiver of a number of conditions in the Purchase Agreement. These conditions include, among others, obtaining regulatory approvals, required consents, and financing. In addition, completion of the Ceres Acquisition is conditioned upon (i) employment agreements with certain key employees of Ceres being in full force and effect, (ii) Ceres delivering executed consents from both Ceres, as general partner of Ceres Farms, LLC (“Ceres Farms”), and a majority of the investors in Ceres Farms, (iii) the Closing Revenue Run-Rate being no less than 85% of the Base Revenue Run-Rate (each as defined in the Purchase Agreement) and (iv) tail coverage for the insurance coverages currently in effect for the directors, managers and officers of the acquired companies being in full force and effect. Our obligation to consummate the Ceres Acquisition is further subject to the condition that, during the period between July 31, 2025 and the closing of the Ceres Acquisition, there has not been a Material Adverse Effect (as defined in the Purchase Agreement). The Purchase Agreement will terminate if the closing of the Ceres Acquisition has not occurred on or prior to December 31, 2025, subject to the parties agreeing to extend such date, as well as for material breaches not cured prior to December 31, 2025. If we terminate the Purchase Agreement, subject to certain other conditions, we will reimburse Ceres for its Eligible Expenses (as defined in the Purchase Agreement) subject to a $2.0 million cap.
The failure to satisfy all of the required conditions in the Purchase Agreement could delay the completion of the Ceres Acquisition or prevent it from occurring. Any delay in completing the Ceres Acquisition could cause us not to realize some or all of the benefits that we expect to achieve if the Ceres Acquisition is successfully completed within the expected timeframe. There can be no assurance that the conditions to the closing of the Ceres Acquisition will be satisfied or waived or that the Ceres Acquisition will be completed, or as to whether the Ceres Acquisition will be completed on terms other than those set forth in the Purchase Agreement.
Failure to complete the Ceres Acquisition could negatively affect the price of our common stock, as well as our future business and financial results.
If the Ceres Acquisition is delayed or not completed, we may be adversely affected by, among other things, the failure to pursue other beneficial opportunities during the pendency of the Ceres Acquisition, the failure to obtain the anticipated benefits of completing the Ceres Acquisition, and the focus of our management on the Ceres Acquisition rather than on normal business operations or opportunities. We may experience negative reactions from the financial markets, including negative impacts on the market price of our common stock. The manner in which industry contacts, business partners and other third parties perceive us may be negatively affected, which in turn could affect our marketing operations or our ability to compete more broadly.
Additionally, even if the Ceres Acquisition is not completed, we will be responsible for certain transaction costs associated with the Ceres Acquisition including financial advisory, legal, accounting, consulting and other advisory fees and expenses. If we terminate the Purchase Agreement, subject to certain other conditions, we will reimburse Ceres for its Eligible Expenses (as defined in the Purchase Agreement) subject to a $2.0 million cap. Any of these factors, among others, could have a material impact on our business, prospects, financial condition and results of operations.
We will incur direct and indirect costs as a result of the Ceres Acquisition.
We have incurred and expect to continue to incur a number of non-recurring costs associated with negotiating and completing the Ceres Acquisition, combining the operations of our business and the Ceres business and achieving desired synergies. Anticipated forthcoming non-recurring expenses include professional fees to be incurred in connection with completing the Ceres Acquisition and costs associated with retaining the Ceres employees. While fees and costs to date have been modest, additional unforeseen expenses related to the Ceres Acquisition and the integration of the Ceres business may arise and could ultimately have a material impact on our results of operations.
| 52 |
Completion of the Ceres Acquisition will mark our entry into the private asset markets, specifically farmland, and this may result in changes in our business. Our failure to integrate and manage Ceres successfully could materially and adversely affect our business, results of operations and financial condition.
If the Ceres Acquisition is completed, we will face numerous risks, including, among others:
| • | failure to achieve financial, operating or business objectives and synergies; |
| • | failure to integrate successfully and in a timely manner any operations, products, services or technology; |
| • | diversion of the attention of management and other personnel; |
| • | failure to raise additional capital into Ceres’ funds; |
| • | failure to integrate Ceres into our compliance and internal control systems, including regulatory compliance applicable to registered investment advisers and broker-dealers; |
| • | failure to retain personnel; |
| • | unforeseen liabilities or expenses; |
| • | failure of counterparties to indemnify us against liabilities arising from the transaction; |
| • | potential loss of, or harm to, our relationship with our and the counterparties’ employees, customers and suppliers due to the integration of a new business; |
| • | accounting charges; |
| • | assumption of the liabilities, and exposure to unforeseen liabilities, of Ceres and its subsidiaries, including liabilities subject to indemnification; |
| • | unfavorable market conditions that could negatively impact the acquired or combined businesses; and |
| • | legal proceedings which may result in expenses and/or have a material adverse effect on our business. |
We could be prevented from, or significantly delayed in, achieving our strategic goals if we are unable to successfully integrate Ceres. Integration may be more difficult, time-consuming or costly than expected. Our failure to integrate and manage Ceres successfully could materially and adversely affect our business, results of operations and financial condition.
Risks Related to the Business of Ceres Partners, LLC
Our acquisition of Ceres and entry into the private asset markets, specifically farmland, subject us to increased operational, regulatory, financial and other risks.
If the Ceres Acquisition is completed, we will face increased operational, regulatory, financial, compliance and reputational risks. The expansion of our business also may place significant demands on our existing infrastructure and employees. The failure of our compliance and internal control systems to properly mitigate such additional risks, or of our operating infrastructure to support such expansion, could result in operational failures and regulatory fines or sanctions. If our products and operations experience any negative consequences, it may harm our reputation in the markets in which we operate.
For example, upon the closing of the Ceres Acquisition, we will acquire Ceres, a registered investment adviser regulated by the SEC under the Investment Advisers Act of 1940, as amended, and Ceres Securities, LLC (“Ceres Securities”), a limited purpose broker-dealer registered with the SEC under the Securities Exchange Act of 1934, as amended, and a member of FINRA. The successful integration of Ceres and Ceres Securities into our existing compliance and internal control frameworks will require significant attention and resources. Any failure to do so in a timely and effective manner, or any failure by Ceres or Ceres Securities to maintain compliance with applicable legal and regulatory requirements, could subject Ceres and us to heightened regulatory scrutiny, including potential investigations or enforcement actions by the SEC or FINRA. Such actions could result in fines, censures, suspensions of personnel, or other sanctions, including the possible revocation of registration. These risks, if realized, could have a material adverse effect on our business, financial condition, and results of operations.
We are entering the private asset markets for the first time and may not be successful.
Acquiring Ceres, an alternative asset management firm specializing in farmland investments, will mark our entry into the private asset markets, specifically farmland. There is high competition in the private asset markets and real estate industry. There can be no assurance that we will be successful in the private assets market, that Ceres will be able to raise additional capital into Ceres’ funds, that Ceres will achieve its objectives and operate successfully, that we will have a suitable return on our investment in Ceres or that we will be able to recover the costs we have incurred in acquiring Ceres. Our management team currently does not have experience in private asset markets or farmland investments and will be largely dependent on the experience and performance of key employees of Ceres. Although we have entered into employment agreements with certain key employees of Ceres, which will become effective as of the closing of the Ceres Acquisition, there can be no assurance that such employees will continue their employment with us. Loss of key employees of Ceres could have a material adverse effect on our ability to implement our business strategy and to achieve our objectives with respect to the Ceres Acquisition.
| 53 |
Ceres’ performance is subject to risks associated with investments in direct real estate-related assets.
Ceres provides investment advisory services to, and manages, private funds, and a separate pooled investment vehicle that invests its assets in farmland real estate, Ceres Farms. Investments in direct real estate-related assets are subject to various risks, including without limitation: the cyclical nature of the real estate market and changes in national or local economic or market conditions; the financial condition of the buyers and sellers of properties; government regulation and increases in trade tariffs; changes in supply of, or demand for, properties in a geographic area; illiquidity of farmland investments; various forms of competition; fluctuations in lease rates; changes in interest rates and in the availability, cost and terms of financing; promulgation and enforcement of governmental regulations, including rules relating to zoning, land use and environmental protection; impact of third-party mineral rights ownership on properties; changes in real estate tax rates, energy prices and other operating expenses; changes in applicable laws and increased governmental regulation; and various uninsured or uninsurable risks and losses.
Ceres is subject to concentration risks arising from its concentration in real estate. Given the cyclical nature of the real estate market, changes in national or local economic or market conditions could have an adverse effect on Ceres. In addition, changes in the financial condition of tenants, buyers and sellers of property, competition, fluctuations in lease rates, the length of leases, and in the availability of financing will have a significant impact on Ceres’ performance. The geographic concentration of Ceres Farms’ properties in the U.S. Midwest makes its operations more vulnerable to local economic downturns and adverse farm-specific risks, such as adverse weather events, changes in the local climate, access to water and plant disease, than those of larger, more diversified companies.
Ceres Farms pays real estate taxes on its properties and such taxes may increase. Ceres Farms acquires real properties primarily by borrowing new funds secured by a mortgage on the purchased real estate, and incurring mortgage debt increases the risk of loss since defaults on indebtedness secured by a property may result in lenders initiating foreclosure.
Ceres’ business is dependent in part upon the profitability of Ceres Farms’ tenants’ farming operations, and a sustained downturn in the profitability of their farming operations could have a material adverse effect on the amount of rent Ceres Farms can collect and, consequently, its cash flow and net profits, and Ceres’ results of operations.
Ceres Farms depends on its tenants to operate the farms it owns in a manner that generates revenues sufficient to allow them to meet their obligations to Ceres Farms, including their obligations to pay rent, maintain certain insurance coverage and maintain the properties generally. The ability of Ceres Farms’ tenants to fulfill their obligations under their leases depends, in part, upon the overall profitability of their farming operations, which could be adversely impacted by, among other things, adverse weather conditions, crop prices, crop disease, pests and unfavorable or uncertain political, economic, business, trade or regulatory conditions. Ceres is susceptible to any decline in the profitability of Ceres Farms’ tenants’ farming operations, to the extent that it would impact the tenants’ abilities to pay rents. In addition, many farms are dependent on a limited number of key individuals whose injury or death may affect the successful operation of the farm. We can provide no assurances that, if a tenant defaults on its obligations to Ceres Farms under a lease, Ceres Farms will be able to lease or re-lease that farm on economically favorable terms in a timely manner, or at all. In addition, Ceres Farms may experience delays in enforcing its rights as landlord and may incur substantial costs in protecting its investment. As a result, any downturn in the profitability of the farming operations of Ceres Farms’ tenants, or a downturn in the farming industry as a whole, could have a material adverse effect on Ceres’ business, results of operations and financial condition.
Ceres Farms’ revenues is subject to risks associated with growing crops and the performance of the agricultural industry.
Ceres Farms’ investment strategy is to acquire and manage farmland which may also include directly managing the operations of these farms. Ceres Farms’ properties grow corn, soybeans, wheat and other primary crops, and specialty crops including seed corn and vegetables. As these crops are commodities, they are subject to wide fluctuations in price. If the value of these crops declines, it could negatively impact the level of rent that Ceres Farms can charge to tenant farmers and cause Ceres Farms to operate at a loss. In circumstances where Ceres Farms’ revenue from a farm is based on a share of crop production, in addition to risks associated with commodity price fluctuations, adverse weather conditions such as flooding or drought, or pest or plant disease problems could damage or destroy the crops and may cause Ceres Farms to operate unprofitably. The value of and revenues from farmland in which Ceres Farms invests will be largely dependent on the performance of the agricultural industry, which is historically cyclical. Crop yields can be affected by numerous factors beyond the control of Ceres Farms, including reductions in the market prices for the farmers’ products, adverse weather and growing conditions, pest and disease problems, and new government regulations regarding farming and the marketing of agricultural products.
| 54 |
Adverse changes in government policies and regulations related to farming could affect the prices of crops and the profitability of farming operations, which could materially and adversely affect the value of Ceres Farms’ properties and its results of operations.
There are a number of government policies and programs that directly or indirectly affect the profitability of farm operators. These include marketing, export, renewable fuel and insurance policies and programs. Government policies and regulations affecting the agricultural industry, such as taxes, tariffs, duties, subsidies, incentives, and import and export restrictions on agricultural commodities and commodity products, can influence the planting of certain crops, the location and size of crop production, whether unprocessed or processed commodity products are traded, the volume and types of imports and exports, the availability and competitiveness of feedstocks as raw materials, and industry profitability. Government policies and regulations may adversely affect the supply of, demand for, and prices of agricultural products. In addition, international trade disputes can adversely affect agricultural commodity trade flows by limiting or disrupting trade between countries or regions. Significant changes to or the elimination of programs and policies could adversely affect crop prices and the profitability of farming operations, including farms owned by Ceres Farms, and adversely affect its business, results of operations and financial condition.
On July 4, 2025, the One Big Beautiful Bill Act (“OBBBA”) was signed into law, enacting changes to U.S. agricultural policy, including updates to commodity support programs, crop insurance and trade promotion funding. The legislation poses risks to Ceres’ business. The OBBBA raises statutory reference prices for major commodities, including corn and soybeans, with further annual escalations beginning in 2031. These changes may incentivize increased domestic production, potentially leading to oversupply and downward pressure on market prices, particularly if global demand does not rise proportionately. The OBBBA allocates $2.2 billion toward agricultural trade promotion, which may be deemed a subsidy by international trading partners, potentially triggering retaliatory measures or disputes under World Trade Organization rules and restricting market access for U.S. corn and soybean exports. Delays or inconsistencies by federal agencies in administering new reference prices, crop insurance enhancements, or trade programs could create uncertainty for the agricultural industry. In addition, certain tax provisions of the OBBBA may adversely impact Ceres Farms’ tenant farmers who own small farms.
Federal, state and county governments have implemented laws and regulations in connection with farming operations, including those relating to taxes, trade, environmental, labor, immigration and food safety, among others. For example, labor and immigration regulations seek to provide for minimum wages and minimum and maximum work hours, as well as to restrict the hiring of illegal immigrants. If one of Ceres Farms’ tenants is accused of violating, or found to have violated such regulations, it could have a material adverse effect on the tenant’s operating results, which could adversely affect its ability to make its rental payments to Ceres Farms. Increased enforcement of federal immigration policy could adversely affect the overall farming labor market, which could result in upward pressure on wages for farm labor and adversely affect Ceres Farms’ tenants’ profitability and ability to pay rent. In addition, certain states, including Iowa, Minnesota, Wisconsin, Missouri and Kansas, in which a substantial amount of primary crop farmland is located, have laws that prohibit or restrict, to varying degrees, the ownership of agricultural land by corporations or business entities similar to Ceres Farms. Additional states may, in the future, pass similar or more restrictive laws, and Ceres Farms may not be legally permitted, or it may become overly burdensome or expensive, to acquire farms in these states, which could impede the growth of Ceres Farms’ portfolio and its ability to diversify geographically in states that might otherwise offer compelling investment opportunities.
Potential liability for environmental matters could materially and adversely affect Ceres’ business, results of operations and financial condition.
Ceres is subject to the risk of liability under federal, state and local environmental laws applicable to agricultural properties, including those related to wetlands, groundwater and water runoff. Some of these laws could subject Ceres to responsibility and liability for: the cost of removal or remediation of hazardous substances released on its properties, generally without regard to Ceres’ knowledge of or responsibility for the presence of the contaminants; the costs of investigation, removal or remediation of hazardous substances or chemical releases at disposal facilities for persons who arrange for the disposal or treatment of these substances; and claims by third parties for damages resulting from environmental contaminants. Ceres’ costs of investigation, remediation or removal of hazardous substances may be substantial. In addition, the presence of hazardous substances on one of Ceres’ properties, or the failure to properly remediate a contaminated property, could adversely affect Ceres’ ability to sell or lease the property or to borrow using the property as collateral. Ceres may be subject to common law claims by third parties based on damages and costs resulting from environmental contamination emanating from a property. Additionally, Ceres could become subject to new, stricter environmental regulations, which could diminish the utility of its properties and have a material adverse impact on its business, results of operations and financial condition. The potential of finding endangered species on or near Ceres Farms’ properties could restrict certain activities on its properties under federal, state and local laws and regulations intended to protect threatened or endangered species.
The failure of Ceres Farmland, LLC to maintain qualification as a REIT for U.S. federal income tax purposes would subject it to U.S. federal income tax on taxable income at regular corporate rates, which could adversely impact its business, results of operations and financial condition.
Ceres Farmland, LLC, a subsidiary of Ceres Farmland Holdings, LP, has elected to be taxed as a REIT for U.S. federal income tax purposes. To maintain qualification as a real estate investment trust (“REIT”), Ceres Farmland, LLC must meet various requirements set forth in the Internal Revenue Code of 1986, as amended (the “Code”) concerning, among other things, the ownership of its outstanding interests, the nature of its assets, the sources of its income and the amount of its distributions. There can be no assurance that Ceres Farmland, LLC will remain qualified as a REIT. We believe that the current organization and method of operation will enable Ceres Farmland, LLC to continue to qualify as a REIT. However, at any time, new laws, interpretations or court decisions may change the U.S. federal tax laws relating to, or the U.S. federal income tax consequences of, qualification as a REIT. Ceres Farmland, LLC’s Board of Directors may at any time, in its sole discretion, determine that it is no longer in Ceres Farmland, LLC’s best interest to qualify as a REIT. Failure of Ceres Farmland, LLC in any taxable year to qualify as a REIT will, among other things, subject Ceres Farmland, LLC’s taxable income to tax at regular corporate rates and distributions to members of Ceres Farmland, LLC in any non-qualifying years will not be deductible by Ceres Farmland, LLC. If Ceres Farmland, LLC’s status as a REIT is terminated or revoked, it may not be eligible to elect REIT status again prior to the fifth taxable year following the year in which it fails to qualify under the Code as a REIT unless certain relief provisions apply. The requirements for qualification as a REIT are extremely complex, and Ceres Farmland, LLC’s compliance with such requirements may depend on factors that are outside of its control or upon the resolution of legal issues for which guidance is lacking. Losing its REIT status would reduce its net earnings available for investment or distribution because of the additional tax liability, which could substantially reduce its ability to pay performance fees to Ceres. Even if Ceres Farmland, LLC qualifies as a REIT, it may be subject to federal income tax in certain circumstances. In addition, any taxable REIT subsidiary of Ceres Farmland, LLC will be subject to federal, state and local income taxes at the applicable corporate rates. To remain qualified as a REIT and to avoid the payment of U.S. federal income and excise taxes, Ceres Farmland, LLC may be forced to borrow funds, use proceeds from the issuance of securities, pay taxable dividends of stock or debt securities or sell assets to make distributions, which may result in Ceres Farmland, LLC distributing amounts that may otherwise be used for operations.
| 55 |
Ceres may not be successful in pursuing new business opportunities, including in solar, artificial intelligence (“AI”) data infrastructure and water rights, which could adversely affect its financial performance and strategic objectives.
Ceres continues to evaluate opportunities to grow its business, including through the acquisition and leasing of properties for solar energy generation and AI data infrastructure, and the monetization of water rights. While Ceres currently leases and enters into option agreements with respect to certain properties for solar energy development and use and may expand such arrangements, there can be no assurance that it will be able to identify, negotiate or execute additional opportunities on favorable terms or at all. Ceres’ efforts to pursue strategic adjacencies or enter new markets may be hindered by a variety of factors, including regulatory or permitting challenges, lack of demand, competition, technological or infrastructure constraints or insufficient capital investment. There can be no assurance that Ceres’ initiatives to explore new business opportunities, enter new markets or make investments or acquisitions will benefit our or its business operations, generate sufficient revenues to offset related costs, or produce the anticipated benefits of past or future investments.
| ITEM 2. | UNREGISTERED SALES OF EQUITY SECURITIES AND USE OF PROCEEDS |
Recent Sales of Unregistered Securities
None.
Use of Proceeds
Not applicable.
Purchases of Equity Securities by the Issuer and Affiliated Purchasers
The following table provides information with respect to purchases made by or on behalf of the Company or any “affiliated purchaser” of shares of our common stock.
| Total Number of Shares Purchased | Average Price Paid Per Share | Total Number of Shares Purchased as Part of Publicly Announced Plans or Programs | Approximate Dollar Value of Shares that May Yet Be Purchased Under the Plans or Programs | |||||||||||||
| Period | (in thousands) | |||||||||||||||
| April 1, 2025 to April 30, 2025 | — | $ | — | — | ||||||||||||
| May 1, 2025 to May 31, 2025 | — | $ | — | — | ||||||||||||
| June 1, 2025 to June 30, 2025 | — | $ | — | — | ||||||||||||
| Total | — | $ | — | — | $ | 149,980 | ||||||||||
On February 24, 2025, our Board of Directors approved an increase of $129.2 million to our share repurchase program, bringing the total authorization to $150.0 million, and extended the program’s term for three years through April 27, 2028. During the six months ended June 30, 2025, we repurchased 1,282,498 shares of our common stock under this program for an aggregate cost of approximately $12.7 million. As of June 30, 2025, $150.0 million remained under this program for future repurchases.
| ITEM 4. | MINE SAFETY DISCLOSURES |
Not applicable.
| ITEM 5. | OTHER INFORMATION |
10b5-1 Trading Arrangements
During the three months ended June 30, 2025,
none of our directors or officers (as defined in Rule 16a-1(f) of the Exchange Act)
| 57 |
| ITEM 6. | EXHIBITS |
EXHIBIT INDEX
| 58 |
|
Exhibit |
Description | |
| 101.SCH(1) | Inline XBRL Taxonomy Extension Schema Document | |
| 101.CAL(1) | Inline XBRL Taxonomy Extension Calculation Linkbase Document | |
| 101.DEF(1) | Inline XBRL Taxonomy Extension Definition Linkbase Document | |
| 101.LAB(1) | Inline XBRL Taxonomy Extension Labels Linkbase Document | |
| 101.PRE(1) | Inline XBRL Taxonomy Extension Presentation Linkbase Document | |
| 104(1) | Cover Page Interactive Data File (formatted as inline XBRL with applicable taxonomy extension information contained in Exhibits 101.*) |
__________________________________________________________
| (1) | Filed herewith. |
| (2) | Furnished herewith. |
| * | Pursuant to Item 601(a)(5) of Regulation S-K, certain schedules and exhibits to the Equity Purchase Agreement have been omitted from this Current Report on Form 8-K and will be furnished to the SEC supplementally upon request. |
| + | Certain confidential information contained in this document has been redacted in accordance with Item 601(b)(2)(ii) of Regulation S-K. The Company agrees to furnish supplementally an unredacted copy of the exhibit to the SEC upon request. |
| 59 |
SIGNATURE
Pursuant to the requirements of the Exchange Act, the registrant has duly caused this report to be signed on its behalf by the undersigned hereunto duly authorized on this 6th day of August 2025.
| WISDOMTREE, INC. | ||
| By: |
/s/ Jonathan Steinberg | |
| Jonathan Steinberg | ||
|
Chief Executive Officer (Principal Executive Officer) | ||
| WISDOMTREE, INC. | ||
| By: |
/s/ Bryan Edmiston | |
| Bryan Edmiston | ||
|
Chief Financial Officer (Principal Financial Officer and Principal Accounting Officer) | ||
60