Table of Contents


UNITED STATES

SECURITIES AND EXCHANGE COMMISSION

Washington, D.C. 20549


Form 10-Q


(Mark One)

QUARTERLY REPORT PURSUANT TO SECTION 13 OR 15(d) OF THE SECURITIES EXCHANGE ACT OF 1934

For the quarterly period ended September 30, 2018

or


TRANSITION REPORT PURSUANT TO SECTION 13 OR 15(d) OF THE SECURITIES EXCHANGE ACT OF 1934

For the transition period from                  to                 .

Commission File Number 001-10932


WisdomTree Investments, Inc.

(Exact name of registrant as specified in its charter)


Delaware   13-3487784

(State or other jurisdiction of

incorporation or organization)


(IRS Employer

Identification No.)


245 Park Avenue, 35th Floor

New York, New York

  10167
(Address of principal executive officers)   (Zip Code)

212-801-2080

(Registrant’s Telephone Number, Including Area Code)


Indicate by check mark whether the registrant (1) has filed all reports required to be filed by Section 13 or 15(d) of the Securities Exchange Act of 1934, as amended (the “Exchange Act”) during the preceding 12 months (or for such shorter period that the registrant was required to file such reports), and (2) has been subject to such filing requirements for the past 90 days.    Yes  ☒    No  ☐

Indicate by check mark whether the registrant has submitted electronically every Interactive Data File required to be submitted pursuant to Rule 405 of Regulation S-T (§232.405 of this chapter) during the preceding 12 months (or for such shorter period that the registrant was required to submit such files).    ☒  Yes    ☐  No

Indicate by check mark whether the registrant is a large accelerated filer, an accelerated filer, a non-accelerated filer, a smaller reporting company, or emerging growth company. See definitions of “large accelerated filer,” “accelerated filer,” “smaller reporting company” and “emerging growth company” in Rule 12b-2 of the Exchange Act.


Large accelerated filer      Accelerated filer  
Non-accelerated filer      Smaller reporting company  
     Emerging growth company  

If an emerging growth company, indicate by check mark if the registrant has elected not to use the extended transition period for complying with any new or revised financial accounting standards provided pursuant to Section 13(a) of the Exchange Act  ☐

Indicate by check mark whether the registrant is a shell company (as defined in Rule 12b-2 of the Exchange Act).    Yes  ☐    No  ☒

As of November 2, 2018, there were 153,036,126 shares of the registrant’s Common Stock, $0.01 par value per share, outstanding.


Table of Contents

WISDOMTREE INVESTMENTS, INC.

Form 10-Q

For the Quarterly Period Ended September 30, 2018

TABLE OF CONTENTS


     Page
Number
 

PART I: FINANCIAL INFORMATION

     4  

Item 1. Financial Statements

     4  

Item  2. Management’s Discussion and Analysis of Financial Condition and Results of Operations

     32  

Item 3. Quantitative and Qualitative Disclosures about Market Risk

     52  

Item 4. Controls and Procedures

     53  

PART II: OTHER INFORMATION

     53  

Item 1. Legal Proceedings

     53  

Item 1A. Risk Factors

     53  

Item 2. Unregistered Sales of Equity Securities and Use of Proceeds

     54  

Item 3. Defaults Upon Senior Securities

     54  

Item 4. Mine Safety Disclosures

     54  

Item 5. Other Information

     54  

Item 6. Exhibits

     55  


2


Table of Contents

CAUTIONARY NOTE REGARDING FORWARD-LOOKING STATEMENTS

This Quarterly Report on Form 10-Q contains forward-looking statements that are based on our management’s beliefs and assumptions and on information currently available to our management. Although we believe that the expectations reflected in these forward-looking statements are reasonable, these statements relate to future events or our future financial performance, and involve known and unknown risks, uncertainties and other factors that may cause our actual results, levels of activity, performance or achievements to be materially different from any future results, levels of activity, performance or achievements expressed or implied by these forward-looking statements.

In some cases, you can identify forward-looking statements by terminology such as “may,” “will,” “should,” “expects,” “intends,” “plans,” “anticipates,” “believes,” “estimates,” “predicts,” “potential,” “continue” or the negative of these terms or other comparable terminology. These statements are only predictions. You should not place undue reliance on forward-looking statements because they involve known and unknown risks, uncertainties and other factors, which are, in some cases, beyond our control and which could materially affect results. Factors that may cause actual results to differ materially from current expectations include, among other things, those listed in the section entitled “Risk Factors” included in our Annual Report on Form 10-K for the fiscal year ended December 31, 2017 and Quarterly Report on Form 10-Q for the quarter ended March 31, 2018. If one or more of these or other risks or uncertainties occur, or if our underlying assumptions prove to be incorrect, actual events or results may vary significantly from those implied or projected by the forward-looking statements. No forward-looking statement is a guarantee of future performance. You should read this Report and the documents that we reference in this Report and have filed with the Securities and Exchange Commission, or the SEC, as exhibits to this Report, completely and with the understanding that our actual future results may be materially different from any future results expressed or implied by these forward-looking statements.

In particular, forward-looking statements in this Report may include statements about:


anticipated trends, conditions and investor sentiment in the global markets and exchange traded products, or ETPs;


anticipated levels of inflows into and outflows out of our ETPs;


our ability to deliver favorable rates of return to investors;


our ability to develop new products and services;


our ability to maintain current vendors or find new vendors to provide services to us at favorable costs;


our ability to successfully expand our business into non-U.S. markets;


competition in our business; and


the effect of laws and regulations that apply to our business.

The forward-looking statements in this Report represent our views as of the date of this Report. We anticipate that subsequent events and developments may cause our views to change. However, while we may elect to update these forward-looking statements at some point in the future, we have no current intention of doing so except to the extent required by applicable law. Therefore, these forward-looking statements do not represent our views as of any date other than the date of this Report.


3


Table of Contents

PART I: FINANCIAL INFORMATION


ITEM 1.

FINANCIAL STATEMENTS

WisdomTree Investments, Inc. and Subsidiaries

Consolidated Balance Sheets

(In Thousands, Except Per Share Amounts)


     September 30,
2018
     December 31,
2017
 
     (Unaudited)         

Assets


Current assets:


Cash and cash equivalents

   $ 77,125      $ 54,193  

Securities owned, at fair value

     4,426        66,294  

Securities held-to-maturity

     —          1,000  

Accounts receivable

     25,528        21,309  

Income taxes receivable

     —          6,978  

Prepaid expenses

     5,505        3,550  

Other current assets

     303        1,007  


Total current assets

     112,887        154,331  

Fixed assets, net

     9,723        10,693  

Note receivable, net (Note 8)

     28,121        18,748  

Indemnification receivable (Note 20)

     35,654        —    

Securities held-to-maturity

     20,199        20,299  

Deferred tax assets, net

     2,213        1,050  

Investments, carried at cost (Note 9)

     35,187        35,187  

Goodwill (Note 22)

     85,856        1,799  

Intangible assets (Note 22)

     613,274        12,085  

Other noncurrent assets

     2,304        793  


Total assets

   $ 945,418      $ 254,985  


Liabilities and stockholders’ equity


Liabilities


Current liabilities:


Fund management and administration payable

   $ 24,383      $ 20,099  

Compensation and benefits payable

     13,728        28,053  

Deferred consideration – gold payments (Note 11)

     11,788        —    

Income taxes payable

     799        —    

Securities sold, but not yet purchased, at fair value

     2,018        950  

Accounts payable and other liabilities

     8,668        8,246  


Total current liabilities

     61,384        57,348  

Long-term debt (Note 12)

     193,999        —    

Deferred consideration – gold payments (Note 11)

     144,267        —    

Deferred rent payable

     4,462        4,686  

Other noncurrent liabilities (Note 20)

     35,654        —    


Total liabilities

     439,766        62,034  


Preferred stock – Series A Non-Voting Convertible, par value $0.01; 14.750 shares authorized, issued and outstanding (Note 13)

     132,569        —    


Commitments and Contingencies (Note 14)


Stockholders’ equity


Preferred stock, par value $0.01; 2,000 shares authorized (Note 13):

     —          —    

Common stock, par value $0.01; 250,000 shares authorized; issued and outstanding: 153,083 and 136,996 at September 30, 2018 and December 31, 2017, respectively

     1,531        1,370  

Additional paid-in capital

     361,900        216,006  

Accumulated other comprehensive income

     373        291  

Retained earnings/(Accumulated deficit)

     9,279        (24,716


Total stockholders’ equity

     373,083        192,951  


Total liabilities and stockholders’ equity

   $ 945,418      $ 254,985  


The accompanying notes are an integral part of these consolidated financial statements


4


Table of Contents

WisdomTree Investments, Inc. and Subsidiaries

Consolidated Statements of Operations

(In Thousands, Except Per Share Amounts)

(Unaudited)


     Three Months Ended
September 30,
    Nine Months Ended
September 30,
 
     2018     2017     2018     2017  

Operating Revenues:


Advisory fees

   $ 71,679     $ 57,293     $ 203,913     $ 166,177  

Other income

     891       421       2,336       1,145  


Total revenues

     72,570       57,714       206,249       167,322  


Operating Expenses:


Compensation and benefits

     17,544       19,492       55,677       55,787  

Fund management and administration

     15,292       10,862       40,825       30,574  

Marketing and advertising

     3,239       3,314       10,212       10,676  

Sales and business development

     3,801       3,617       12,117       9,968  

Contractual gold payments (Note 11)

     2,880       —         5,595       —    

Professional and consulting fees

     1,934       1,035       5,130       3,814  

Occupancy, communications and equipment

     1,722       1,378       4,659       4,102  

Depreciation and amortization

     306       353       998       1,042  

Third-party distribution fees

     1,407       710       4,798       2,312  

Acquisition-related costs (Note 3)

     456       —         10,446       —    

Other

     2,281       1,729       6,332       5,195  


Total expenses

     50,862       42,490       156,789       123,470  


Operating income

     21,708       15,224       49,460       43,852  

Other Income/(Expenses):


Interest expense

     (2,747     —         (5,103     —    

Gain on revaluation of deferred consideration – gold payments (Note 11)

     7,732       —         17,630       —    

Interest income

     719       772       2,293       1,999  

Settlement gain

     —         —         —         6,909  

Other gains and losses, net

     118       (500     (644     (217


Income before taxes

     27,530       15,496       63,636       52,543  

Income tax expense

     5,481       7,520       15,439       25,582  


Net income

   $ 22,049     $ 7,976     $ 48,197     $ 26,961  


Earnings per share—basic

   $ 0.13     $ 0.06     $ 0.31     $ 0.20  


Earnings per share—diluted

   $ 0.13     $ 0.06     $ 0.31     $ 0.20  


Weighted-average common shares—basic

     150,892       134,709       145,149       134,552  


Weighted-average common shares—diluted

     166,622       135,933       155,584       135,768  


Cash dividends declared per common share

   $ 0.03     $ 0.08     $ 0.09     $ 0.24  


The accompanying notes are an integral part of these consolidated financial statements


5


Table of Contents

WisdomTree Investments, Inc. and Subsidiaries

Consolidated Statements of Comprehensive Income

(In Thousands)

(Unaudited)


     Three Months Ended
September 30,
    Nine Months Ended
September 30,
 
     2018     2017     2018     2017  

Net income

   $ 22,049     $ 7,976     $ 48,197     $ 26,961  

Other comprehensive (loss)/income


Change in unrealized gains/(losses) on available-for-sale debt securities, net of tax

     —         (96     477       (230

Foreign currency translation adjustment

     (88     363       (395     802  


Other comprehensive (loss)/income

     (88     267       82       572  


Comprehensive income

   $ 21,961     $ 8,243     $ 48,279     $ 27,533  


The accompanying notes are an integral part of these consolidated financial statements


6


Table of Contents

WisdomTree Investments, Inc. and Subsidiaries

Consolidated Statements of Cash Flows

(In Thousands)

(Unaudited)


     Nine Months Ended
September 30,
 
     2018     2017  

Cash flows from operating activities:


Net income

   $ 48,197     $ 26,961  

Adjustments to reconcile net income to net cash provided by operating activities:


Advisory fees paid in gold and other precious metals

     (21,998     —    

Contractual gold payments (Note 11)

     5,595       —    

Gain on revaluation of deferred consideration – gold payments (Note 11)

     (17,630     —    

Stock-based compensation

     10,078       10,558  

Deferred income taxes

     (1,251     3,823  

Paid-in-kind interest income (Note 8)

     (1,373     —    

Settlement gain

     —         (6,909

Amortization of credit facility issuance costs

     1,360       —    

Depreciation and amortization

     998       1,042  

Other

     810       524  

Changes in operating assets and liabilities, net of the effects of the ETFS Acquisition:


Securities owned, at fair value

     (2,735     1,146  

Accounts receivable

     3,771       (1,969

Income taxes receivable/payable

     7,654       (628

Prepaid expenses

     (621     (361

Gold and other precious metals

     18,472       —    

Other assets

     954       (31

Acquisition payable

     —         (3,545

Fund management and administration payable

     1,998       561  

Compensation and benefits payable

     (21,025     115  

Securities sold, but not yet purchased, at fair value

     1,068       (1,249

Accounts payable and other liabilities

     (4,122     1,041  


Net cash provided by operating activities

     30,200       31,079  


Cash flows from investing activities:


Purchase of fixed assets

     (45     (253

Purchase of securities held-to-maturity

     —         (3,009

Purchase of debt securities available-for-sale

     —         (76,776

Purchase of investments

     —         (5,000

Funding of AdvisorEngine note receivable (Note 8)

     (8,000     —    

Proceeds from held-to-maturity securities maturing or called prior to maturity

     1,096       2,162  

Proceeds from sales and maturities of debt securities available-for-sale

     64,498       65,067  

Cash paid – ETFS Acquisition, net of cash acquired (Note 3)

     (239,313     —    


Net cash used in investing activities

     (181,764     (17,809


Cash flows from financing activities:


Dividends paid

     (14,202     (32,825

Shares repurchased

     (1,430     (4,178

Credit facility issuance costs

     (8,690     —    

Preferred stock issuance costs

     (181     —    

Proceeds from the issuance of long-term debt (Note 12)

     200,000       —    

Proceeds from exercise of stock options

     157       53  


Net cash provided by/(used in) financing activities

     175,654       (36,950


(Decrease)/increase in cash flow due to changes in foreign exchange rate

     (1,158     1,179  


Net increase/(decrease) in cash and cash equivalents

     22,932       (22,501

Cash and cash equivalents—beginning of period

     54,193       92,722  


Cash and cash equivalents—end of period

   $ 77,125     $ 70,221  


Supplemental disclosure of cash flow information:


Cash paid for taxes

   $ 8,759     $ 22,130  


Cash paid for interest

   $ 3,351     $ —    


Refer to Note 3 for information regarding the non-cash effects of the ETFS Acquisition, including non-cash consideration paid.

The accompanying notes are an integral part of these consolidated financial statements


7


Table of Contents

WisdomTree Investments, Inc. and Subsidiaries

Notes to Consolidated Financial Statements

(In Thousands, Except Share and Per Share Amounts)

1. Organization and Description of Business

WisdomTree Investments, Inc., through its global subsidiaries (collectively, “WisdomTree” or the “Company”), is an exchange traded product (“ETP”) sponsor and asset manager headquartered in New York. WisdomTree offers ETPs covering equity, fixed income, currencies, commodities and alternative strategies. The Company has the following wholly-owned operating subsidiaries:


WisdomTree Asset Management, Inc. is a New York based investment adviser registered with the SEC providing investment advisory and other management services to the WisdomTree Trust (“WTT”) and WisdomTree exchange traded funds (“ETFs”). The WisdomTree ETFs are issued in the U.S. by WTT. WTT, a non-consolidated third party, is a Delaware statutory trust registered with the SEC as an open-end management investment company. The Company has licensed to WTT the use of certain of its own indexes on an exclusive basis for the WisdomTree ETFs in the U.S.


ETFS Management Company (Jersey) Limited (“ManJer”) is a Jersey based management company providing investment and other management services to nine issuers (the “ETFS Issuers”) and the ETPs issued and listed by the ETFS Issuers covering commodity, currency and short-and-leveraged strategies.


Boost Management Limited (“BML”) is a Jersey based management company providing investment and other management services to Boost Issuer PLC (“BI”) and Boost ETPs. The Boost ETPs are issued by BI. BI, a non-consolidated third party, is a public limited company domiciled in Ireland.


WisdomTree Management Limited (“WML”) is an Ireland based management company providing investment and other management services to WisdomTree Issuer plc (“WTI”) and WisdomTree UCITS ETFs. The WisdomTree UCITS ETFs are issued by WTI. WTI, a non-consolidated third party, is a public limited company domiciled in Ireland.


WisdomTree UK Limited is a U.K. based company registered with the Financial Conduct Authority currently providing management and other services to ManJer, BML and WML.


WisdomTree Europe Limited is a U.K. based company registered with the Financial Conduct Authority currently providing management and other services to WisdomTree UK Limited, BML and WML.


WisdomTree Asset Management Canada, Inc. (“WTAMC”) is a Canada based investment fund manager registered with the Ontario Securities Commission providing fund management services to locally-listed WisdomTree Canadian ETFs.


WisdomTree Commodity Services, LLC (“WTCS”) is a New York based company that serves as the managing owner and commodity pool operator of the WisdomTree Continuous Commodity Index Fund. WTCS is registered with the Commodity Futures Trading Commission and is a member of the National Futures Association.


WisdomTree Ireland Limited is an Ireland based company authorized by the Central Bank of Ireland to provide distribution services. It is intended that WisdomTree Ireland Limited will provide EU distribution services to ManJer, BML and WTML post-Brexit.

Acquisition of ETFS

On April 11, 2018, the Company acquired the European exchange-traded commodity, currency and short-and-leveraged business (“ETFS”) of ETFS Capital Limited (“ETFS Capital”, formerly known as ETF Securities Limited). This acquisition is referred to throughout the consolidated financial statements as the ETFS Acquisition. See Note 3 for additional information.

Restructuring of Distribution Strategy in Japan

In July 2018, the Company determined to restructure its distribution strategy in Japan and has expanded its existing relationship with a third party to manage distribution of WisdomTree ETFs in Japan. As a result, the Company will close WisdomTree Japan Inc. (“WTJ”). During the three months ended September 30, 2018 and 2017, WTJ reported an operating loss of $1,342 and $1,085, respectively. During the nine months ended September 30, 2018 and 2017, WTJ reported an operating loss of $3,698 and $3,447, respectively.

2. Significant Accounting Policies

Basis of Presentation

These consolidated financial statements have been prepared in conformity with U.S. generally accepted accounting principles (“GAAP”) and in the opinion of management reflect all adjustments, consisting of only normal recurring adjustments, necessary for a fair statement of financial condition, results of operations, and cash flows for the periods presented. The consolidated financial statements include the accounts of the Company’s wholly owned subsidiaries. All intercompany accounts and transactions have been eliminated in consolidation.


8


Table of Contents

The financial results of ETFS are included in our consolidated financial statements since the acquisition date, April 11, 2018 (See Note 3).

Certain accounts in the prior years’ consolidated financial statements have been reclassified to conform to the current year’s consolidated financial statement presentation. The following table summarizes these reclassifications for the three and nine months ended September 30, 2017, which had no effect on previously reported net income.


Operating Revenues:    Three Months
Ended
September 30,
2017
     Nine Months
Ended
September 30,
2017
 

Advisory fees (previously reported)

   $  57,574      $  166,950  

Other ETP fees reclassified to Other income

     (281      (773


Advisory fees (currently reported)

   $ 57,293      $ 166,177  


Settlement gain (previously reported)

   $ —      $ 6,909  

Reclassify to Other Income/(Expenses)

     —          (6,909


Settlement gain (currently reported)

   $ —      $ —  


Other income (previously reported)

   $ 412      $ 2,154  

Other ETP fees reclassified from Advisory fees

     281        773  

Interest income reclassified to Other Income/(Expenses)

     (772      (1,999

Realized and unrealized losses reclassified to Other gains and losses, net

     535        1,054  

Miscellaneous other income reclassified to Other gains and losses, net

     (35      (837


Other income (currently reported)

   $ 421      $ 1,145  


Total revenues (currently reported)

   $ 57,714      $ 167,322  


Other Income/(Expenses):


Interest income reclassified from operating revenues

   $ 772      $ 1,999  


Settlement gain reclassified from operating revenues

   $ —      $ 6,909  


Other gains and losses, net (previously reported)

   $ —      $ —  

Realized and unrealized losses reclassified from operating revenues

     (535      (1,054

Miscellaneous other income reclassified from operating revenues

     35        837  


Other gains and losses, net (currently reported)

   $  (500    $  (217


Consolidation

The Company consolidates entities in which it has a controlling financial interest. The Company determines whether it has a controlling financial interest in an entity by first evaluating whether the entity is a voting interest entity (“VOE”) or a variable interest entity (“VIE”). The usual condition for a controlling financial interest in a VOE is ownership of a majority voting interest. If the Company has a majority voting interest in a VOE, the entity is consolidated. The Company has a controlling financial interest in a VIE when the Company has a variable interest that provides it with (i) the power to direct the activities of the VIE that most significantly impact the VIE’s economic performance and (ii) the obligation to absorb losses of the VIE or the right to receive benefits from the VIE that could potentially be significant to the VIE.

The Company reassesses its evaluation of whether an entity is a VIE when certain reconsideration events occur.

Segment and Geographic Information

The Company operates as an ETP sponsor and asset manager providing investment advisory services globally. These activities are reported in the Company’s U.S. Business and International Business reportable segments. The International Business reportable segment includes the results of the Company’s European operations and Canadian operations.

The financial results of ETFS are included in the International Business reportable segment as of the acquisition date.


9


Table of Contents

Foreign Currency Translation

Assets and liabilities of subsidiaries whose functional currency is not the U.S. dollar are translated based on the end of period exchange rates from local currency to U.S. dollars. Results of operations are translated at the average exchange rates in effect during the period. The impact of the foreign currency translation adjustment is included in the Consolidated Statements of Comprehensive Income as a component of other comprehensive income.    

Use of Estimates

The preparation of the Company’s consolidated financial statements in conformity with U.S. GAAP requires management to make estimates and assumptions that affect the reported amounts of assets and liabilities as of the balance sheet dates and the reported amounts of revenues and expenses for the periods presented. Actual results could differ materially from those estimates.

Revenue Recognition

The Company earns substantially all of its revenue in the form of advisory fees from its ETPs and recognizes this revenue over time, as the performance obligation is satisfied. ETP advisory fees are based on a percentage of the ETPs’ average daily net assets. Progress is measured using the practical expedient under the output method resulting in the recognition of revenue in the amount for which the Company has a right to invoice.

Contractual Gold Payments

Contractual gold payments are measured monthly based upon the average daily spot price of gold (See Note 11).

Marketing and Advertising

Advertising costs, including media advertising and production costs, are expensed when incurred.

Depreciation and Amortization

Depreciation is provided for using the straight-line method over the estimated useful lives of the related assets as follows:


Equipment

     5 years  

Furniture and fixtures

     15 years  

Leasehold improvements are amortized over the term of their respective leases or service lives of the improvements, whichever is shorter. Fixed assets are recorded at cost less accumulated depreciation and amortization.

Occupancy

The Company accounts for its office lease facilities as operating leases, which may include free rent periods and escalation clauses. The Company expenses the lease payments associated with operating leases on a straight-line basis over the lease term.

Stock-Based Awards

Accounting for stock-based compensation requires the measurement and recognition of compensation expense for all equity awards based on estimated fair values. Stock-based compensation is measured based on the grant-date fair value of the award and is amortized over the relevant service period. Forfeitures are recognized when they occur.

Third-Party Distribution Fees

The Company pays a percentage of its advisory fee revenues based on incremental growth in AUM, subject to caps or minimums, to marketing agents to sell WisdomTree ETFs and for including WisdomTree ETFs on third-party customer platforms.

Cash and Cash Equivalents

The Company considers all highly liquid investments with an original maturity of 90 days or less at the time of purchase to be classified as cash equivalents. The Company maintains deposits with financial institutions in an amount that is in excess of federally insured limits.

Accounts Receivable and Allowance for Doubtful Accounts

Accounts receivable are customer and other obligations due under normal trade terms. An allowance for doubtful accounts is not provided since, in the opinion of management, all accounts receivable recorded are deemed current and collectible.


10


Table of Contents

Impairment of Long-Lived Assets

The Company performs a review for the impairment of long-lived assets when events or changes in circumstances indicate that the estimated undiscounted future cash flows expected to be generated by the assets are less than their carrying amounts or when other events occur which may indicate that the carrying amount of an asset may not be recoverable.

Note Receivable

Note receivable is accounted for on an amortized cost basis, net of original issue discount. Interest income is accrued over the term of the note using the effective interest method. The Company performs a review for the impairment of the note receivable on a quarterly basis and provides for an allowance for credit losses if all or a portion of the note is determined to be uncollectible.

Securities Owned and Securities Sold, but not yet Purchased (at fair value)

Securities owned and securities sold, but not yet purchased are securities classified as either trading or available-for-sale. These securities are recorded on their trade date and are measured at fair value. All equity securities are classified by the Company as trading. Debt securities are classified based primarily on the Company’s intent to hold or sell the security. Changes in the fair value of securities classified as trading are reported in other income in the period the change occurs. Unrealized gains and losses of securities classified as available-for-sale are included in other comprehensive income. Once sold, amounts reclassified out of accumulated other comprehensive income and into earnings are determined using the specific identification method. Available-for-sale securities are assessed for impairment on a quarterly basis.

Securities Held-to-Maturity

The Company accounts for certain of its investments as held-to-maturity on a trade date basis, which are recorded at amortized cost. For held-to-maturity investments, the Company has the intent and ability to hold investments to maturity and it is not more-likely-than-not that the Company will be required to sell the investments before recovery of their amortized cost bases, which may be maturity. On a quarterly basis, the Company reviews its portfolio of investments for impairment. If a decline in fair value is deemed to be other-than-temporary, the security is written down to its fair value through earnings.

Investments, Carried at Cost

The Company accounts for equity investments that do not have a readily determinable fair value as cost method investments under the measurement alternative prescribed within Accounting Standards Update (“ASU”) 2016-01, Financial Instruments – Recognition and Measurement of Financial Assets and Financial Liabilities, to the extent such investments are not subject to consolidation or the equity method. Under the measurement alternative, these financial instruments are carried at cost, less any impairment (assessed quarterly), plus or minus changes resulting from observable price changes in orderly transactions for an identical or similar investment of the same issuer. In addition, income is recognized when dividends are received only to the extent they are distributed from net accumulated earnings of the investee. Otherwise, such distributions are considered returns of investment and are recorded as a reduction of the cost of the investment.

Goodwill

Goodwill is the excess of the fair value of the purchase price over the fair values of the identifiable net assets at the acquisition date. The Company tests its goodwill for impairment at least annually and at the time of a triggering event requiring re-evaluation, if one were to occur, in accordance with ASU 2017-04, Intangibles-Goodwill and Other (Topic 350): Simplifying the Test for Goodwill Impairment. The Company early adopted the revised guidance for the impairment tests performed after January 1, 2017. Under the revised guidance, goodwill is considered impaired when the estimated fair value of the reporting unit that was allocated the goodwill is less than its carrying value. If the estimated fair value of such reporting unit is less than its carrying value, goodwill impairment is recognized based on that difference, not to exceed the carrying amount of goodwill. A reporting unit is an operating segment or a component of an operating segment provided that the component constitutes a business for which discrete financial information is available and management regularly reviews the operating results of that component.

For impairment testing purposes, goodwill has been allocated to the Company’s U.S. Business reporting unit which is assessed annually for impairment on April 30th (See Note 22). In addition, goodwill arising from the ETFS Acquisition (See Note 3) has been allocated to the European Business reporting unit, included within the International Business reportable segment and assessed annually for impairment on November 30th. When performing its goodwill impairment test, the Company considers a qualitative assessment, when appropriate, and the income approach, market approach and its market capitalization when determining the fair value of its reporting units.


11


Table of Contents

Intangible Assets

Indefinite-lived intangible assets are tested for impairment at least annually and are also reviewed for impairment whenever events or changes in circumstances indicate that the carrying amount of an asset may not be recoverable. Indefinite-lived intangible assets are impaired if their estimated fair values are less than their carrying values.

Finite-lived intangible assets, if any, are amortized over their estimated useful life, which is the period over which the assets are expected to contribute directly or indirectly to the future cash flows of the Company. These intangible assets are tested for impairment at the time of a triggering event, if one were to occur. Finite-lived intangible assets may be impaired when the estimated undiscounted future cash flows generated from the assets are less than their carrying amounts.

The Company may rely on a qualitative assessment when performing its intangible asset impairment test. Otherwise, the impairment evaluation is performed at the lowest level of reasonably identifiable cash flows independent of other assets. The annual impairment testing date for all of the Company’s intangible assets is November 30th.

Deferred Consideration

Deferred consideration represents the present value of an obligation to pay gold to a third party into perpetuity and is measured using forward-looking gold prices and a selected discount rate (See Note 11). Changes in the fair value of this obligation are reported as gain/(loss) on revaluation of deferred consideration on the Company’s Consolidated Statements of Operations.

Long-Term Debt

Long-term debt is carried at amortized cost, net of debt issuance costs. Interest expense is recognized using the effective interest method and includes amortization of debt issuance costs over the life of the debt.

Earnings per Share

Basic earnings per share (“EPS”) is computed by dividing net income available to common stockholders by the weighted-average number of common shares outstanding for the period. Net income available to common stockholders represents net income of the Company reduced by an allocation of earnings to participating securities. The preferred stock issued in connection with the ETFS Acquisition (see Note 3) and unvested share-based payment awards that contain non-forfeitable rights to dividends or dividend equivalents (whether paid or unpaid) are participating securities and are included in the computation of EPS pursuant to the two-class method. Share-based payment awards that do not contain such rights are not deemed participating securities and are included in diluted shares outstanding (if dilutive) under the treasury stock method. Diluted EPS reflects the reduction in earnings per share assuming dilutive options or other dilutive contracts to issue common stock were exercised or converted into common stock. Diluted EPS is calculated under the treasury stock and if-converted method and the two-class method. The calculation that results in the most dilutive EPS amount for the common stock is reported in the Company’s consolidated financial statements.

Income Taxes

The Company accounts for income taxes using the liability method, which requires the determination of deferred tax assets and liabilities based on the differences between the financial and tax basis of assets and liabilities using the enacted tax rates in effect for the year in which differences are expected to reverse. Deferred tax assets are adjusted by a valuation allowance if, based on the weight of available evidence, it is more-likely-than-not that some portion or all the deferred tax assets will not be realized.

Tax positions are evaluated utilizing a two-step process. The Company first determines whether any of its tax positions are more-likely-than-not to be sustained upon examination, based solely on the technical merits of the position. Once it is determined that a position meets this recognition threshold, the position is measured as the largest amount of benefit that is greater than 50% likely of being realized upon ultimate settlement. The Company records interest expense and penalties related to tax expenses as income tax expense.

Non-income based taxes are recorded as part of other liabilities and other expenses.

Recently Issued Accounting Pronouncements

In May 2014, the Financial Accounting Standards Board, or FASB, issued ASU 2014-09, Revenue from Contracts with Customers (ASU 2014-09), a comprehensive revenue recognition standard on the financial reporting requirements for revenue from contracts entered into with customers. In July 2015, the FASB deferred this ASU’s effective date by one year, to interim and annual periods beginning after December 15, 2017. The deferral allows early adoption at the original effective date. During 2016, the FASB issued ASU 2016-08, which clarifies principal versus agent considerations, ASU 2016-10, which clarifies identifying performance obligations and the licensing implementation guidance, and ASU 2016-12, which amends certain aspects of the new revenue recognition standard pursuant to ASU 2014-09. ASU 2014-09 allows for the use of either the retrospective or modified retrospective adoption method. The guidance in ASU 2014-09, and the related amendments, became effective for the Company on January 1, 2018.


12


Table of Contents

The Company adopted this standard under the modified retrospective method and has determined the standard did not have a material impact on the Company’s historical pattern of recognizing revenue from its contracts with customers (See Note 16).

In January 2016, the FASB issued ASU 2016-01, Financial Instruments – Recognition and Measurement of Financial Assets and Financial Liabilities (ASU 2016-01). The main objective of the standard is to enhance the reporting model for financial instruments to provide users of financial statements with more decision-useful information. The amendments in the update make targeted improvements to generally accepted accounting principles. These include requiring equity investments (except those accounted for under the equity method of accounting or those that result in consolidation of the investee) to be measured at fair value with changes in fair value recognized in net income. Available-for-sale classification for equity investments with readily determinable fair values will no longer be permissible. However, an entity may choose a measurement alternative to measure equity investments that do not have readily determinable fair values by recognizing these financial instruments at cost minus impairment, if any, plus or minus changes resulting from observable price changes in orderly transactions for the identical or similar investment of the same issuer. The update also simplifies the impairment assessment of equity investments without readily determinable fair values by requiring a qualitative assessment to identify impairment. When a qualitative assessment indicates that impairment exists, an entity is required to measure the investment at fair value. ASU 2016-01 is effective for fiscal years beginning after December 15, 2017, including interim periods within those fiscal years. The Company adopted this standard on January 1, 2018 and has elected to apply the measurement alternative to its equity investments that do not have readily determinable fair values. The adoption of this standard did not have a material impact on the Company’s consolidated financial statements.

In June 2016, the FASB issued ASU 2016-13, Financial Instruments-Credit Losses (Topic 326) – Measurement of Credit Losses on Financial Instruments (ASU 2016-13). The main objective of the standard is to provide financial statement users with more decision-useful information about the expected credit losses on financial instruments and other commitments to extend credit held by a reporting entity at each reporting date. In issuing this standard, the FASB is responding to criticism that today’s guidance delays recognition of credit losses. The standard will replace today’s “incurred loss” approach with an “expected loss” model. The new model, referred to as the current expected credit loss (“CECL”) model, will apply to: (1) financial assets subject to credit losses and measured at amortized cost, and (2) certain off-balance sheet credit exposures. The standard is applicable to loans, accounts receivable, trade receivables, and other financial assets measured at amortized cost, loan commitments and certain other off-balance sheet credit exposures, debt securities (including those held-to-maturity) and other financial assets measured at fair value through other comprehensive income, and beneficial interests in securitized financial assets. The CECL model does not apply to available-for-sale debt securities. For available-for-sale debt securities with unrealized losses, entities will measure credit losses in a manner similar to what they do today, except that the credit losses will be recognized as allowances rather than reductions in the amortized cost of the securities. Accordingly, the new methodology will be utilized when assessing the Company’s financial instruments for impairment. As a result, entities will recognize improvements to estimated credit losses immediately in earnings rather than as interest income over time, as they do today. The ASU also simplifies the accounting model for purchased credit-impaired debt securities and loans. ASU 2016-13 also expands the disclosure requirements regarding an entity’s assumptions, models, and methods for estimating the allowance for loan and lease losses. ASU 2016-13 is effective for years beginning after December 15, 2019, including interim periods within those fiscal years under a modified retrospective approach. Early adoption is permitted for periods beginning after December 15, 2018. The Company is currently evaluating the impact that the standard will have on its consolidated financial statements.

In February 2016, the FASB issued ASU 2016-02, Leases (ASU 2016-02), which requires lessees to include most leases on the balance sheet. ASU 2016-02 is effective for fiscal years (and interim reporting periods within those years) beginning after December 15, 2018 and early adoption is permitted. The Company is currently evaluating the impact that the standard will have on its consolidated financial statements and expects, at a minimum, that its implementation will result in a gross-up on the consolidated balance sheets upon recognition of right-of-use assets and lease liabilities associated with the future minimum payments required under operating leases as disclosed in Note 14.

In August 2018, the FASB issued ASU 2018-13, Fair Value Measurement (Topic 820) – Disclosure Framework – Changes to the Disclosure Requirements for Fair Value Measurement (ASU 2018-13), which modifies the disclosure requirements on fair value measurements, including removing the requirement to disclose (1) the amount of and reasons for transfers between Level 1 and Level 2 of the fair value hierarchy, (2) the policy for timing of transfers between levels and (3) the valuation processes for Level 3 fair value measurements. ASU 2018-13 also added new disclosures including the requirement to disclose (A) the changes in unrealized gains and losses for the period included in other comprehensive income for recurring Level 3 fair value measurements held at the end of the reporting period and (B) the range and weighted average of significant unobservable inputs used to develop Level 3 fair value measurements. ASU 2018-13 is effective for fiscal years (and interim reporting periods within those years) beginning after December 15, 2019 and early adoption is permitted. This standard will only impact the disclosures pertaining to fair value measurements.


13


Table of Contents

3. Business Combination

Summary

On November 13, 2017, the Company entered into a Share Sale Agreement as amended by the Waiver and Variation Agreement, dated April 11, 2018 (collectively referred to as the “Share Sale Agreement”) with ETFS Capital and WisdomTree International Holdings Ltd, an indirect wholly owned subsidiary of the Company (“WisdomTree International”), pursuant to which the Company agreed to acquire ETFS. On April 11, 2018, the Company completed the acquisition by purchasing the entire issued share capital of a subsidiary of ETFS Capital into which ETFS Capital transferred ETFS prior to completion of the ETFS Acquisition.

Pursuant to the Share Sale Agreement, the Company acquired ETFS for a purchase price consisting of (a) $253,000 in cash (including $53,000 paid from proceeds arising from maturities of securities owned, at fair value), subject to customary adjustments for working capital, and (b) a fixed number of shares of the Company’s capital stock, consisting of (i) 15,250,000 shares of common stock (the “Common Shares”) and (ii) 14,750 shares of Series A Non-Voting Convertible Preferred Stock (the “Preferred Shares”), which are convertible, subject to certain restrictions, into an aggregate of 14,750,000 shares of common stock.

On April 11, 2018 and in connection with the ETFS Acquisition, the Company and WisdomTree International entered into a credit agreement (the “Credit Agreement”), by and among the Company, WisdomTree International, certain subsidiaries of the Company as guarantors, the lenders party thereto and Credit Suisse AG, Cayman Islands Branch, as administrative agent, collateral agent, L/C Issuer and lender. Under the Credit Agreement, the lenders extended a $200,000 term loan (the “Term Loan”) to WisdomTree International, the net cash proceeds of which were used by WisdomTree International, together with other cash on hand, to complete the acquisition and pay certain related fees, costs and expenses, and made a $50,000 revolving credit facility (the “Revolver” and, together with the Term Loan, the “Credit Facility”) available to the Company and WisdomTree International for revolving borrowings from time to time for working capital, capital expenditures and general corporate purposes (See Note 12).

On April 11, 2018 and in connection with the acquisition, the Company and ETFS Capital also entered into an Investor Rights Agreement, pursuant to which, among other things, ETFS Capital is subject to lock-up, standstill and voting restrictions. ETFS Capital also received certain registration rights with respect to the Common Shares and the shares of common stock issuable upon conversion of the Preferred Shares it received in the transaction.

Purchase Price Allocation

The ETFS Acquisition has been accounted for under the acquisition method of accounting in accordance with ASC Topic 805, Business Combinations, which requires an allocation of the consideration paid by the Company to the identifiable assets and liabilities of ETFS based on the estimated fair values as of the closing date of the acquisition. An allocation of the consideration transferred is presented below based on information currently available and includes the Company’s valuation of the fair value of tangible and intangible assets acquired and liabilities assumed.

The following table summarizes the allocation of the purchase price as of the acquisition date:


Purchase price


Preferred Shares issued

     14,750  

Conversion ratio

     1,000  


Common stock equivalents

     14,750,000  

Common Shares issued

     15,250,000  


Total shares issued

     30,000,000  

WisdomTree stock price(1)

   $ 9.00  


Equity portion of purchase price

   $ 270,000  

Cash portion of purchase price


Term Loan (See Note 12)

     200,000  

Cash on hand

     53,000  


Purchase price

     523,000  

Deferred consideration (See Note 11)

     172,746  


Total

   $ 695,746  

Allocation of consideration


Cash and cash equivalents

     13,687  

Receivables and other current assets

     14,069  

Intangible assets(2)

     601,247  

Other current liabilities

     (17,314

Fair value of net assets acquired

     611,689  


Goodwill resulting from the ETFS Acquisition (3)

   $ 84,057  


14


Table of Contents


(1)

The closing price of the Company’s common stock on April 10, 2018, the last trading day prior to the closing date of the acquisition.


(2)

Represents purchase price allocated to customary advisory agreements. The fair value of the intangible assets was determined using an income approach (discounted cash flow analysis) which relied upon significant unobservable inputs including a revenue growth multiple of 3% to 4% and a weighted average cost of capital of 11.6%. These intangible assets were determined to have an indefinite useful life and are not deductible for tax purposes. A deferred tax liability associated with these intangible assets was not recognized as the intangibles arose in Jersey, where the Company will be subject to a zero percent tax rate.


(3)

Goodwill arising from the ETFS Acquisition represents the value of expected synergies created from combining the operations of ETFS and the Company. The goodwill is not deductible for tax purposes as the transaction was structured as a stock acquisition occurring in the United Kingdom.

Acquisition-Related Costs

During the three and nine months ended September 30, 2018, the Company incurred acquisition-related costs associated with the ETFS Acquisition of $456 and $10,446, respectively. Costs incurred during the three months ended September 30, 2018 were primarily related to the integration of ETFS. Costs incurred during the nine months ended September 30, 2018 included professional advisor fees, severance and other compensation costs, a write-off of the Company’s office lease and other integration costs.

Operating Results of ETFS

The Company’s Consolidated Statements of Operations include the following operating results of ETFS since the acquisition date of April 11, 2018 through September 30, 2018:


Revenues:

  $37,137

Income before taxes:

  $33,496 (including a gain on revaluation of deferred consideration of $17,630)

Supplemental Unaudited Pro Forma Financial Information

The following table presents unaudited pro forma financial information of the Company as if the ETFS Acquisition had been consummated on January 1, 2017. The information was derived from the historical financial results of the Company and ETFS for all periods presented and was adjusted to give effect to pro forma events that are directly attributable to the acquisition, factually supportable and expected to have a continuing impact on the combined results following the acquisition.


     Three Months Ended September 30,      Nine Months Ended September 30,  
     2018      2017      2018      2017  

Revenues

     n/a      $  78,594    $  229,674    $  228,004

Net income

     n/a      $ 6,736    $ 48,088    $ 22,011

Included within the pro forma financial information above is a gain/(loss) on revaluation of deferred consideration of ($4,869) for the three months ended September 30, 2017, and $4,670 and ($15,088) for the nine months ended September 30, 2018 and 2017, respectively. Significant adjustments to the unaudited pro forma financial information above include the recognition of interest expense associated with the Credit Facility for the periods presented, eliminating acquisition-related costs directly attributable to the acquisition and adjusting consolidated income tax expense based upon the Company’s anticipated normalized consolidated effective tax rate.

The unaudited pro forma financial information above is not necessarily indicative of what the combined results of the Company would have been had the acquisition been completed as of January 1, 2017 and does not purport to project the future results of the combined company. In addition, the unaudited pro forma financial information does not reflect any future planned cost savings initiatives following the completion of the acquisition.


15


Table of Contents

4. Cash and Cash Equivalents

Cash and cash equivalents of approximately $32,412 and $24,103 at September 30, 2018 and December 31, 2017, respectively, were held at one financial institution. At September 30, 2018 and December 31, 2017, cash equivalents were approximately $5,722 and $26,548, respectively.

5. Fair Value Measurements

Securities owned and securities sold, but not yet purchased are measured at fair value. The fair value of securities is defined as the price that would be received to sell an asset or paid to transfer a liability (i.e., “the exit price”) in an orderly transaction between market participants at the measurement date. Accounting Standards Codification (“ASC”) 820, Fair Value Measurements, establishes a hierarchy for inputs used in measuring fair value that maximizes the use of observable inputs and minimizes the use of unobservable inputs by requiring that the most observable inputs be used when available. Observable inputs are inputs that market participants would use in pricing the asset or liability developed based on market data obtained from independent sources. Unobservable inputs reflect assumptions that market participants would use in pricing the asset or liability developed based on the best information available in the circumstances. The hierarchy is broken down into three levels based on the transparency of inputs as follows:


           Level 1       Quoted prices for identical instruments in active markets.
  Level 2       Quoted prices for similar instruments in active markets; quoted prices for identical or similar instruments in markets that are not active; and model-derived valuations whose inputs are observable or whose significant value drivers are observable.
  Level 3       Instruments whose significant drivers are unobservable.

The availability of observable inputs can vary from product to product and is affected by a wide variety of factors, including, for example, the type of product, whether the product is new and not yet established in the marketplace, and other characteristics particular to the transaction. To the extent that valuation is based on models or inputs that are less observable or unobservable in the market, the determination of fair value requires more judgment. Accordingly, the degree of judgment exercised by management in determining fair value is greatest for instruments categorized in Level 3. In certain cases, the inputs used to measure fair value may fall into different levels of the fair value hierarchy. In such cases, for disclosure purposes, the level in the fair value hierarchy within which the fair value measurement in its entirety falls is determined based on the lowest level input that is significant to the fair value measurement in its entirety.

The tables below summarize the categorization of the Company’s assets and liabilities measured at fair value. During the three and nine months ended September 2018 and 2017 there were no transfers between Levels 1, 2 and 3.


     September 30, 2018  
     Total      Level 1      Level 2      Level 3  

Assets:


Recurring fair value measurements:


Cash equivalents

   $ 5,722      $ 5,722      $  —      $ —  

Securities owned, at fair value

     4,426        4,426        —          —    


Total

   $ 10,148      $  10,148        —        $ —  


Non-recurring fair value measurements:


AdvisorEngine Inc. – Option(1)

   $ 3,278      $ —      $  —      $ 3,278  

Thesys Group, Inc. – Series Y preferred stock(2)

     6,909        —          —          6,909  


Total

   $ 10,187      $ —      $ —      $ 10,187  


Liabilities:


Recurring fair value measurements:


Deferred consideration (Note 11)

   $  156,055      $ —      $  —      $  156,055  

Securities sold, but not yet purchased

     2,018        2,018        —          —    


Total

   $ 158,073      $ 2,018      $  —      $ 156,055  


16


Table of Contents
     December 31, 2017  
     Total      Level 1      Level 2      Level 3  

Assets:


Recurring fair value measurements:


Cash equivalents

   $  26,548      $  26,548      $ —      $ —  

Securities owned, at fair value

     66,294        1,691        64,603        —    


Total

   $ 92,842      $ 28,239      $  64,603      $ —  


Non-recurring fair value measurements:


AdvisorEngine Inc. – Option(1)

   $ 3,278        —          —        $ 3,278  

Thesys Group, Inc. – Series Y preferred stock(2)

     6,909        —          —          6,909  


Total

   $ 10,187      $ —      $ —      $  10,187  


Liabilities:


Recurring fair value measurements:


Securities sold, but not yet purchased

   $ 950      $ 950      $ —      $ —  


Total

   $ 950      $ 950      $ —      $ —  


(1)

Fair value determined on December 29, 2017 (See Note 9).

(2)

Fair value determined on June 20, 2017 (See Note 9).

Recurring Fair Value Measurements - Methodology

Cash and Cash Equivalents (Note 4) – These financial assets represent cash in banks or cash invested in highly liquid investments with original maturities less than 90 days. These investments are valued at par, which approximates fair value, and are considered Level 1.

Securities Owned/Sold but Not Yet Purchased (Note 6) – Securities owned and sold, but not yet purchased include investments in ETFs and short-term investment grade corporate bonds. ETFs are generally traded in active, quoted and highly liquid markets and are therefore classified as Level 1 in the fair value hierarchy. Investments in short-term investment grade corporate bonds are classified as Level 2 as fair value is generally derived from observable bids for these financial instruments.

Deferred Consideration – Deferred consideration represents the present value of an obligation to pay gold into perpetuity and was measured at September 30, 2018 using forward-looking gold prices ranging from $1,193 per ounce to $2,693 per ounce which are extrapolated from the last observable price (beyond 2024), discounted at a rate of 10%. This obligation is classified as Level 3 as the discount rate and extrapolated forward-looking gold prices are significant unobservable inputs. An increase in gold prices would result in an increase in deferred consideration, whereas, an increase in the discount rate would reduce the fair value. See Note 11 for additional information.

The following table presents a reconciliation of beginning and ending balances of recurring fair value measurements classified as Level 3:


     Three Months Ended
September 30,
     Nine Months Ended
September 30,
 
     2018      2017      2018     2017  

Deferred consideration (See Note 11)


Beginning balance

   $  162,848      $  —        $  172,746 (1)     $  —    

Net realized losses/(gains)(2)

     2,880        —          5,595       —    

Net unrealized losses/(gains)(3)

     (7,732      —          (17,630     —    

Settlements

     (1,941      —          (4,656     —    


Ending balance

   $ 156,055      $ —        $ 156,055     $ —    


(1)

Arose in connection with the completion of the ETFS Acquisition on April 11, 2018 (See Note 3).

(2)

Recorded as contractual gold payments expense on the Company’s Consolidated Statements of Operations.

(3)

Recorded as gain on revaluation of deferred consideration on the Company’s Consolidated Statements of Operations.


17


Table of Contents

6. Securities Owned/Sold but Not Yet Purchased

These securities consist of securities classified as trading and available-for-sale, as follows:


     September 30,
2018
     December 31,
2017
 

Securities Owned


Trading securities

   $  4,426      $ 1,691  

Available-for-sale debt securities

     —          64,603  


Total

   $ 4,426      $  66,294  


Securities Sold, but not yet Purchased


Trading securities

   $ 2,018      $ 950  

Available-for-sale debt securities

     —          —    


Total

   $ 2,018      $ 950  


Available-for-Sale Debt Securities

The following table summarizes unrealized gains, losses and fair value of the available-for-sale debt securities:


     September 30,
2018
     December 31,
2017
 

Cost

   $  —        $  65,237  

Gross unrealized gains in other comprehensive income

     —          —    

Gross unrealized losses in other comprehensive income

     —          (634


Fair value

   $ —        $ 64,603  


During the three and nine months ended September 30, 2018, the Company received $0 and $64,498, respectively, of proceeds from the sale and maturity of available-for-sale securities and recognized gross realized losses of $0 and $739, respectively.

During the three and nine months ended September 30, 2017, the Company received $19,003 and $65,067, respectively, of proceeds from the sale and maturity of available-for-sale securities and recognized gross realized losses of $277 and $687, respectively.

Realized losses have been reclassified out of accumulated other comprehensive income and into the Consolidated Statements of Operations.

7. Securities Held-to-Maturity

The following table is a summary of the Company’s securities held-to-maturity:


     September 30,
2018
     December 31,
2017
 

Federal agency debt instruments (amortized cost)

   $  20,199      $  21,299  


The following table summarizes unrealized gains, losses, and fair value of securities held-to-maturity:


     September 30,
2018
     December 31,
2017
 

Cost/amortized cost

   $  20,199      $  21,299  

Gross unrealized gains

     4        9  

Gross unrealized losses

     (2,232      (1,257


Fair value

   $ 17,971      $ 20,051  


The Company assesses these securities for other-than-temporary impairment on a quarterly basis. No securities were determined to be other-than-temporarily impaired at September 30, 2018 or December 31, 2017. The Company does not intend to sell these securities and it is not more-likely-than-not that the Company will be required to sell the securities before recovery of their amortized cost bases, which may be maturity.


18


Table of Contents

The following table sets forth the maturity profile of the securities held-to-maturity; however, these securities may be called prior to maturity date:


     September 30,
2018
     December 31,
2017
 

Due within one year

   $ —        $ 1,000  

Due one year through five years

     4        11  

Due five years through ten years

     6,025        6,027  

Due over ten years

     14,170        14,261  


Total

   $  20,199      $  21,299  


8. Note Receivable

On December 29, 2017, the Company committed to provide up to $30,000 in additional working capital to AdvisorEngine Inc. (“AdvisorEngine”) pursuant to an unsecured promissory note, all of which has been funded. The majority of the funds were used by AdvisorEngine to acquire CRM Software, Inc., known as Junxure, a comprehensive client relationship management software and technology provider for financial advisors.

All principal amounts under the note bear interest from the date such amounts are advanced until repaid at a rate of 5% per annum, provided that immediately upon the occurrence and during the continuance of an event of default (as defined), interest will be increased to 10% per annum. All accrued and unpaid interest is treated as paid-in-kind (“PIK”) by capitalizing such amount and adding it to the principal amount of the original note. AdvisorEngine has the option to prepay the note, in whole or in part, at any time without premium or penalty. All borrowings under the promissory note mature on December 29, 2021.

In connection with providing funding to AdvisorEngine for the acquisition of Junxure, the Company secured an option to purchase the remaining equity interests in AdvisorEngine. The option was ascribed a fair value of $3,278 (See Note 9) which gave rise to original issue discount reducing the carrying value of the note.

The following is a summary of the outstanding note receivable balance:


     September 30,
2018
     December 31,
2017
 

Note receivable (face value)

   $  30,000      $ 22,000  

Less: Original issue discount (“OID”), unamortized

     (2,788      (3,252

Plus: PIK interest

     909        —    


Total note receivable, net

   $ 28,121      $ 18,748  


Commitment remaining

     n/a      $ 8,000  


During the three and nine months ended September 30, 2018, the Company recognized interest income of $533 and $1,373, respectively, which included OID amortization and accrued PIK interest. The Company determined that an allowance for credit loss was not necessary at September 30, 2018 and December 31, 2017 as the note receivable was recently issued and no adverse events or circumstances have occurred which may indicate that its carrying amount may not be recoverable. The carrying value of the note receivable at September 30, 2018 and December 31, 2017 approximates fair value as the implied discount rate of the note is similar to observable high yield credit spreads.

9. Investments, Carried at Cost

The following table sets forth the Company’s investments, carried at cost:


     September 30,
2018
     December 31,
2017
 

AdvisorEngine – Preferred stock

   $ 25,000      $ 25,000  

AdvisorEngine – Option

     3,278        3,278  

Thesys Group, Inc. (“Thesys”)

     6,909        6,909  


Total

   $ 35,187      $ 35,187  


19


Table of Contents

AdvisorEngine

Preferred Stock

On November 18, 2016, the Company made a $20,000 strategic investment in AdvisorEngine, an end-to-end wealth management platform which enables individual customization of investment philosophies. The Company and AdvisorEngine also entered into an agreement whereby the Company’s asset allocation models are made available through AdvisorEngine’s open architecture platform and the Company actively introduces the platform to its distribution network. In consideration of its investment, the Company received 11,811,856 shares of Series A convertible preferred shares (“Series A Preferred”).

The Series A Preferred is convertible into common stock at the option of the Company and contains various rights and protections including a non-cumulative 6.0% dividend, payable if and when declared by the board of directors, and a liquidation preference that is senior to all other holders of capital stock of AdvisorEngine.

On April 27, 2017, the Company invested an additional $5,000 in AdvisorEngine to help facilitate AdvisorEngine’s acquisition of Kredible Technologies, Inc., a technology enabled, research-driven practice management firm designed to help advisors acquire new clients, and to continue to fuel AdvisorEngine’s growth, leadership and innovation in the advisor solutions space. The Company received 2,646,062 shares of Series A-1 convertible preferred stock which has substantially the same terms as the Series A Preferred.

The Company’s aggregate equity ownership interest in AdvisorEngine is approximately 47% (or 41% on a fully-diluted basis). The investment is accounted for under the cost method of accounting as it is not considered to be in-substance common stock. No impairment existed at September 30, 2018 or December 31, 2017 and there were no observable price changes during the three and nine months ended September 30, 2018.

Option

On December 29, 2017, the Company secured an option to purchase the remaining equity interests in AdvisorEngine, in connection with its commitment to provide up to $30,000 of additional working capital. The option is for a period of approximately one year and is exercisable at a price derived from an agreed-upon enterprise valuation of AdvisorEngine. If exercised, closing of the acquisition would occur no later than January 15, 2019. The fair value of the option was determined to be $3,278 on December 29, 2017, using a Monte Carlo simulation which was predominantly based on unobservable inputs and is therefore classified as Level 3. The enterprise value was derived from unobservable inputs including a weighted average cost of capital (“WACC”) of 27% and an option volatility of 40%. An increase in the WACC would reduce AdvisorEngine’s enterprise value which would reduce the fair value of the option, whereas an increase in the option volatility would increase the fair value of the option.

The option is not accounted for as a derivative as it cannot be net settled and is not readily convertible to cash. Therefore, the option is accounted for under the cost method of accounting and is assessed for impairment on a quarterly basis. No impairment existed at September 30, 2018 or December 31, 2017.

Thesys

On June 20, 2017, the Company was issued 7,797,533 newly authorized shares of Series Y preferred stock (“Series Y Preferred”) of Thesys in connection with the resolution of a dispute related to the Company’s ownership stake in Thesys. The Series Y Preferred represents current ownership of 18.8% of Thesys on a fully diluted basis (excluding certain reserved shares). In addition, the Company was issued a warrant to purchase 3,898,766 shares of Series Y Preferred.

The Series Y Preferred ranks pari passu in priority with Thesys’s current preferred stockholders, has a liquidation preference of $0.231 per share, contains various rights and protections and is convertible into common stock at the option of the Company. The warrant is exercisable for five years after closing, at varying exercise prices that increase over time and set at multiples of a pre-determined Thesys valuation (or new valuation if Thesys completes a qualified financing, as defined, within two years). If a claim is brought against Thesys or the Company relating to the settlement, the warrant will be exercisable for 100% of the number of shares of Series Y Preferred issued to the Company at closing.

The Company recorded the Series Y Preferred at its fair value of $6,909 during the second quarter of 2017. The Series Y Preferred is not considered to be in-substance common stock and is therefore accounted for under the cost method of accounting. No impairment existed at September 30, 2018 or December 31, 2017 and there were no observable price changes during the three and nine months ended September 30, 2018. The fair value of the warrant was determined to be insignificant. The warrant is not accounted for as a derivative as it cannot be net settled and is not readily convertible to cash.


20


Table of Contents

10. Fixed Assets, net

The following table summarizes fixed assets:


     September 30,
2018
     December 31,
2017
 

Equipment

   $ 2,028      $ 1,879  

Furniture and fixtures

     2,386        2,449  

Leasehold improvements

     10,867        11,037  

Less: accumulated depreciation and amortization

     (5,558      (4,672


Total

   $ 9,723      $ 10,693  


11. Deferred Consideration

ETFS Capital first acquired Gold Bullion Securities Ltd. (“GBS Issuer”), one of the issuers that the Company acquired as part of the ETFS Acquisition, paying no upfront consideration. Instead, the consideration was deferred and contracted to be paid by ETFS Capital in fixed payments of physical gold bullion equating to 9,500 ounces of gold per year through March 31, 2058 and then subsequently reduced to 6,333 ounces of gold continuing into perpetuity (the “Contractual Gold Payments”).

ETFS Capital’s deferred consideration obligation did not terminate upon the Company’s acquisition of ETFS. Instead, a wholly-owned subsidiary of the Company assumed the obligation by entering into a Gold Royalty Agreement with ETFS Capital, which provides for the same Contractual Gold Payments payable to ETFS Capital in order for ETFS Capital to continue to satisfy its deferred consideration obligation. The Contractual Gold Payments are paid from advisory fee income generated by the physically backed gold exchange-traded products issued by GBS Issuer and any other Company sponsored financial product backed by physical gold (the “Gold ETCs”). The Contractual Gold Payments are subject to adjustment and reduction for declines in advisory fee income generated by the Gold ETCs, with any reduction remaining due and payable until paid in full. ETFS Capital’s recourse is limited to such advisory fee income and it has no recourse back to the Company for any unpaid amounts that exceed advisory fees earned. ETFS Capital ultimately has the right to claw back GBS Issuer if the Company fails to remit any amounts due.

The Company determined the present value of the deferred consideration of $172,746 and $156,055 at April 11, 2018 (date of acquisition) and September 30, 2018, respectively, using forward-looking gold prices which were extrapolated from the last observable price (beyond 2024), discounted at a rate of 10.0%. Current and long-term amounts payable at September 30, 2018 were $11,788 and $144,267, respectively.

During the three and nine months ended September 30, 2018, the Company recognized Contractual Gold Payments expense of $2,880 and $5,595, respectively, arising from the fixed payments of physical gold bullion of 2,375 ounces and 4,460 ounces, respectively, (or 9,500 ounces per annum) and the unwinding of the discount (representing the increase in the carrying amount of the deferred consideration for the passage of time). A gain on the revaluation of deferred consideration of $7,732 and $17,630 was recognized during the three and nine months ended September 30, 2018, respectively, due to changes in gold prices.

See Note 5 for a reconciliation of changes in the deferred consideration balance for the three and nine months ended September 30, 2018.    

12. Long-Term Debt

On April 11, 2018 and in connection with the ETFS Acquisition, the Company and WisdomTree International entered into a Credit Agreement, by and among the Company, WisdomTree International, certain subsidiaries of the Company as guarantors, the lenders party thereto and Credit Suisse AG, Cayman Islands Branch, as administrative agent, collateral agent, L/C Issuer and lender. Under the Credit Agreement, the lenders extended a $200,000 Term Loan to WisdomTree International, the net cash proceeds of which were used by WisdomTree International, together with other cash on hand, to complete the ETFS Acquisition and pay certain fees, costs and expenses, and made a $50,000 Revolver available to the Company and WisdomTree International for revolving borrowings from time to time for working capital, capital expenditures and general corporate purposes. Interest on the Term Loan accrues at a rate per annum equal to LIBOR, plus up to 2.00% (commencing at LIBOR, plus 1.75%), and interest on the Revolver accrues at a rate per annum equal to LIBOR, plus up to 1.50% (commencing at LIBOR, plus 1.25%), in each case, with the exact interest rate margin determined based on the Total Leverage Ratio (as defined below). The Revolver is also subject to a facility fee equal to a rate per annum of up to 0.50% of the actual daily amount of the aggregate commitments (whether used or unused) under the Revolver, with the exact facility fee rate determined based on the Total Leverage Ratio. The Credit Facility matures on April 11, 2021 (the “Maturity Date”). The Term Loan does not amortize and the entire principal balance is due in a single payment on the Maturity Date.


21


Table of Contents

The following table provides a summary of the Company’s outstanding borrowings under the Credit Facility:


     September 30, 2018  
     Term Loan     Revolver  

Amount borrowed

   $ 200,000     $ —  

Unamortized issuance costs

     (6,001     1,328  


Carrying amount

   $ 193,999     $ 1,328


Effective interest rate(1)

     4.99     n/a  


(1)

Includes amortization of issuance costs.

During the three and nine months ended September 30, 2018, the Company recognized $2,747 and $5,103, respectively, of interest expense on the Credit Facility. Unamortized issuance costs of $1,328 related to the Revolver are included within other noncurrent assets on the Consolidated Balance Sheet.

The Credit Agreement includes a financial covenant that requires that the Company maintain a Total Leverage Ratio, calculated as of the last day of each fiscal quarter commencing with the fiscal quarter ending September 30, 2018, equal to or less than the ratio set forth opposite such fiscal quarter:


Fiscal Quarter Ending

   Total Leverage Ratio  

September 30, 2018

     2.75:1.00  

December 31, 2018

     2.75:1.00  

March 31, 2019

     2.75:1.00  

June 30, 2019

     2.50:1.00  

September 30, 2019

     2.50:1.00  

December 31, 2019

     2.50:1.00  

March 31, 2020

     2.25:1.00  

June 30, 2020

     2.25:1.00  

September 30, 2020 and each subsequent fiscal quarter ending on or before the Maturity Date

     2.00:1.00  

Total Leverage Ratio means, as of the last day of any fiscal quarter, the ratio of Consolidated Total Debt of the Company and its restricted subsidiaries (as defined in the Credit Agreement) as of such date to Consolidated EBITDA of the Company and its restricted subsidiaries (as defined in the Credit Agreement) for the four consecutive fiscal quarters ended on such date.

WisdomTree International’s obligations under the Term Loan and Revolver are unconditionally guaranteed by the Company and certain of its subsidiaries and secured by a lien on substantially all of the present and future property and assets of the Company, WisdomTree International and such subsidiaries, in each case, subject to customary exceptions and exclusions. The Company’s obligations under the Revolver are unconditionally guaranteed by certain of the Company’s wholly-owned domestic subsidiaries and secured by substantially all of the present and future property and assets of the Company and such subsidiaries, in each case, subject to customary exceptions and exclusions.

The Credit Agreement contains customary affirmative covenants for transactions of this type and other affirmative covenants agreed to by the parties, including, among others, the provision of annual and quarterly financial statements and compliance certificates, maintenance of property, insurance, compliance with laws and environmental matters. The Credit Agreement contains customary negative covenants, including among others, restrictions on the incurrence of indebtedness, granting of liens, making investments and acquisitions, paying dividends, repurchasing equity interests of the Company, entering into affiliate transactions and asset sales. The Credit Agreement also provides for a number of customary events of default, including, among others, payment, bankruptcy, covenant, representation and warranty, change of control and judgment defaults.

The Company was in compliance with its covenants under the Credit Agreement during the period April 11, 2018 through September 30, 2018.


22


Table of Contents

13. Preferred Shares

On April 10, 2018, the Company filed a Certificate of Designations of Series A Non-Voting Convertible Preferred Stock with the Secretary of State of the State of Delaware establishing the rights, preferences, privileges, qualifications, restrictions, and limitations relating to the Preferred Shares. The Preferred Shares are intended to provide ETFS Capital with economic rights equivalent to the Company’s common stock on an as-converted basis. The Preferred Shares have no voting rights, are not transferable and have the same priority with regard to dividends, distributions and payments as the common stock.

As described in the Certificate of Designations, the Company will not issue, and ETFS Capital does not have the right to require the Company to issue, any shares of common stock upon conversion of the Preferred Shares, if, as a result of such conversion, ETFS Capital (together with certain attribution parties) would beneficially own more than 9.99% of the Company’s outstanding common stock immediately after giving effect to such conversion.

In connection with the completion of the ETFS Acquisition, the Company issued 14,750 Preferred Shares, which are convertible into an aggregate of 14,750,000 shares of common stock. The fair value of this consideration was $132,750, based on the closing price of the Company’s common stock on April 10, 2018 of $9.00 per share, the last trading day prior to the closing of the acquisition.

The following is a summary of the Preferred Share balance:


     September 30,
2018
 

Issuance of Preferred Shares

   $ 132,750  

Less: Issuance costs

     (181


Preferred Shares – carrying value

   $ 132,569  


Temporary equity classification is required for redeemable instruments for which redemption triggers are outside of the issuer’s control. ETFS Capital has the right to redeem all the Preferred Shares specified to be converted during the period of time specified in the Certificate of Designations in the event that: (a) the number of shares of the Company’s common stock authorized by its certificate of incorporation is insufficient to permit the Company to convert all of the Preferred Shares requested by ETFS Capital to be converted; or (b) ETFS Capital does not, upon completion of a change of control of the Company, receive the same amount per Preferred Share as it would have received had each outstanding Preferred Share been converted into common stock immediately prior to the change of control. However, the Company will not be obligated to make any such redemption payments to the extent such payments would be a breach of any covenant or obligation the Company owes to any of its secured creditors or is otherwise prohibited by applicable law.

Any such redemption will be at a price per Preferred Share equal to the dollar volume-weighted average price for a share of common stock for the 30-trading day period ending on the date of such attempted conversion or change of control, as applicable, multiplied by 1,000. Such redemption payment will be made in one payment no later than 10 business days following the last day of the Company’s first fiscal quarter that begins on a date following the date ETFS Capital exercises such redemption right.

The carrying amount of the Preferred Shares were not adjusted during the three and nine months ended September 30, 2018 as it was not probable that they would become redeemable.

14. Commitments and Contingencies

Contractual Obligations

The Company has entered into obligations under operating leases with initial non-cancelable terms in excess of one year for office space, telephone and data services. Expenses recorded under these agreements for the three months ended September 30, 2018 and 2017 were approximately $1,435 and $1,177, respectively, and for the nine months ended September 30, 2018 and 2017 were $3,751 and $3,327, respectively.

Future minimum lease payments with respect to non-cancelable operating leases at September 30, 2018 were approximately as follows:


Remainder of 2018

   $ 1,282  

2019

     4,457  

2020

     4,007  

2021

     3,082  

2022 and thereafter

     21,300  


Total

   $ 34,128  


23


Table of Contents

Letter of Credit

The Company collateralized its U.S. office lease through a standby letter of credit totaling $1,384. The collateral is included in cash and cash equivalents on the Company’s Consolidated Balance Sheets.

Contingencies

The Company may be subject to reviews, inspections and investigations by regulatory authorities as well as legal proceedings arising in the ordinary course of business. The Company is not currently party to any litigation that is expected to have a material adverse impact on its business, financial position, results of operations or cash flows.

15. Variable Interest Entity

VIEs are entities with any of the following characteristics: (i) the entity does not have enough equity to finance its activities without additional financial support, (ii) the equity holders, as a group, lack the characteristics of a controlling financial interest or (iii) the entity is structured with non-substantive voting rights. The Company determined that AdvisorEngine has the characteristics of a VIE.

Consolidation of a VIE is required for the party deemed to be the primary beneficiary, if any. The primary beneficiary is the party who has both (a) the power to direct the activities of a VIE that most significantly impact the entity’s economic performance and (b) an obligation to absorb losses of the entity or a right to receive benefits from the entity that could potentially be significant to the entity. The Company is not the primary beneficiary of AdvisorEngine as it does not have the power to direct the activities that most significantly impact AdvisorEngine’s economic performance. Such power is conveyed through AdvisorEngine’s Board of Directors and the Company does not have control over the board.

The following table presents information about the Company’s variable interests in AdvisorEngine (a non-consolidated VIE):


     September 30,
2018
     December 31,
2017
 

Carrying Amount - Assets


Preferred stock

   $ 25,000      $ 25,000  

Note receivable - unsecured

     28,121        18,748  

Option

     3,278        3,278  


Total carrying amount - Assets

   $ 56,399      $ 47,026  


Maximum exposure to loss

   $ 56,399      $ 55,026  


16. Revenues from Contracts with Customers

The following table presents the Company’s total revenues from contracts with customers:


     Three Months
Ended

September 30,
2018
     Nine Months
Ended
September 30,
2018
 

Revenues from contracts with customers:


Advisory fees

   $ 71,679      $ 203,913  

Other

     891        2,336  


Total operating revenues

   $ 72,570      $ 206,249  


The Company recognizes revenues from contracts with customers when the performance obligation is satisfied, which is when the promised goods or services are transferred to the customer. A good or service is considered to be transferred when the customer obtains control, which is represented by the transfer of rights with regard to the good or service. Transfer of control happens either over time or at a point in time. When a performance obligation is satisfied over time, an entity is required to select a single method of measuring progress for each performance obligation that depicts the entity’s performance in transferring control of goods or services to the customer.

Substantially all the Company’s revenues from contracts with customers are derived primarily from investment advisory agreements with related parties (See Note 17). These advisory fees are recognized over time, are earned from the Company’s ETPs and are calculated based on a percentage of the ETPs’ average daily net assets. There is no significant judgment in calculating amounts due which are invoiced monthly in arrears and are not subject to any potential reversal. Progress is measured using the practical expedient under the output method resulting in the recognition of revenue in the amount for which the Company has a right to invoice.


24


Table of Contents

There are no contract assets or liabilities that arise in connection with the recognition of advisory fee revenue. In addition, there are no costs incurred to obtain or fulfill the contracts with customers, all of which are investment advisory agreements with related parties.

See Note 17 for further information including disaggregation of advisory fee revenue and amounts due from customers, all of which are derived from related parties. Advisory fee revenues are also reported by segment as disclosed in Note 23.

17. Related Party Transactions

The Company’s revenues are derived primarily from investment advisory agreements with related parties. Under these agreements, the Company has licensed to related parties the use of certain of its own indexes for the U.S. and Canadian WisdomTree ETFs and WisdomTree UCITS ETFs. The Board of Trustees and Board of Directors (including certain officers of the Company) of the related parties are primarily responsible for overseeing the management and affairs of the entities for the benefit of their stakeholders and have contracted with the Company to provide for general management and administration services. The Company is also responsible for certain expenses of the related parties, including the cost of transfer agency, custody, fund administration and accounting, legal, audit, and other non-distribution services, excluding extraordinary expenses, taxes and certain other expenses, which is included in fund management and administration on the Company’s Consolidated Statements of Operations. In exchange, the Company receives fees based on a percentage of the ETF average daily net assets. The advisory agreements may be terminated by the related parties upon notice.

The following table summarizes accounts receivable from related parties which are included as a component of Accounts receivable on the Company’s Consolidated Balance Sheets:


     September 30,
2018
     December 31,
2017
 

Receivable from WTT

   $ 16,057      $ 19,433  

Receivable from ETFS Issuers

     7,684        —    

Receivable from BI and WTI

     861        979  

Receivable from WTAMC

     163        87  

Receivable from WTCS

     100        97  


Total

   $ 24,865      $ 20,596  


The following table summarizes revenues from advisory services provided to related parties:


     Three Months Ended
September 30,
     Nine Months Ended
September 30,
 
     2018      2017      2018      2017  

Advisory services provided to WTT

   $ 49,900      $ 54,439      $ 157,693      $ 158,206  

Advisory services provided to ETFS Issuers

     18,442        —          36,161        —    

Advisory services provided to BI and WTI

     2,532        2,452        7,883        6,498  

Advisory services provided to WTAMC

     489        92        1,204        263  

Advisory services provided to WTCS

     316        310        972        1,210  


Total

   $ 71,679      $ 57,293      $ 203,913      $ 166,177  


The Company also has investments in certain WisdomTree ETFs of approximately $2,720 and $1,691 at September 30, 2018 and December 31, 2017, respectively. Gains and losses related to these ETFs for the three and nine months ended September 30, 2018 and 2017 were less than $100.

18. Stock-Based Awards

The Company grants equity awards to employees and directors which include restricted stock awards, restricted stock units and stock options. Stock options may be issued for terms of ten years and may vest after at least one year and have an exercise price equal to the Company’s stock price on the grant date. Restricted stock awards and restricted stock units are generally valued based on the Company’s stock price on the grant date. The Company estimates the fair value for stock options (when granted) using the Black-Scholes option pricing model. All restricted stock awards, restricted stock units and stock option awards require future service as a condition of vesting with certain awards subject to acceleration under certain conditions.

On June 20, 2016, the Company’s stockholders approved a new equity award plan under which the Company can issue up to 10,000,000 shares of common stock (less one share for every share granted under prior plans since March 31, 2016 and inclusive of shares available under the prior plans as of March 31, 2016) in the form of stock options and other stock-based awards. The Company also has issued from time to time stock-based awards outside a plan.


25


Table of Contents

Stock-based compensation for the three months ended September 30, 2018 and 2017 was $3,240 and $3,607, respectively, and for the nine months ended September 30, 2018 and 2017 was $10,078 and $10,558, respectively.    

A summary of unrecognized stock-based compensation expense and average remaining vesting period is as follows:


     September 30, 2018  
     Unrecognized Stock-
Based
Compensation
     Average
Remaining
Vesting Period (Years)
 

Employees and directors

   $ 15,974        1.66  

A summary of stock options, restricted stock and restricted stock unit activity for the three months ended September 30, 2018 is as follows:


     Stock
Options
     Restricted
Stock
Awards
     Restricted
Stock
Units
 

Balance at July 1, 2018

     975,537        2,331,946        12,096  

Granted

     —          —          —    

Exercised/vested

     (25,000      (156,752      (1,156

Forfeitures

     —          (37,568      —    


Balance at September 30, 2018

     950,537        2,137,626        10,940  


19. Earnings Per Share

The following tables set forth reconciliations of the basic and diluted earnings per share computations for the periods presented:


     Three Months Ended
September 30,
     Nine Months Ended
September 30,
 
Basic Earnings per Share    2018      2017      2018      2017  

Net income

   $ 22,049      $ 7,976      $ 48,197      $ 26,961  

Less: Income distributed to participating securities

     (507      (175      (1,091      (523

Less: Undistributed income allocable to participating securities

     (1,719      —          (2,518      —    


Net income available to common stockholders

   $ 19,823      $ 7,801      $ 44,588      $ 26,438  

Weighted average common shares (in thousands)

     150,892        134,709        145,149        134,552  


Basic earnings per share

   $ 0.13      $ 0.06      $ 0.31      $ 0.20  


     Three Months Ended
September 30,
     Nine Months Ended
September 30,
 
Diluted Earnings per Share    2018      2017      2018      2017  

Net income

   $ 22,049      $ 7,976      $ 48,197      $ 26,961  


Weighted Average Diluted Shares (in thousands):


Weighted average common shares

     150,892        134,709        145,149        134,552  

Dilutive effect of common stock equivalents

     9,730        1,224        10,435        1,216  


Weighted average diluted shares

     166,622        135,933        155,584        135,768  


Diluted earnings per share

   $ 0.13      $ 0.06      $ 0.31      $ 0.20  


Diluted earnings per share is calculated under the treasury stock and if-converted method and the two-class method and reflects the reduction in earnings per share assuming options or other contracts to issue common stock were exercised or converted into common stock (if dilutive). The calculation that results in the most dilutive earnings per share amount for common stock is reported in the Company’s consolidated financial statements. The Company excluded 1,243,549 and 337,682 common stock equivalents from its computation of diluted earnings per share for the three months ended September 30, 2018 and 2017, respectively, and 1,406,844 and 1,745,469 common stock equivalents from its computation of diluted earnings per share for the nine months ended September 30, 2018 and 2017, respectively, as they were determined to be anti-dilutive.


26


Table of Contents

20. Income Taxes

Effective Income Tax Rate – Three and Nine Months Ended September 30, 2018

The Company’s estimated effective income tax rate for the three months ended September 30, 2018 of 19.9% resulted in income tax expense of $5,481. The Company’s tax rate differs from the federal statutory tax rate of 21% primarily due to the non-taxable gain on revaluation of deferred consideration and a lower tax rate on foreign earnings, partly offset by a valuation allowance on foreign net operating losses and state and local income taxes.

The Company’s estimated effective income tax rate for the nine months ended September 30, 2018 of 24.3% resulted in income tax expense of $15,439. The Company’s tax rate differs from the federal statutory tax rate of 21% primarily due to a valuation allowance on foreign net operating losses, state and local income taxes and non-deductible acquisition-related costs, partly offset by the gain on revaluation of deferred consideration and a lower tax rate on foreign earnings.

Effective Income Tax Rate – Three and Nine Months Ended September 30, 2017

The Company’s estimated effective income tax rate for the three months ended September 30, 2017 of 48.5% resulted in income tax expense of $7,520. The Company’s tax rate differs from the federal statutory tax rate of 35% primarily due to a valuation allowance on foreign net operating losses and state and local income taxes.

The Company’s estimated effective income tax rate for the nine months ended September 30, 2017 of 48.7% resulted in income tax expense of $25,582. The Company’s tax rate differs from the federal statutory tax rate of 35% primarily due to a valuation allowance on foreign net operating losses, tax shortfalls associated with the vesting of stock-based compensation awards and state and local income taxes.

Net Operating Losses – U.S.

The Company’s pre-tax federal net operating losses for tax purposes (“NOLs”) at September 30, 2018 were $3,147, which expire in 2024. The net operating loss carryforwards have been reduced by the impact of annual limitations described in the Internal Revenue Code Section 382 that arose as a result of an ownership change.

Net Operating Losses – International

The Company’s European and Canadian subsidiaries generated NOLs outside the U.S. These tax effected NOLs were $5,747 at September 30, 2018. The Company established a full valuation allowance related to these NOLs as it is more-likely-than-not that some portion, or all, of the deferred tax assets will not be realized.

Deferred Tax Assets

A summary of the components of the Company’s deferred tax assets at September 30, 2018 and December 31, 2017 are as follows:


     September 30,
2018
     December 31,
2017
 

Deferred tax assets:


NOLs – Foreign

   $ 5,747      $ 3,841  

Stock-based compensation

     2,206        1,474  

Deferred rent liability

     1,195        1,257  

NOLs – U.S.

     762        909  

Accrued expenses

     1,611        526  

Other

     207        488  


Deferred tax assets

     11,728        8,495  


Deferred tax liabilities:


Unrealized gains

     1,666        1,718  

Fixed assets

     1,495        1,498  

Goodwill and intangible assets

     522        388  

Prepaid assets

     85        —    


Deferred tax liabilities

     3,768        3,604  


Total deferred tax assets less deferred tax liabilities

     7,960        4,891  

Less: valuation allowance

     (5,747      (3,841


Deferred tax assets, net

   $ 2,213      $ 1,050  


27


Table of Contents

Uncertain Tax Positions

Tax positions are evaluated utilizing a two-step process. The Company first determines whether any of its tax positions are more-likely-than-not to be sustained upon examination, based solely on the technical merits of the position. Once it is determined that a position meets this recognition threshold, the position is measured as the largest amount of benefit that is greater than 50% likely of being realized upon ultimate settlement.

In connection with the ETFS Acquisition, the Company accrued a liability of £18,102 ($25,631) for uncertain tax positions and £3,415 ($4,835) for interest and penalties at the acquisition date. During the three months ended September 30, 2018, the liability for uncertain tax positions and interest penalties at the acquisition date was adjusted by £4,016 ($5,686) and £1,650 ($2,336), respectively.

The table below sets forth the aggregate changes in the balance of gross unrecognized tax benefits:


     Total      Unrecognized
Tax Benefits
     Interest and
Penalties
 

Balance on January 1, 2018

   $ —      $ —      $ —  

Accrued in connection with the ETFS Acquisition

     38,488        31,317        7,171  

Increases

     227        —          227  

Foreign currency translation(1)

     (3,061      (2,491      (570


Balance at September 30, 2018

   $ 35,654      $ 28,826      $ 6,828  


(1)

The gross unrecognized tax benefits were accrued in British pounds sterling.

The Company also recorded an offsetting indemnification asset provided by ETFS Capital as part of its agreement to indemnify the Company for any potential claims, for which an amount is being held in escrow. ETFS Capital has also agreed to provide additional collateral by maintaining a minimum working capital balance up to a stipulated amount. The gross unrecognized tax benefits and interest and penalties totaling $35,654 at September 30, 2018 are included in other non-current liabilities on the Consolidated Balance Sheet. It is expected that the amount of unrecognized tax benefits will change in the next 12 months, however, the Company does not expect the change to have a material impact on its consolidated financial statements.

At September 30, 2018, there were $28,826 of unrecognized tax benefits that, if recognized, would impact the effective tax rate. The recognition of any unrecognized tax benefits would result in an equal and offsetting adjustment to the indemnification asset which would be recorded in income before taxes.

Income Tax Examinations

The Company is subject to U.S. federal income tax as well as income tax of multiple state, local and certain foreign jurisdictions. The tax return for the year ended December 31, 2016 of ManJer, the Company’s Jersey-based subsidiary, is currently under review by the relevant tax authority. The Company is indemnified by ETFS Capital for any potential exposure.

The Company is not currently under audit in any other income tax jurisdictions. As of September 30, 2018, with few exceptions, the Company was no longer subject to income tax examinations by any taxing authority for years before 2014.

21. Shares Repurchased

On October 29, 2014, the Company’s Board of Directors authorized a three-year share repurchase program of up to $100,000. On April 27, 2016, the Board of Directors approved a $60,000 increase to the Company’s share repurchase program and extended the term through April 27, 2019. Included under this program are purchases to offset future equity grants made under the Company’s equity plans and are made in open market or privately negotiated transactions. This authority may be exercised from time to time and in such amounts as market conditions warrant, and subject to regulatory considerations. The timing and actual number of shares repurchased depends on a variety of factors including price, corporate and regulatory requirements, market conditions and other corporate liquidity requirements and priorities. The repurchase program may be suspended or terminated at any time without prior notice. Shares repurchased under this program are returned to the status of authorized and unissued on the Company’s books and records.

As more fully disclosed in Note 3, the Company completed the ETFS Acquisition on April 11, 2018. To partially finance the acquisition, the Company and WisdomTree International entered into a Credit Agreement which contains customary negative covenants, including, among others, a covenant which may restrict the Company’s ability to repurchase equity interests. Share repurchases only are permitted to the extent the Total Leverage Ratio (as defined in the Credit Agreement) does not exceed 1.75 to 1.00 and no event of default (as defined in the Credit Agreement) has occurred and is continuing at the time the share repurchase is made. However, the Company’s ability to purchase shares of its common stock withheld pursuant to the terms of equity awards granted to employees to satisfy tax withholding obligations is not restricted.


28


Table of Contents

During the three and nine months ended September 30, 2018, the Company repurchased 47,816 shares and 135,041 shares of its common stock, respectively, under this program for an aggregate cost of $424 and $1,430, respectively.

During the three and nine months ended September 30, 2017, the Company repurchased 47,317 shares and 401,813 shares of its common stock, respectively, under this program for an aggregate cost of $484 and $4,178, respectively.

As of September 30, 2018, $87,184 remains under this program for future purchases.

22. Goodwill and Intangible Assets

Goodwill

The table below sets forth goodwill by reporting unit. Goodwill allocated to the U.S. Business reporting unit is tested annually for impairment on April 30th. Goodwill allocated to the European Business reporting unit is tested annually for impairment on November 30th.


     Reporting Unit         
     European
Business(1)
    
U.S. Business
     Total  

Balance at January 1, 2018

   $ —      $ 1,799      $ 1,799  

Increases/(decreases)

     84,057        —          84,057  


Balance at September 30, 2018

   $ 84,057      $ 1,799      $ 85,856  


(1)

Europe is included in the Company’s International Business reportable segment.

Goodwill allocated to the U.S. Business reporting unit was tested for impairment on April 30, 2018. The fair value of the reporting unit exceeded its carrying value and therefore no impairment was recognized.

European Business Reporting Unit—ETFS Acquisition

As more fully disclosed in Note 3, the Company completed the ETFS Acquisition on April 11, 2018. In connection with the acquisition, the Company recognized $84,057 of goodwill which was allocated to the European Business reporting unit. The goodwill represents the value of expected synergies created from combining the operations of ETFS and the Company. The goodwill is not deductible for tax purposes as the transaction was structured as a stock acquisition occurring in the United Kingdom.    

U.S. Business Reporting Unit—WisdomTree Continuous Commodity Index Fund

Effective January 1, 2016, the Company acquired the outstanding membership interest in GreenHaven Commodity Services, LLC, the managing owner of the Greehaven Continuous Commodity Index Fund (renamed the WisdomTree Continuous Commodity Index Fund, or “GCC”). In connection with the acquisition, the Company recognized $1,799 of goodwill which was allocated to the U.S Business reporting unit. The goodwill primarily represents the potential future performance of the fund and is deductible for tax purposes.


29


Table of Contents

Intangible Assets (Indefinite-Lived)


     Advisory
Agreements

(ETFS)
     Advisory
Agreements
(Questrade AUM)
     Advisory
Agreement

(GCC)
     Total  

Balance at January 1, 2018

   $ —        $ 2,132      $ 9,953      $ 12,085  

Foreign currency translation

     —          (58      —          (58

Other increases/(decreases)

     601,247        —          —          601,247  


Balance at September 30, 2018

   $ 601,247      $ 2,074      $ 9,953      $ 613,274  


ETFS

In connection with the ETFS Acquisition which was completed on April 11, 2018 (see Note 3), the Company identified intangible assets valued at $601,247 related to the right to manage AUM through customary advisory agreements. The fair value of the intangible assets was determined using an income approach (discounted cash flow analysis) which relied upon significant unobservable inputs including a revenue growth multiple of 3% to 4% and a weighted average cost of capital of 11.6%. The intangible assets were determined to have indefinite useful lives and are not deductible for tax purposes. The Company has designated November 30th as its annual impairment testing date for these intangible assets.

Questrade ETFs

During the fourth quarter of 2017, the Company acquired a suite of eight Canadian listed ETFs from Questrade, Inc. (the “Questrade ETFs”) with approximately CAD $99,108 (USD $77,403) in AUM at closing. The purchase price was CAD $2,675 (USD $2,132), all of which was allocated to the Company’s right to manage AUM in the form of advisory contracts. This intangible asset is translated based on the end of period exchange rates from local currency to U.S. dollars.

Most of the Questrade ETFs were merged into the Company’s existing Canadian listed ETFs. The intangible assets (which are deductible for tax purposes) were determined to have an indefinite useful life. The Company has designated November 30th as its annual impairment testing date for these intangible assets.

GCC

As part of the GreenHaven acquisition which occurred on January 1, 2016, the Company identified an intangible asset valued at $9,953 related to its customary advisory agreement with GCC. This intangible asset (which is deductible for tax purposes) was determined to have an indefinite useful life. The Company has designated November 30th as its annual impairment testing date for this indefinite-lived intangible asset.

23. Segment Reporting

The Company operates as an ETP sponsor and asset manager providing investment advisory services globally. These activities are reported in the Company’s U.S. Business and International Business reportable segments. The International Business reportable segment includes the results of the Company’s European operations and Canadian operations.


30


Table of Contents

Information concerning these reportable segments are as follows:


     Three Months Ended
September 30,
     Nine Months Ended
September 30,
 
     2018      2017      2018      2017  

U.S. Business Segment


Operating revenues


Advisory fees

   $ 50,216      $ 54,749      $ 158,665      $ 159,417  

Other income

     173        140        482        371  


Total operating revenues

   $ 50,389      $ 54,889      $ 159,147      $ 159,788  


Total operating expenses

   $ (33,774    $ (36,846    $ (115,442    $ (107,023


Other income/(expenses)


Interest expense

   $ (196    $ —        $ (369    $ —    

Interest income

     719        772        2,293        1,999  

Settlement gain

     —          —          —          6,909  

Other gains and losses, net

     318        (322      26        39  


Total other income

   $ 841      $ 450      $ 1,950      $ 8,947  


Total income before taxes (U.S. Business Segment)

   $ 17,456      $ 18,493      $ 45,655      $ 61,712  


International Business Segment (1)


Operating revenues


Advisory fees

   $ 21,463      $ 2,544      $ 45,248      $ 6,760  

Other income

     718        281        1,854        774  


Total operating revenues

   $ 22,181      $ 2,825      $ 47,102      $ 7,534  


Total operating expenses

   $ (17,088    $ (5,644    $ (41,347    $ (16,447


Other income/(expenses)


Interest expense

   $ (2,551    $ —        $ (4,734    $ —    

Interest income

     —          —          —          —    

Gain on revaluation of deferred consideration

     7,732        —          17,630        —    

Other gains and losses, net

     (200      (178      (670      (256


Total other income/(expenses)

   $ 4,981      $ (178    $ 12,226      $ (256


Total income/(loss) before taxes (International Business Segment)

   $ 10,074      $ (2,997    $ 17,981      $ (9,169


Income/(loss) before taxes


U.S. Business segment

   $ 17,456      $ 18,493      $ 45,655      $ 61,712  

International Business segment

     10,074        (2,997      17,981        (9,169


Total income before taxes

   $ 27,530      $ 15,496      $ 63,636      $ 52,543  


Assets are not reported by segment as such information is not utilized by the chief operating decision maker.


(1)

The financial results of ETFS are included in the International Business reportable segment as of April 11, 2018.

24. Subsequent Events

The Company evaluated subsequent events through the date of issuance of the accompanying consolidated financial statements. There were no events requiring disclosure.    


31


Table of Contents

ITEM 2. MANAGEMENT’S DISCUSSION AND ANALYSIS OF FINANCIAL CONDITION AND RESULTS OF OPERATIONS

The following discussion and analysis of our financial condition and results of operations should be read together with our consolidated financial statements and the related notes and the other financial information included elsewhere in this Report. In addition to historical consolidated financial information, the following discussion contains forward-looking statements that reflect our plans, estimates and beliefs. Our actual results could differ materially from those discussed in the forward-looking statements. Factors that could cause or contribute to these differences include those discussed below. For a more complete description of the risks noted above and other risks that could cause our actual results to materially differ from our current expectations, please see Item 1A “Risk Factors” in our Annual Report on Form 10-K for the fiscal year ended December 31, 2017 and Quarterly Report on Form 10-Q for the quarter ended March 31, 2018. We assume no obligation to update or revise publicly any forward-looking statements, whether as a result of new information, future events or otherwise, unless required by law.

Executive Summary

Introduction

We are the only publicly-traded asset management company that focuses exclusively on ETPs and are one of the leading ETP sponsors in the world based on assets under management, or AUM, with AUM of $59.1 billion globally as of September 30, 2018. An ETP is a pooled investment vehicle that holds a basket of securities, financial instruments or other assets and generally seeks to track (index-based) or outperform (actively managed) the performance of a broad or specific equity, fixed income or alternatives market segment, commodity or currency (or an inverse or multiple thereof). ETPs are listed on an exchange with their shares traded in the secondary market at market prices, generally at approximately the same price as the net asset value of their underlying components. ETP is an umbrella term that includes ETFs, exchange-traded notes and exchange-traded commodities.

On November 13, 2017, we entered into a Share Sale Agreement as amended by the Waiver and Variation Agreement, dated April 11, 2018 (collectively referred to as the “Share Sale Agreement”) with ETFS Capital Limited (“ETFS Capital,” formerly known as ETF Securities Limited) and WisdomTree International Holdings Ltd, an indirect wholly owned subsidiary of ours (“WisdomTree International”), pursuant to which we agreed to acquire the European exchange-traded commodity, currency and short-and-leveraged business, or ETFS, of ETFS Capital. On April 11, 2018, we completed the acquisition of ETFS, or the ETFS Acquisition, by purchasing the entire issued share capital of a subsidiary of ETFS Capital into which ETFS Capital transferred ETFS prior to completion of the ETFS Acquisition. ETFS had approximately $17.6 billion of AUM as of April 10, 2018. The ETFS Acquisition elevated us to the ninth largest ETP sponsor globally and the largest global independent ETP provider based on AUM, with significant scale and presence in the U.S. and Europe, the two largest ETP markets.

Our U.S. listed ETFs make up a majority of our global AUM. Our family of ETFs include funds that track our own indexes, funds that track third-party indexes and actively managed funds. We distribute our ETFs through all major channels within the asset management industry, including brokerage firms, registered investment advisers and institutional investors.

We focus on creating ETFs for investors that offer thoughtful innovation, smart engineering and redefined investing. Most of our index-based funds employ a fundamentally weighted investment methodology, which weights securities on the basis of factors such as dividends or earnings, whereas most other ETF industry indexes use a capitalization weighted methodology. We also offer actively managed ETFs, which are ETFs that are not based on a particular index but rather are actively managed with complete transparency into the ETF’s portfolio on a daily basis. Our broad exemptive relief enables us to use our own indexes for certain of our ETFs and actively manage other ETFs.

We strive to deliver a better investing experience through innovative solutions. Recent investments in technology-enabled services and the launch of our Advisor Solutions program in October 2017, which includes portfolio construction, asset allocation, practice management services and wealth management technology via the AdvisorEngine platform, have been made to differentiate us in the market, expand our distribution and further enhance our relationships with financial advisors.


32


Table of Contents

Assets Under Management

WisdomTree ETPs

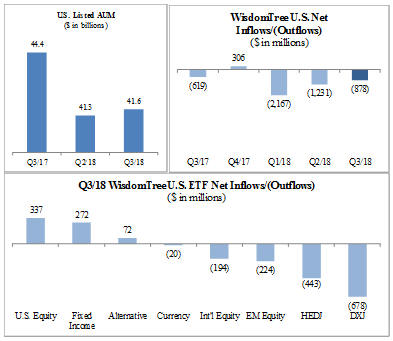
The following chart sets forth the asset mix of our WisdomTree ETPs as of September 30, 2018:


LOGO

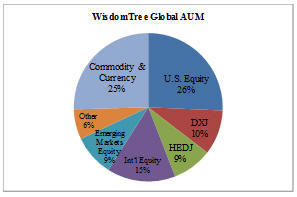
A significant portion of our AUM is held in ETFs that invest in foreign securities. Therefore, our AUM and revenues are affected by movements in global capital market levels and the strengthening or weakening of the U.S. dollar against other currencies. As the chart above reflects, as of September 30, 2018, approximately 19% of our AUM was concentrated in two products with similar strategies – HEDJ, our European equity ETF which hedges exposure to the Euro, and DXJ, our Japanese equity ETF which hedges exposure to the Yen. The strengthening of the Euro or Yen against the U.S. dollar, or the decline in European or Japanese equity markets, may have an adverse effect on our results.

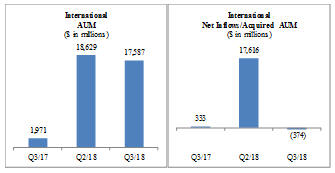
The addition of the AUM of ETFS improves both fund and investment theme concentrations, resulting in a well-diversified mix with immediate scale in commodities and an industry leading position in European listed gold products. These products historically have been negatively correlated with our two largest ETFs, HEDJ and DXJ, and therefore we may experience improved stability of AUM and lower overall AUM volatility. However, we have not recently experienced lower overall AUM volatility and can provide no assurance that the negative historical correlation between the AUM of ETFS and the AUM of our two largest ETFs will be experienced in the future.

As a result of the ETFS Acquisition, our client base has been further diversified with increased exposure to European domiciled investors, commodity focused investors and new-to-firm clients. In addition, our average global ETP advisory fee has declined 0.02, from 0.50% to 0.48% at September 30, 2017 and September 30, 2018, respectively, due to the ETFS Acquisition and change in product mix.

Market Environment

Overview

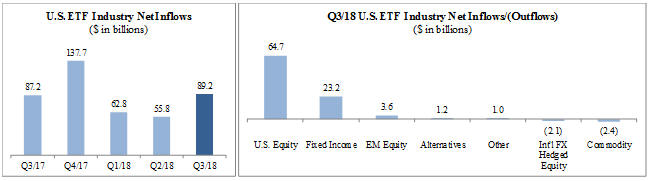
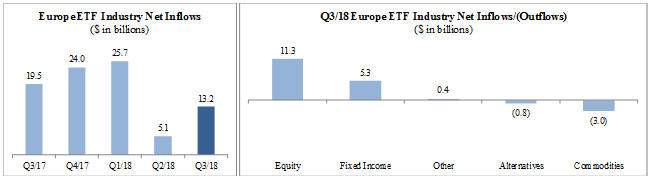
Performance of the U.S. markets remained robust in the third quarter as the strength of the economy continued to overshadow uncertainty arising from U.S. trade policies toward China and other trading partners. The Japan markets also performed favorably as a weakening of the Japanese yen improved market sentiment, while performance of the European markets was relatively modest. The continued strengthening of the U.S. dollar and rising interest rates weighed on emerging markets and the price of gold.

The S&P 500 rose 7.7%, MSCI EAFE (local currency) rose 2.4%, MSCI Emerging Markets Index (U.S. dollar) declined 0.1% and gold prices declined 5.1% during the third quarter. In addition, the European and Japan equity markets both appreciated with the MSCI EMU Index rising 0.5% and MSCI Japan Index rising 6.5%, respectively, in local currency terms for the quarter. Also, the U.S. dollar strengthened 2.8% versus the Yen and 0.7% versus the Euro during the third quarter.


33


Table of Contents

U.S. listed ETF Industry Flows

Our U.S. listed ETFs make up a majority of our global AUM. As the charts below reflect, industry flows for the third quarter of 2018 were $89.2 billion. U.S. equity and fixed income gathered the majority of those flows.


LOGO

Source: Bloomberg, Investment Company Institute, WisdomTree

European listed ETF Industry Flows

As the chart below reflects, European listed ETF net flows for the third quarter were $13.2 billion. Equity and fixed income gathered the majority of those flows.


LOGO

Source: Bloomberg, WisdomTree

Business Segments

We operate as an ETP sponsor and asset manager providing investment advisory services globally. These activities are reported in our U.S. Business and International Business segments. The International Business segment includes our European business (which now includes ETFS) and our Canadian business.

Restructuring of Distribution Strategy in Japan

Our U.S. Business has included our Japanese sales office, WisdomTree Japan Inc., or WTJ, which engaged in selling our U.S. listed ETFs to Japanese institutions. In July 2018, the Company determined to restructure its distribution strategy in Japan and has expanded its existing relationship with a third party to manage distribution of WisdomTree ETFs in Japan. As a result, the Company will close WTJ. During the three and nine months ended September 30, 2018 and 2017, WTJ reported operating losses of the following:


     Three Months Ended
September 30,
     Nine Months Ended
September 30,
 
     2018      2017      2018      2017  

Operating losses - WTJ

   $  1,342      $  1,085      $  3,698      $  3,447  


34


Table of Contents

Our Operating and Financial Results

U.S. Business Segment

Our U.S. listed ETFs’ AUM increased from $41.3 billion at June 30, 2018 to $41.6 billion at September 30, 2018 primarily due to market appreciation, largely offset by net outflows from our two largest ETFs, DXJ and HEDJ.


LOGO

International Business Segment

In the second quarter of 2018, we acquired $17.6 billion of AUM in connection with the ETFS Acquisition. Our international ETFs’ AUM decreased from $18.6 billion at June 30, 2018 to $17.6 billion at September 30, 2018 due to market depreciation and net outflows.


LOGO


35


Table of Contents

Consolidated Operating Results

The following table sets forth our revenues and net income for the most recent five quarters. Prior period amounts previously disclosed have been reclassified to conform with our current presentation. These reclassifications had no effect on previously reported net income.


LOGO


Revenues – Total operating revenues increased 25.7% from the three months ended September 30, 2017 to $72.6 million due to an increase in our average global AUM. Our average global AUM increased primarily due to the $17.6 billion of AUM acquired in connection with the ETFS Acquisition as well as net inflows into certain of our ETFs. These increases were partly offset by outflows from our two largest U.S. listed ETFs.


Expenses – Total operating expenses increased 19.7% from the three months ended September 30, 2017 to $50.9 million primarily due to the ETFS Acquisition.


Other Income/(Expenses) – Other income/(expense) includes interest income and interest expense, gains/(losses) on revaluation of deferred consideration and other gains and losses. These items are further described below.


Net income – Net income increased 176.4% from the three months ended September 30, 2017 to $22.0 million.


36


Table of Contents

Key Operating Statistics

The following table presents key operating statistics that serve as indicators for the performance of our business:


     Three Months Ended     Nine Months Ended  
     September 30,
2018
    June 30,
2018
    September 30,
2017
    September 30,
2018
    September 30,
2017
 

U.S. LISTED ETFs (in millions)


Beginning of period assets

   $ 41,340     $ 42,886     $  43,183     $ 46,827     $ 40,164  

Inflows/(outflows)

     (878     (1,231     (619     (4,276     (72

Market appreciation/(depreciation)

     1,094       (315     1,834       (995     4,306  


End of period assets

   $ 41,556     $ 41,340     $ 44,398     $ 41,556     $ 44,398  


Average assets during the period

   $ 41,555     $ 43,464     $ 43,523     $ 43,546     $ 42,592  

Average ETF advisory fee during the period

     0.48     0.49     0.50     0.49     0.50

Revenue days

     92       91       92       273       273  

Number of ETFs – end of the period

     84       81       87       84       87  

INTERNATIONAL LISTED ETPs (in millions)


Beginning of period assets

   $ 18,629     $ 2,075     $ 1,547     $ 2,110     $ 1,093  

Assets acquired

     —         17,641       —         17,641       —    

Inflows/(outflows)

     (374     (25     333       (446     823  

Market appreciation/(depreciation)

     (668     (1,062     91       (1,718     55  


End of period assets

   $ 17,587     $ 18,629     $ 1,971     $ 17,587     $ 1,971  


Average assets during the period

   $ 17,905     $ 17,837     $ 1,693     $ 12,616     $ 1,473  

Average ETP advisory fee during the period

     0.48     0.47     0.60     0.48     0.60

Revenue days

     92       91       92       273       273  

Number of ETPs—end of period

     451       445       96       451       96  

PRODUCT CATEGORIES (in millions)


International Developed Market Equity


Beginning of period assets

   $ 20,331     $ 22,432     $ 24,647     $ 25,950     $ 23,105  

Inflows/(outflows)

     (1,289     (1,502     (550     (5,490     (681

Market appreciation/(depreciation)

     660       (599     1,177       (758     2,850  


End of period assets

   $ 19,702     $ 20,331     $ 25,274     $ 19,702     $ 25,274  


Average assets during the period

   $ 19,907     $ 22,455     $ 24,704     $ 22,268     $ 24,421  

Commodity & Currency


Beginning of period assets

   $ 16,167     $ 416     $ 464     $ 445     $ 564  

Assets acquired

     —         16,778       —         16,778       —    

Inflows/(outflows)

     (434     (99     (1     (561     (87

Market appreciation/(depreciation)

     (682     (928     2       (1,611     (12


End of period assets

   $ 15,051     $ 16,167     $ 465     $ 15,051     $ 465  


Average assets during the period

   $ 15,384     $ 15,316     $ 468     $ 10,375     $ 500  

U.S. Equity


Beginning of period assets

   $ 14,301     $ 13,359     $ 12,888     $ 14,234     $ 12,111  

Inflows/(outflows)

     347       114       (227     508       240  

Market appreciation/(depreciation)

     539       828       500       445       810  


End of period assets

   $ 15,187     $ 14,301     $ 13,161     $ 15,187     $ 13,161  


Average assets during the period

   $ 14,950     $ 14,021     $ 12,882     $ 14,364     $ 12,618  

Emerging Market Equity


Beginning of period assets

   $ 5,643     $ 6,289     $ 4,828     $ 5,887     $ 3,917  

Inflows/(outflows)

     (216     (120     241       90       588  

Market appreciation/(depreciation)

     (81     (526     205       (631     769  


End of period assets

   $ 5,346     $ 5,643     $ 5,274     $ 5,346     $ 5,274  


Average assets during the period

   $ 5,548     $ 6,116     $ 5,141     $ 5,974     $ 4,713  


37


Table of Contents

Leveraged & Inverse


Beginning of period assets

   $ 1,531     $ 872     $ 809     $ 930     $ 624  

Assets acquired

     —         863       —         863       —    

Inflows/(outflows)

     (61     (71     130       (265     393  

Market appreciation/(depreciation)

     (25     (133     37       (83     (41


End of period assets

   $ 1,445     $ 1,531     $ 976     $ 1,445     $ 976  


Average assets during the period

   $ 1,489     $ 1,592     $ 867     $ 1,319     $ 768  

Fixed Income


Beginning of period assets

   $ 1,411     $ 1,101     $ 620     $ 862     $ 504  

Inflows/(outflows)

     329       349       86       930       182  

Market appreciation/(depreciation)

     (2     (39     16       (54     36  


End of period assets

   $ 1,738     $ 1,411     $ 722     $ 1,738     $ 722  


Average assets during the period

   $ 1,554     $ 1,230     $ 659     $ 1,268     $ 601  

Alternatives


Beginning of period assets

   $ 578     $ 492     $ 404     $ 582     $ 287  

Inflows/(outflows)

     72       66       40       68       158  

Market appreciation/(depreciation)

     24       20       4       24       3  


End of period assets

   $ 674     $ 578     $ 448     $ 674     $ 448  


Average assets during the period

   $ 628     $ 564     $ 427     $ 579     $ 351  

Closed ETPs


Beginning of period assets

   $ 7     $ —     $ 70     $ 47     $ 145  

Inflows/(outflows)

     —         7       (5     (2     (42

Market appreciation/(depreciation)

     (7     —         (16     (45     (54


End of period assets

   $ —     $ 7     $ 49     $ —     $ 49  


Average assets during the period

   $ —     $ 7     $ 68     $ 15     $ 93  

Headcount: U.S. Business Segment

     151       155       165       151       165  

Headcount: International Business Segment

     76       76       43       76       43  

Note: Previously issued statistics may be restated due to trade adjustments

Source: WisdomTree


38


Table of Contents

Three Months Ended September 30, 2018 Compared to Three Months Ended September 30, 2017

Selected Operating and Financial Information


     Three Months Ended
September 30,
     Change      Percent
Change
 
     2018      2017  

Global AUM (in millions)


Average global AUM

   $  59,460      $  45,216      $  14,244        31.5


Operating Revenues (in thousands)


Advisory fees

   $ 71,679      $ 57,293      $ 14,386        25.1

Other income

     891        421        470        111.6


Total revenues

   $ 72,570      $ 57,714      $ 14,856        25.7


Average Global AUM

Our average global AUM increased 31.5% from $45.2 billion in the three months ended September 30, 2017 to $59.5 billion in the comparable period in 2018 primarily due to the $17.6 billion of AUM acquired in connection with the ETFS Acquisition as well as net inflows into certain of our ETFs. These increases were partly offset by outflows from our two largest U.S. listed ETFs.

Operating Revenues

Advisory fees

Advisory fees increased 25.1% from $57.3 million in the three months ended September 30, 2017 to $71.7 million in the comparable period in 2018 primarily due to an increase in our average global AUM. Our average global ETP advisory fee has declined 0.02, from 0.50% to 0.48% at September 30, 2017 and September 30, 2018, respectively, due to the ETFS Acquisition and change in product mix.

Other income

Other income increased 111.6% from $0.4 million in the three months ended September 30, 2017 to $0.9 million in the comparable period in 2018 primarily due to creation/redemption fees earned from the ETFS exchange-traded products.

Operating Expenses


     Three Months Ended
September 30,
     Change      Percent
Change
 
(in thousands)    2018      2017  

Compensation and benefits

   $ 17,544      $ 19,492      $ (1,948      (10.0 %) 

Fund management and administration

     15,292        10,862        4,430        40.8

Marketing and advertising

     3,239        3,314        (75      (2.3 %) 

Sales and business development

     3,801        3,617        184        5.1

Contractual gold payments

     2,880        —          2,880        n/a  

Professional and consulting fees

     1,934        1,035        899        86.9

Occupancy, communications and equipment

     1,722        1,378        344        25.0

Depreciation and amortization

     306        353        (47      (13.3 %) 

Third-party distribution fees

     1,407        710        697        98.2

Acquisition-related costs

     456        —          456        n/a  

Other

     2,281        1,729        552        31.9


Total expenses

   $  50,862      $  42,490      $  8,372        19.7


     Three Months Ended
September 30,
 

As a Percent of Revenues:

   2018     2017  

Compensation and benefits

     24.2     33.8

Fund management and administration

     21.1     18.8

Marketing and advertising

     4.4     5.7

Sales and business development

     5.2     6.3

Contractual gold payments

     4.0     n/a  


39


Table of Contents
     Three Months Ended
September 30,
 

As a Percent of Revenues:

   2018     2017  

Professional and consulting fees

     2.7     1.8

Occupancy, communications and equipment

     2.4     2.4

Depreciation and amortization

     0.4     0.6

Third-party distribution fees

     2.0     1.2

Acquisition-related costs

     0.6     n/a  

Other

     3.1     3.0


Total expenses

     70.1     73.6


Compensation and benefits

Compensation and benefits expense decreased 10.0% from $19.5 million in the three months ended September 30, 2017 to $17.5 million in the comparable period in 2018 due to lower incentive compensation within our U.S. Business segment, partly offset by higher compensation of our International Business segment due to the ETFS Acquisition. Headcount of our U.S. Business segment was 151 and 165 and our International Business segment was 76 and 43 at September 30, 2018 and 2017, respectively.

Fund management and administration

Fund management and administration expense increased 40.8% from $10.9 million in the three months ended September 30, 2017 to $15.3 million in the comparable period in 2018 due to higher average AUM of our International Business segment primarily associated with the ETFS Acquisition. We had 84 and 87 U.S. listed ETFs and 451 and 96 International listed ETPs at September 30, 2018 and 2017, respectively.

Marketing and advertising

Marketing and advertising expense was essentially unchanged from the three months ended September 30, 2017.

Sales and business development

Sales and business development expense was essentially unchanged from the three months ended September 30, 2017.

Contractual gold payments

Contractual gold payments expense was $2.9 million during the three months ended September 30, 2018, which was associated with the payment of 2,375 ounces of gold at an average daily spot price of $1,213 per ounce. See Note 11 to our Consolidated Financial Statements for further information.

Professional and consulting fees

Professional and consulting fees increased 86.9% from $1.0 million in the three months ended September 30, 2017 to $1.9 million in the comparable period in 2018 due to higher professional and corporate consulting-related expenses in our U.S. Business segment.

Occupancy, communications and equipment

Occupancy, communications and equipment expense increased 25.0% from $1.4 million in the three months ended September 30, 2017 to $1.7 million in the comparable period in 2018 primarily due to office space associated with the ETFS Acquisition, as well as higher real estate taxes.

Depreciation and amortization

Depreciation and amortization expense of $0.3 million was essentially unchanged from the three months ended September 30, 2017.

Third-party distribution fees

Third-party distribution fees increased 98.2% from $0.7 million in the three months ended September 30, 2017 to $1.4 million in the comparable period in 2018 primarily due to a new distribution relationship announced in the fourth quarter of 2017.


40


Table of Contents

Acquisition-related costs

During the three months ended September 30, 2018, we incurred acquisition-related costs of $0.5 million which were primarily associated with the integration of ETFS.

Other

Other expenses increased 31.9% from $1.7 million in the three months ended September 30, 2017 to $2.3 million in the comparable period in 2018 primarily due to higher International Business segment office expenses associated with an increase in headcount from the ETFS Acquisition.

Other Income/(Expenses)


     Three Months Ended
September 30,
     Change      Percent
Change
 
(in thousands)    2018      2017  

Interest expense

   $  (2,747    $  —      $  (2,747      n/a  

Gain on revaluation of deferred consideration

     7,732        —          7,732        n/a  

Interest income

     719        772        (53      (6.9 %) 

Other gains and losses, net

     118        (500      618        n/a  


Total other income/(expenses)

   $ 5,822      $ 272      $ 5,550        2,040.4


     Three Months Ended
September 30,
 

As a Percent of Revenues:

   2018     2017  

Interest expense

     (3.8 %)      n/a  

Gain on revaluation of deferred consideration

     10.7     n/a  

Interest income

     1.0     1.3

Other gains and losses, net

     0.1     (0.9 %) 


Total other income/(expenses)

     8.0     0.4


Interest expense

Interest expense for the three months ended September 30, 2018 of $2.7 million was incurred principally in connection with the $200.0 million term loan (the “Term Loan”) to facilitate the ETFS Acquisition. Our effective interest rate during the period was 5.1% and includes our cost of borrowing and amortization of issuance costs.

Gain on revaluation of deferred consideration

We recognized a gain on revaluation of deferred consideration of $7.7 million during the three months ended September 30, 2018 as the price of gold has declined when compared to June 30, 2018, the date in which the deferred consideration was last measured. The magnitude of the gain recognized is highly correlated to the magnitude of the change in the price of gold. See Note 11 to our Consolidated Financial Statements for further information.

Interest income

Interest income of $0.7 million was essentially unchanged from the three months ended September 30, 2017.

Other gains and losses, net

Other net gains of $0.1 million recognized in the third quarter of 2018 arose from the recognition of an insurance claim reimbursement, partly offset by miscellaneous foreign exchange losses. We reported other net losses of $0.5 million in the third quarter of 2017 which were primarily associated with our short-term investment grade bond portfolio and miscellaneous foreign exchange losses.

Income taxes

Our estimated effective income tax rate for the three months ended September 30, 2018 of 19.9% resulted in income tax expense of $5.5 million. Our tax rate differs from the federal statutory tax rate of 21% primarily due to the non-taxable gain on revaluation of deferred consideration and a lower tax rate on foreign earnings, partly offset by a valuation allowance on foreign net operating losses and state and local income taxes.


41


Table of Contents

Our estimated effective income tax rate for the three months ended September 30, 2017 of 48.5% resulted in income tax expense of $7.5 million. The Company’s tax rate differs from the federal statutory tax rate of 35% primarily due to a valuation allowance on foreign net operating losses and state and local income taxes.

Nine Months Ended September 30, 2018 Compared to Nine Months Ended September 30, 2017

Selected Operating and Financial Information


     Nine Months Ended
September 30,
     Change      Percent
Change
 
     2018      2017  

Global AUM (in millions)


Average global AUM

   $ 56,162      $ 44,065      $  12,097        27.5


Operating Revenues (in thousands)


Advisory fees

   $  203,913      $  166,177      $ 37,736        22.7

Other income

     2,336        1,145        1,191        104.0


Total revenues

   $ 206,249      $ 167,322      $ 38,927        23.3


Average Global AUM

Our average global AUM increased 27.5% from $44.1 billion in the nine months ended September 30, 2017 to $56.2 billion in the comparable period in 2018 primarily due to the $17.6 billion of AUM acquired in connection with the ETFS Acquisition as well as net inflows into certain of our ETFs. These increases were partly offset by outflows from our two largest U.S. listed ETFs and market depreciation.

Operating Revenues

Advisory fees

Advisory fees increased 22.7% from $166.2 million in the nine months ended September 30, 2017 to $203.9 million in the comparable period in 2018 primarily due to an increase in our average global AUM.

Other income

Other income increased 104.0% from $1.1 million in the nine months ended September 30, 2017 to $2.3 million in the comparable period in 2018 primarily due to creation/redemption fees earned from the ETFS exchange-traded products.

Operating Expenses


     Nine Months Ended
September 30,
     Change      Percent
Change
 
(in thousands)    2018      2017  

Compensation and benefits

   $ 55,677      $ 55,787      $ (110      (0.2 %) 

Fund management and administration

     40,825        30,574        10,251        33.5

Marketing and advertising

     10,212        10,676        (464      (4.3 %) 

Sales and business development

     12,117        9,968        2,149        21.6

Contractual gold payments

     5,595        —          5,595        n/a  

Professional and consulting fees

     5,130        3,814        1,316        34.5

Occupancy, communications and equipment

     4,659        4,102        557        13.6

Depreciation and amortization

     998        1,042        (44      (4.2 %) 

Third-party distribution fees

     4,798        2,312        2,486        107.5

Acquisition-related costs

     10,446        —          10,446        n/a  

Other

     6,332        5,195        1,137        21.9


Total expenses

   $  156,789      $  123,470      $  33,319        27.0


42


Table of Contents
     Nine Months Ended
September 30,
 

As a Percent of Revenues:

   2018     2017  

Compensation and benefits

     27.0     33.3

Fund management and administration

     19.8     18.3

Marketing and advertising

     5.0     6.4

Sales and business development

     5.9     6.0

Contractual gold payments

     2.7     n/a  

Professional and consulting fees

     2.4     2.3

Occupancy, communications and equipment

     2.3     2.4

Depreciation and amortization

     0.4     0.6

Third-party distribution fees

     2.3     1.4

Acquisition-related costs

     5.1     n/a  

Other

     3.1     3.1


Total expenses

     76.0     73.8


Compensation and benefits

Compensation and benefits expense of $55.7 million was essentially unchanged from the nine months ended September 30, 2017 as compensation expense associated with the ETFS Acquisition was offset by lower incentive compensation within our U.S. Business segment.

Fund management and administration

Fund management and administration expense increased 33.5% from $30.6 million in the nine months ended September 30, 2017 to $40.8 million in the comparable period in 2018 due to higher average AUM of our International Business segment primarily associated with the ETFS Acquisition.

Marketing and advertising

Marketing and advertising expense decreased 4.3% from $10.7 million in the nine months ended September 30, 2017 to $10.2 million in the comparable period in 2018 primarily due to lower levels of advertising related activities of our U.S. Business segment, partly offset by higher expenses within our International Business segment.

Sales and business development

Sales and business development expense increased 21.6% from $10.0 million in the nine months ended September 30, 2017 to $12.1 million in the comparable period in 2018 primarily due to higher spending on sales related activities globally.

Contractual gold payments

Contractual gold payments expense was $5.6 million for the nine months ended September 30, 2018 and represents the payment of 4,460 ounces of gold at an average daily spot price of $1,255 per ounce. See Note 11 to our Consolidated Financial Statements for further information.

Professional and consulting fees

Professional and consulting fees increased 34.5% from $3.8 million in the nine months ended September 30, 2017 to $5.1 million in the comparable period in 2018 due to higher professional and corporate consulting-related expenses globally.

Occupancy, communications and equipment

Occupancy, communications and equipment expense increased 13.6% from $4.1 million in the nine months ended September 30, 2017 to $4.7 million in the comparable period in 2018 primarily due to office space associated with the ETFS Acquisition.

Depreciation and amortization

Depreciation and amortization expense of $1.0 million was essentially unchanged from the nine months ended September 30, 2017.


43


Table of Contents

Third-party distribution fees

Third-party distribution fees increased 107.5% from $2.3 million in the nine months ended September 30, 2017 to $4.8 million in the comparable period in 2018 primarily due to a new distribution relationship announced in the fourth quarter of 2017 and higher fees paid to our third-party marketing agent in Latin America.

Acquisition-related costs

During the nine months ended September 30, 2018, we incurred acquisition-related costs associated with the ETFS Acquisition of $10.4 million which included professional advisor fees, severance and other compensation costs, a write-off of our office lease and other integration costs.

Other

Other expenses increased 21.9% from $5.2 million in the nine months ended September 30, 2017 to $6.3 million in the comparable period in 2018 primarily due to higher International Business segment office expenses associated with an increase in headcount from the ETFS Acquisition.

Other Income/(Expenses)


     Nine Months Ended
September 30,
     Change      Percent
Change
 
(in thousands)    2018      2017  

Interest expense

   $  (5,103    $ —      $  (5,103)        n/a  

Gain on revaluation of deferred consideration

     17,630        —          17,630        n/a  

Interest income

     2,293        1,999        294        14.7

Settlement gain

     —          6,909        (6,909      n/a  

Other gains and losses, net

     (644      (217      (427      196.8


Total other income/(expenses)

   $  14,176      $  8,691      $ 5,485        63.1


     Nine Months Ended
September 30,
 

As a Percent of Revenues:

   2018     2017  

Interest expense

     (2.5 %)      n/a  

Gain on revaluation of deferred consideration

     8.5     n/a  

Interest income

     1.1     1.2

Settlement gain

     n/a       4.1

Other gains and losses, net

     (0.3 %)      (0.1 %) 


Total other income/(expenses)

     6.8     5.2


Interest expense

Interest expense was $5.1 million for the nine months ended September 30, 2018. Our effective interest rate during the period was 5.0% and includes our cost of borrowing and amortization of issuance costs.

Gain on revaluation of deferred consideration

We recognized a gain on revaluation of deferred consideration of $17.6 million for the nine months ended September 30, 2018. A gain was recognized during the nine months ended September 30, 2018 as the price of gold has declined when compared to April 11, 2018, the date in which the deferred consideration was initially measured. The magnitude of the gain recognized is highly correlated to the magnitude of the change in the price of gold. See Note 11 to our Consolidated Financial Statements for further information.

Interest income

Interest income increased 14.7% from $2.0 million for the nine months ended September 30, 2017 to $2.3 million for the nine months ended September 30, 2018, primarily due to paid-in-kind interest on a note receivable from AdvisorEngine Inc., partly offset by lower interest income on our short-term investment grade bond portfolio which has matured.


44


Table of Contents

Settlement gain

A settlement gain of $6.9 million was recorded during the nine months ended September 30, 2017 representing the fair value of the preferred stock of Thesys Group, Inc. (“Thesys”) that the Company received in connection with the resolution of a dispute regarding its ownership stake in Thesys, which occurred in June 2017.

Other gains and losses, net

Other net losses for the nine months ended September 30, 2018 was $0.6 million and arose from our short-term investment grade bond portfolio, the sale of gold earned on advisory fees paid by physically-backed gold ETPs and miscellaneous foreign exchange losses. These losses were partly offset by an insurance claim reimbursement.

Other net losses for the nine months ended September 30, 2017 was $0.2 million which included a reimbursement of fund-related costs, partly offset by realized losses on our short-term investment grade bond portfolio and miscellaneous foreign exchange losses.

Income taxes

Our estimated effective income tax rate for the nine months ended September 30, 2018 of 24.3% resulted in income tax expense of $15.4 million. Our tax rate differs from the federal statutory tax rate of 21% primarily due to a valuation allowance on foreign net operating losses, state and local income taxes and non-deductible acquisition-related costs, partly offset by the non-taxable gain on revaluation of deferred consideration and a lower tax rate on foreign earnings.

Our estimated effective income tax rate for the nine months ended September 30, 2017 of 48.7% resulted in income tax expense of $25.6 million. Our tax rate differs from the federal statutory tax rate of 35% primarily due to a valuation allowance on foreign net operating losses, tax shortfalls associated with the vesting of stock-based compensation awards and state and local income taxes.


45


Table of Contents

Segment Results

The table below presents the results of our U.S. Business and International Business reportable segments.


     Three Months Ended
September 30,
    Nine Months Ended
September 30,
 
     2018     2017     2018     2017  

U.S. Business Segment


Operating revenues


Advisory fees

   $  50,216     $  54,749     $  158,665     $  159,417  

Other income

     173       140       482       371  


Total operating revenues

   $ 50,389     $ 54,889     $ 159,147     $ 159,788  


Total operating expenses

   $  (33,774   $  (36,846   $  (115,442   $  (107,023


Other income/(expenses)


Interest expense

   $ (196   $ —       $ (369   $ —    

Interest income

     719       772       2,293       1,999  

Settlement gain

     —         —         —         6,909  

Other gains and losses, net

     318       (322     26       39  


Total other income

   $ 841     $ 450     $ 1,950     $ 8,947  


Total income before taxes (U.S. Business Segment)

   $ 17,456     $ 18,493     $ 45,655     $ 61,712  


Average assets during the period (in millions)

   $ 41,555     $ 43,523     $ 43,546     $ 42,592  

Average ETF advisory fee during the period

     0.48     0.50     0.49     0.50

International Business Segment


Operating revenues


Advisory fees

   $ 21,463     $ 2,544     $ 45,248     $ 6,760  

Other income

     718       281       1,854       770  


Total operating revenues

   $ 22,181     $ 2,825     $ 47,102     $ 7,534  


Total operating expenses

   $ (17,088   $ (5,644   $ (41,347   $ (16,447


Other income/(expenses)


Interest expense

   $ (2,551   $ —       $ (4,734   $ —    

Interest income

     —         —         —         —    

Gain on revaluation of deferred consideration

     7,732       —         17,630       —    

Other gains and losses, net

     (200     (178     (670     (256


Total other income/(expenses)

   $ 4,981     $ (178   $ 12,226     $ (256


Total income/(loss) before taxes (International Business Segment)

   $ 10,074     $ (2,997   $ 17,981     $ (9,169


Average assets during the period (in millions)

   $ 17,905     $ 1,693     $ 12,616     $ 1,473  

Average ETP advisory fee during the period

     0.48     0.60     0.48     0.60

Income/(loss) before taxes


U.S. Business segment

   $ 17,456     $ 18,493     $ 45,655     $ 61,712  

International Business segment

     10,074       (2,997     17,981       (9,169


Total income before taxes

   $ 27,530     $ 15,496     $ 63,636     $ 52,543  


46


Table of Contents

Three Months Ended September 30, 2018 Compared to Three Months Ended September 30, 2017

U.S. Business segment

Operating revenues of the U.S. Business segment declined 8.2% from $54.9 million in the three months ended September 30, 2017 to $50.4 million in the comparable period in 2018. The decrease was due to lower average AUM and lower average U.S. listed advisory fees due to a change in product mix. Our average U.S. listed ETF advisory fee was 0.48% and 0.50% during the three months ended September 30, 2018 and September 30, 2017, respectively.

Operating expenses of the U.S. Business segment declined 8.3% from $36.8 million in the three months ended September 30, 2017 to $33.8 million in the comparable period in 2018 primarily due to lower incentive compensation and lower sales and business development. These decreases were partly offset by higher professional fees and higher third-party distribution fees. Headcount of our U.S. Business segment was 165 and 151 at September 30, 2017 and 2018, respectively.

Other income, net of the U.S. Business segment increased by 86.9%, from $0.5 million in the three months ended September 30, 2017 to $0.8 million in the comparable period in 2018, largely due to an insurance claim reimbursement recognized in the current period coupled with realized losses on our short-term investment grade bond portfolio recognized in the prior year.    

International Business segment

Operating revenues of the International Business segment increased $19.4 million, from $2.8 million in the three months ended September 30, 2017 to $22.2 million in the comparable period in 2018. This increase was attributable to higher average AUM primarily due to the $17.6 billion of AUM acquired in connection with the ETFS Acquisition.

Operating expenses of the International Business segment increased 202.8% from $5.6 million in the three months ended September 30, 2017 to $17.1 million in the comparable period in 2018, primarily due to the ETFS Acquisition. Fund management and administration expense and compensation expense increased due to higher average AUM and higher headcount, respectively. In addition, during the three months ended September 30, 2018 we recognized contractual gold payments expense of $2.9 million. Headcount of our International Business segment was 43 and 76 at September 30, 2017 and 2018, respectively.

Other income, net of the International Business segment was $5.0 million for the three months ended September 30, 2018, which was comprised of a gain on revaluation of deferred consideration of $7.7 million, partly offset by interest expense of $2.6 million incurred principally in connection with the Term Loan and other losses of $0.2 million.

Nine Months Ended September 30, 2018 Compared to Nine Months Ended September 30, 2017

U.S. Business segment

Operating revenues of the U.S. Business segment of $159.2 million was essentially unchanged from the nine months ended September 30, 2017, as higher average AUM was offset by lower average U.S. listed ETF advisory fees due to a change in product mix. Our average U.S. listed ETF advisory fee was 0.49% and 0.50% during the nine months ended September 30, 2018 and September 30, 2017, respectively.

Operating expenses of the U.S. Business segment increased 7.9% from $107.0 million in the nine months ended September 30, 2017 to $115.4 million in the comparable period in 2018. Included in the nine months ended September 30, 2018 were acquisition-related costs associated with the ETFS Acquisition of $8.2 million. These costs included professional advisor fees and integration costs. In addition, the increase was also attributable to higher professional fees, higher spending on sales related activities and higher third-party distribution fees expense due to a new distribution relationship announced in the fourth quarter of 2017. These increases were partly offset by lower incentive compensation.    

Other income, net of the U.S. Business segment declined 78.2% from $8.9 million in the nine months ended September 30, 2017 to $2.0 million in the comparable period in 2018. This decline was principally due to the $6.9 million settlement gain which was recognized in June 2017.

International Business segment

Operating revenues of the International Business segment increased $39.6 million, from $7.5 million in the nine months ended September 30, 2017 to $47.1 million in the comparable period in 2018. This increase was attributable to higher average AUM which increased primarily due to $17.6 billion of AUM acquired in connection with the ETFS Acquisition.

Operating expenses of the International Business segment increased 151.4% from $16.4 million in the nine months ended September 30, 2017 to $41.3 million in the comparable period in 2018, primarily due to the ETFS Acquisition. Fund management and administration expense and compensation expense increased due to higher average AUM and higher headcount, respectively. In addition, during the nine months ended September 30, 2018 we recognized contractual gold payments expense of $5.6 million and acquisition-related costs of $2.2 million associated with the ETFS Acquisition.


47


Table of Contents

Other income, net of the International Business segment was $12.2 million for the nine months ended September 30, 2018, which was comprised of a gain on revaluation of deferred consideration of $17.6 million, partly offset by interest expense of $4.7 million incurred principally in connection with the Term Loan and other losses of $0.7 million. The other losses represent realized losses arising from the sale of gold earned on advisory fees paid by physically-backed gold ETPs associated with the ETFS Acquisition and miscellaneous foreign exchange losses.

Liquidity and Capital Resources

The following table summarizes key data regarding our liquidity, capital resources and use of capital to fund our operations:


     September 30,
2018
     December 31,
2017
 

Balance Sheet Data (in thousands):


Cash and cash equivalents

   $ 77,125      $ 54,193  

Securities owned, at fair value

     4,426        66,294  

Securities held-to-maturity

     20,199        21,299  

Accounts receivable

     25,528        21,309  


Total: Liquid assets

     127,278        163,095  

Less: Total current liabilities

     (61,384      (57,348


Subtotal

     65,894        105,747  

Plus: Revolving credit facility - undrawn

     50,000        —    


Total: Available liquidity

   $ 115,894      $ 105,747  


     Nine Months Ended September 30,  
     2018      2017  

Cash Flow Data (in thousands):


Operating cash flows

   $ 30,200      $ 31,079  

Investing cash flows

     (181,764      (17,809

Financing cash flows

     175,654        (36,950

Foreign exchange rate effect

     (1,158      1,179  


Increase/(decrease) in cash and cash equivalents

   $ 22,932      $ (22,501


Liquidity

We consider our available liquidity to be our liquid assets and available borrowings under our revolving credit facility, less our current liabilities. Liquid assets consist of cash and cash equivalents, securities owned, at fair value, securities held-to-maturity and accounts receivable. Our securities owned, at fair value are highly liquid investments. Certain securities are accounted for as held-to-maturity securities and we have the intention and ability to hold them to maturity. However, these securities are also readily traded and, if needed, could be sold for liquidity. Accounts receivable are current assets and primarily represent receivables from advisory fees we earn from our ETPs. Our current liabilities consist primarily of payments owed to vendors and third parties in the normal course of business as well as accrued year end compensation for employees.

See the section below titled “Credit Facility” for a discussion of our revolving credit facility.

Cash and cash equivalents increased $22.9 million in the nine months ended September 30, 2018 due to $200.0 million proceeds from the issuance of long-term debt, $64.5 million from sales and maturities of debt securities available-for-sale, $30.2 million of cash generated by our operating activities and $1.1 million from held-to-maturity securities called or maturing during the period. These increases were partly offset by $239.3 million of cash paid upon closing of the ETFS Acquisition, net of cash acquired, $14.2 million used to pay dividends on our common stock, $8.7 million used to pay credit facility issuance costs, $8.0 million used to fund the AdvisorEngine note receivable, $1.4 million used to repurchase our common stock and $1.3 million used for other activities.

Cash and cash equivalents decreased $22.5 million in the nine months ended September 30, 2017 due to $76.8 million used to purchase securities available-for-sale, $32.8 million used to pay dividends on our common stock, $5.0 million invested in AdvisorEngine, $4.2 million used to repurchase our common stock and $3.0 million used to purchase held-to-maturity securities. These decreases were partly offset by $65.1 million from sales and maturities of securities available-for-sale, $31.1 million of cash generated by our operating activities, $2.2 million from held-to-maturity securities called or maturing during the period and $0.9 million generated from other activities.


48


Table of Contents

Credit Facility

On April 11, 2018 and in connection with the ETFS Acquisition, we and WisdomTree International entered into a credit agreement (the “Credit Agreement”), by and among us, WisdomTree International, certain subsidiaries of ours as guarantors, the lenders party thereto and Credit Suisse AG, Cayman Islands Branch, as administrative agent, collateral agent, L/C Issuer and lender. Under the Credit Agreement, the lenders extended a $200.0 million Term Loan to WisdomTree International, the net cash proceeds of which were used by WisdomTree International, together with other cash on hand, to complete the acquisition and pay certain related fees, costs and expenses, and made a $50.0 revolving credit facility (the “Revolver” and, together with the Term Loan, the “Credit Facility”) available to the Company and WisdomTree International for revolving borrowings from time to time for working capital, capital expenditures and general corporate purposes.

Interest on the Term Loan accrues at a rate per annum equal to LIBOR, plus up to 2.00% (commencing at LIBOR, plus 1.75%), and interest on the Revolver accrues at a rate per annum equal to LIBOR, plus up to 1.50% (commencing at LIBOR, plus 1.25%), in each case, with the exact interest rate margin determined based on the Total Leverage Ratio (as defined below). The Revolver is also subject to a facility fee equal to a rate per annum of up to 0.50% of the actual daily amount of the aggregate commitments (whether used or unused) under the Revolver, with the exact facility fee rate determined based on the Total Leverage Ratio. The Credit Facility matures on April 11, 2021 (the “Maturity Date”). The Term Loan does not amortize and the entire principal balance is due in a single payment on the Maturity Date.

The Credit Agreement governing the terms of the Credit Facility includes a financial covenant that requires that we maintain a Total Leverage Ratio, calculated as of the last day of each fiscal quarter commencing with the fiscal quarter ending September 30, 2018, equal to or less than the ratio set forth opposite such fiscal quarter:


Fiscal Quarter Ending

   Total Leverage Ratio  

September 30, 2018

     2.75:1.00  

December 31, 2018

     2.75:1.00  

March 31, 2019

     2.75:1.00  

June 30, 2019

     2.50:1.00  

September 30, 2019

     2.50:1.00  

December 31, 2019

     2.50:1.00  

March 31, 2020

     2.25:1.00  

June 30, 2020

     2.25:1.00  

September 30, 2020 and each subsequent fiscal quarter ending on or before the Maturity Date

     2.00:1.00  

Total Leverage Ratio means, as of the last day of any fiscal quarter, the ratio of Consolidated Total Debt of ours and our restricted subsidiaries (as defined in the Credit Agreement) as of such date to Consolidated EBITDA of ours and our restricted subsidiaries (as defined in the Credit Agreement) for the four consecutive fiscal quarters ended on such date.

WisdomTree International’s obligations under the Term Loan and Revolver are unconditionally guaranteed by us and certain of our subsidiaries and secured by a lien on substantially all of the present and future property and assets of ours, WisdomTree International and such subsidiaries, in each case, subject to customary exceptions and exclusions. Our obligations under the Revolver are unconditionally guaranteed by certain of our wholly-owned domestic subsidiaries and secured by substantially all of the present and future property and assets of ours and such subsidiaries, in each case, subject to customary exceptions and exclusions.

The Credit Agreement contains customary affirmative covenants for transactions of this type and other affirmative covenants agreed to by the parties, including, among others, the provision of annual and quarterly financial statements and compliance certificates, maintenance of property, insurance, compliance with laws and environmental matters. The Credit Agreement contains customary negative covenants, including among others, restrictions on the incurrence of indebtedness, granting of liens, making investments and acquisitions, paying dividends, repurchasing equity interests of ours, entering into affiliate transactions and asset sales. The Credit Agreement also provides for a number of customary events of default, including, among others, payment, bankruptcy, covenant, representation and warranty, change of control and judgment defaults.

We were in compliance with our covenants under the Credit Agreement during the period April 11, 2018 through September 30, 2018.


49


Table of Contents

Capital Resources

Our principal source of financing is our operating cash flow. We believe that current cash flows generated by our operating activities and existing cash balances should be sufficient for us to fund our operations for at least the next 12 months. In addition, we have access to the Revolver for working capital, capital expenditures and general corporate purposes. No amounts are currently outstanding under the Revolver.

Use of Capital

Our business does not require us to maintain a significant cash position. We potentially may use our cash to exercise our option to acquire the remaining equity interests in AdvisorEngine (See Note 9 to our Consolidated Financial Statements). Otherwise, our cash position is available to fund the ongoing operations of our business. Also, as part of our capital management, we maintain a capital return program which includes a $0.03 per share quarterly cash dividend and authority to purchase our common stock through April 27, 2019, including purchases to offset future equity grants made under our equity plans. As previously mentioned, under the terms of the Credit Agreement, we are subject to various covenants including compliance with the Total Leverage Ratio. A quarterly dividend payment in excess of $0.03 per share and repurchases of our common stock (excluding purchases of our common stock withheld pursuant to the terms of equity awards granted to employees to satisfy tax withholding obligations) are permitted only to the extent the Total Leverage Ratio does not exceed 1.75 to 1.00 and no event of default (as defined in the Credit Agreement) has occurred and is continuing at the time the cash dividend payment or stock repurchase is made.

During the three months ended September 30, 2018, we repurchased 47,816 shares of our common stock under the repurchase program for an aggregate cost of $0.4 million. Currently, $87.2 million remains under this program for future purchases.

Contractual Obligations

The following table summarizes our future cash payments associated with contractual obligations as of September 30, 2018:


     Total      Payments Due by Period  
   (in thousands)  
   Less than 1
year
     1 to 3 years      3 to 5 years      More than 5
years
 

Term Loan

   $ 200,000      $ —        $ 200,000      $ —        $ —    

Operating leases

     34,128        1,282        8,464        8,638        15,744  


Total

   $ 234,128      $ 1,282      $ 208,464      $ 8,638      $ 15,744  


Off-Balance Sheet Arrangements

Other than operating leases, which are included in the table above, we do not have any off-balance sheet financing or other arrangements. We have neither created nor are party to any special-purpose or off-balance sheet entities for the purpose of raising capital, incurring debt or operating our business.

Critical Accounting Policies

Goodwill and Intangible Assets

Goodwill is the excess of the fair value of the purchase price over the fair values of the identifiable net assets at the acquisition date. The Company tests its goodwill for impairment at least annually and at the time of a triggering event requiring re-evaluation, if one were to occur, in accordance with Accounting Standards Update, or ASU, 2017-04 Intangibles-Goodwill and Other (Topic 350): Simplifying the Test for Goodwill Impairment. We early adopted the revised guidance for impairment tests performed after January 1, 2017. Under the revised guidance, goodwill is considered impaired when the estimated fair value of the reporting unit that was allocated the goodwill is less than its carrying value. If the estimated fair value of such reporting unit is less than its carrying value, goodwill impairment is recognized based on that difference, not to exceed the carrying amount of goodwill. A reporting unit is an operating segment or a component of an operating segment provided that the component constitutes a business for which discrete financial information is available and management regularly reviews the operating results of that component.

For impairment testing purposes, goodwill has been allocated to our U.S. Business reporting unit which is assessed annually for impairment on April 30th. In addition, goodwill arising from the ETFS Acquisition (See Note 3 to our Consolidated Financial Statements) has been allocated to the European Business reporting unit included in the International Business reportable segment and assessed annually for impairment on November 30th. When performing our goodwill impairment test, we consider a qualitative assessment, when appropriate, and the income approach, market approach and our market capitalization when determining the fair value of our reporting units. Goodwill allocated to our U.S. Business reporting unit was assessed for impairment as of April 30, 2018. The results of this analysis indicated no impairment.


50


Table of Contents

Indefinite-lived intangible assets are tested for impairment at least annually and are reviewed for impairment whenever events or changes in circumstances indicate that the carrying amount of an asset may not be recoverable. Indefinite-lived intangible assets are impaired if their estimated fair value is less than their carrying value. We may rely on a qualitative assessment when performing our intangible asset impairment test. Otherwise, the impairment evaluation is performed at the lowest level of reasonably identifiable cash flows independent of other assets. The annual impairment testing date for all of the Company’s intangible assets is November 30th.

Investments, Carried at Cost

We account for equity investments that do not have a readily determinable fair value as cost method investments under the measurement alternative prescribed within ASU 2016-01, Financial Instruments – Recognition and Measurement of Financial Assets and Financial Liabilities, to the extent such investments are not subject to consolidation or the equity method. Under the measurement alternative, these financial instruments are carried at cost, less any impairment (assessed quarterly), plus or minus changes resulting from observable price changes in orderly transactions for an identical or similar investment of the same issuer. In addition, income is recognized when dividends are received only to the extent they are distributed from net accumulated earnings of the investee. Otherwise, such distributions are considered returns of investment and are recorded as a reduction of the cost of the investment.

Revenue Recognition

We earn substantially all of our revenue in the form of advisory fees from our ETPs and recognize this revenue over time, as the performance obligation is satisfied. ETP advisory fees are based on a percentage of the ETPs’ average daily net assets. Progress is measured using the practical expedient under the output method resulting in the recognition of revenue in the amount for which we have a right to invoice.

Recently Issued Accounting Pronouncements

In May 2014, the Financial Accounting Standards Board, or FASB, issued ASU 2014-09, Revenue from Contracts with Customers (ASU 2014-09), a comprehensive revenue recognition standard on the financial reporting requirements for revenue from contracts entered into with customers. In July 2015, the FASB deferred this ASU’s effective date by one year, to interim and annual periods beginning after December 15, 2017. The deferral allows early adoption at the original effective date. During 2016, the FASB issued ASU 2016-08, which clarifies principal versus agent considerations, ASU 2016-10, which clarifies identifying performance obligations and the licensing implementation guidance, and ASU 2016-12, which amends certain aspects of the new revenue recognition standard pursuant to ASU 2014-09. ASU 2014-09 allows for the use of either the retrospective or modified retrospective adoption method. The guidance in ASU 2014-09, and the related amendments, became effective for us on January 1, 2018. We adopted this standard under the modified retrospective method and determined the standard did not have a material impact on our historical pattern of recognizing revenue from contracts with customers in our consolidated financial statements (See Note 16 to our Consolidated Financial Statements).

In January 2016, the FASB issued ASU 2016-01, Financial Instruments – Recognition and Measurement of Financial Assets and Financial Liabilities (ASU 2016-01). The main objective of the standard is to enhance the reporting model for financial instruments to provide users of financial statements with more decision-useful information. The amendments in the update make targeted improvements to generally accepted accounting principles. These include requiring equity investments (except those accounted for under the equity method of accounting or those that result in consolidation of the investee) to be measured at fair value with changes in fair value recognized in net income. Available-for-sale classification for equity investments with readily determinable fair values will no longer be permissible. However, an entity may choose a measurement alternative to measure equity investments that do not have readily determinable fair values by recognizing these financial instruments at cost minus impairment, if any, plus or minus changes resulting from observable price changes in orderly transactions for the identical or similar investment of the same issuer. The update also simplifies the impairment assessment of equity investments without readily determinable fair values by requiring a qualitative assessment to identify impairment. When a qualitative assessment indicates that impairment exists, an entity is required to measure the investment at fair value. ASU 2016-01 is effective for fiscal years beginning after December 15, 2017, including interim periods within those fiscal years. We adopted this standard on January 1, 2018 and have elected to apply the measurement alternative to our equity investments that do not have readily determinable fair values. The adoption of this standard did not have a material impact on our consolidated financial statements.

In June 2016, the FASB issued ASU 2016-13, Financial Instruments-Credit Losses (Topic 326) – Measurement of Credit Losses on Financial Instruments (ASU 2016-13). The main objective of the standard is to provide financial statement users with more decision-useful information about the expected credit losses on financial instruments and other commitments to extend credit held by a reporting entity at each reporting date. In issuing the standard, the FASB is responding to criticism that today’s guidance delays recognition of credit losses. The standard will replace today’s “incurred loss” approach with an “expected loss” model. The new model, referred to as the current expected credit loss (“CECL”) model, will apply to: (1) financial assets subject to credit losses and measured at amortized cost, and (2) certain off-balance sheet credit exposures. The standard is applicable to loans, accounts receivable, trade receivables, and other financial assets measured at amortized cost, loan commitments and certain other off-balance sheet credit exposures, debt securities (including those held-to-maturity) and other financial assets measured at fair value through


51


Table of Contents

other comprehensive income, and beneficial interests in securitized financial assets. The CECL model does not apply to available-for-sale debt securities. For available-for-sale debt securities with unrealized losses, entities will measure credit losses in a manner similar to what they do today, except that the credit losses will be recognized as allowances rather than reductions in the amortized cost of the securities. Accordingly, the new methodology will be utilized when assessing our financial instruments for impairment. As a result, entities will recognize improvements to estimated credit losses immediately in earnings rather than as interest income over time, as they do today. The ASU also simplifies the accounting model for purchased credit-impaired debt securities and loans. ASU 2016-13 also expands the disclosure requirements regarding an entity’s assumptions, models, and methods for estimating the allowance for loan and lease losses. ASU 2016-13 is effective for years beginning after December 15, 2019, including interim periods within those fiscal years under a modified retrospective approach. Early adoption is permitted for periods beginning after December 15, 2018. We are currently evaluating the impact that the standard will have on our consolidated financial statements.

In February 2016, the FASB issued ASU 2016-02, Leases (ASU 2016-02), which requires lessees to include most leases on the balance sheet. ASU 2016-02 is effective for fiscal years (and interim reporting periods within those years) beginning after December 15, 2018 and early adoption is permitted. We are currently evaluating the impact that the standard will have on our consolidated financial statements and expect, at a minimum, that its implementation will result in a gross-up on the consolidated balance sheets upon recognition of right-of-use assets and lease liabilities associated with the future minimum payments required under operating leases as disclosed in Note 14 to our Consolidated Financial Statements.

In August 2018, the FASB issued ASU 2018-13, Fair Value Measurement (Topic 820) – Disclosure Framework – Changes to the Disclosure Requirements for Fair Value Measurement (ASU 2018-13), which modifies the disclosure requirements on fair value measurements, including removing the requirement to disclose (1) the amount of and reasons for transfers between Level 1 and Level 2 of the fair value hierarchy, (2) the policy for timing of transfers between levels and (3) the valuation processes for Level 3 fair value measurements. ASU 2018-13 also added new disclosures including the requirement to disclose (A) the changes in unrealized gains and losses for the period included in other comprehensive income for recurring Level 3 fair value measurements held at the end of the reporting period and (B) the range and weighted average of significant unobservable inputs used to develop Level 3 fair value measurements. ASU 2018-13 is effective for fiscal years (and interim reporting periods within those years) beginning after December 15, 2019 and early adoption is permitted. This standard will only impact the disclosures pertaining to fair value measurements.

ITEM 3. QUANTITATIVE AND QUALITATIVE DISCLOSURES ABOUT MARKET RISK

The following information, together with information included in other parts of this Management’s Discussion and Analysis of Financial Condition and Results of Operations, describes key aspects of our market risk.

Market Risk

Market risk to us generally represents the risk of changes in the value of securities held in the portfolios of the WisdomTree ETPs that generally results from fluctuations in securities prices, foreign currency exchange rates against the U.S. dollar, and interest rates. Nearly all of our revenues are derived from advisory agreements for the WisdomTree ETFs. Under these agreements, the advisory fee we receive is based on the average market value of the assets in the WisdomTree ETF portfolios we manage.

Fluctuations in the value of these securities are common and are generated by numerous factors such as market volatility, the overall economy, inflation, changes in investor strategies and sentiment, availability of alternative investment vehicles, government regulations and others. Accordingly, changes in any one or a combination of these factors may reduce the value of investment securities and, in turn, the underlying AUM on which our revenues are earned. These declines may cause investors to withdraw funds from our ETPs in favor of investments that they perceive as offering greater opportunity or lower risk, thereby compounding the impact on our revenues. We believe challenging and volatile market conditions will continue to be present in the foreseeable future.

Interest Rate Risk

To maximize yields, we invest our corporate cash in short-term interest earning assets, primarily money market instruments at a commercial bank, federal agency debt instruments and short-term investment grade corporate bonds which totaled $113.1 million and $55.0 million as of December 31, 2017 and September 30, 2018, respectively. We do not anticipate that changes in interest rates will have a material impact on our financial condition, operating results or cash flows.

In addition, in connection with the ETFS Acquisition, we obtained a $250.0 million Credit Facility consisting of a $200.0 million Term Loan and $50.0 million Revolver. Interest rate risk is not significant as borrowings under these facilities accrue interest at variable rates (See Note 12 to our Consolidated Financial Statements).


52


Table of Contents

Exchange Rate Risk

Over the last few years, we have expanded our business globally and are subject to currency translation exposure on the results of our non-U.S. operations, primarily in Europe and Canada. Foreign currency translation risk is the risk that exchange rate gains or losses arise from translating foreign entities’ statements of earnings and balance sheets from functional currency to our reporting currency (the U.S. dollar) for consolidation purposes. Historically we generated the vast majority of our revenues and expenses in the U.S. dollar. However, upon completion of the ETFS Acquisition our exposure to exchange rate risk has increased. While the advisory fees earned by ETFS are predominantly in U.S. dollars (and also paid in gold ounces, as described below), expenses for corporate overhead are generally incurred in British pounds. Currently, we do not enter into derivative financial instruments aimed at offsetting certain exposures in the statement of operations or the balance sheet but may seek to do so in the future.

Exchange rate risk associated with the Euro and Canadian Dollar is not considered to be significant.

Commodity Price Risk

The completion of the ETFS Acquisition has provided us with an industry leading position in European listed gold and commodity products. Fluctuations in the prices of commodities that are linked to certain of these ETPs could have a material adverse effect on ETFS’s AUM and revenues. In addition, a portion of the advisory fee revenues we receive on our ETPs backed by gold are paid in gold ounces. In addition, we pay gold ounces to satisfy our deferred consideration obligation that we assumed in connection with the ETFS Acquisition (See Note 11 to our Consolidated Financial Statements). While we may readily sell the gold that we earn under these advisory contracts, we still may maintain a position. We currently do not enter into arrangements to hedge against fluctuations in the price of gold and any hedging we may undertake in the future may not be cost-effective or sufficient to hedge against this gold exposure.

ITEM 4. CONTROLS AND PROCEDURES

Evaluation of Disclosure Controls and Procedures

As of September 30, 2018, our management, with the participation of our Chief Executive Officer, Chief Financial Officer and Chief Accounting Officer, evaluated the effectiveness of our disclosure controls and procedures pursuant to Rule 13a-15(b) promulgated under the Securities Exchange Act of 1934, as amended, or the Exchange Act. Based upon that evaluation, our Chief Executive Officer, Chief Financial Officer and Chief Accounting Officer concluded that, as of September 30, 2018, our disclosure controls and procedures were effective at a reasonable assurance level in ensuring that material information required to be disclosed by us in the reports that we file or submit under the Exchange Act is recorded, processed, summarized and reported within the time periods specified in the rules, regulations and forms of the SEC, including ensuring that such material information is accumulated by and communicated to our management, including our Chief Executive Officer, Chief Financial Officer and Chief Accounting Officer, as appropriate to allow timely decisions regarding required disclosure. See “Changes in Internal Control over Financial Reporting” below for a discussion regarding the ETFS Acquisition which we completed on April 11, 2018 (See Note 3 to our Consolidated Financial Statements).

Changes in Internal Control over Financial Reporting

As of the date of this Report, we are in the process of integrating the acquired operations of ETFS into our overall internal control over financial reporting (“ICFR”). We currently anticipate that we will be deferring our assessment of the ICFR related to ETFS, which for the nine months ended September 30, 2018 represented approximately 18% of our total revenues.                

Notwithstanding the recently completed ETFS Acquisition, during the quarter ended September 30, 2018, there were no changes in our internal control over financial reporting that have materially affected, or are reasonably likely to materially affect, our internal control over financial reporting.

PART II: OTHER INFORMATION

ITEM 1. LEGAL PROCEEDINGS

None.

ITEM 1A. RISK FACTORS

You should carefully consider the information set forth in this Report, as well as the information in Part 1, Item 1A. “Risk Factors” in our annual Report on Form 10-K for the fiscal year ended December 31, 2017 and Quarterly Report on Form 10-Q for the quarter ended March 31, 2018.


53


Table of Contents

ITEM 2. UNREGISTERED SALES OF EQUITY SECURITIES AND USE OF PROCEEDS

Recent sales of Unregistered Securities

None.

Use of Proceeds

Not applicable.

Purchases of Equity Securities by the Issuer and Affiliated Purchasers

The following table provides information with respect to purchases made by or on behalf of the Company or any “affiliated purchaser” of shares of our common stock.


     Total Number
of Shares
Purchased
     Average Price
Paid Per Share
     Total Number of
Shares Purchased
as
Part of Publicly
Announced Plans
or
Programs(1)
     Approximate
Dollar
Value of
Shares that
May Yet Be
Purchased
Under the
Plans or
Programs
 

Period

                        (in thousands)  

July 1, 2018 to July 31, 2018

     30,852      $ 9.32        30,852     

August 1, 2018 to August 31, 2018

     13,453      $ 8.09        13,453     

September 1, 2018 to September 30, 2018

     3,511      $ 7.88        3,511     


Total

     47,816      $ 8.87        47,816      $ 87,184  


(1)

On October 29, 2014, our Board of Directors authorized a three-year share repurchase program of up to $100.0 million. On April 27, 2016, the Board approved a $60.0 million increase to this program and extended the term through April 27, 2019, increasing the total authorized repurchase amount to $100.3 million. During the three months ended September 30, 2018, we repurchased 47,816 shares of our common stock under this program for an aggregate cost of $0.4 million. As of September 30, 2018, $87.2 million remained under this program for future purchases. Under the terms of the Credit Agreement governing the Credit Facility, share repurchases are permitted only to the extent the Total Leverage Ratio does not exceed 1.75 to 1.00 and no event of default (as defined in the Credit Agreement) has occurred and is continuing at the time the stock repurchase is made (See Note 12 to our Consolidated Financial Statements). However, our ability to purchase shares of our common stock withheld pursuant to the terms of equity awards granted to employees to satisfy tax withholding obligations will not be restricted.

ITEM 3. DEFAULTS UPON SENIOR SECURITIES

None.

ITEM 4. MINE SAFETY DISCLOSURES

Not applicable.

ITEM 5. OTHER INFORMATION

None.


54


Table of Contents

ITEM 6. EXHIBITS


Exhibit No.


Description

3.1   Amended and Restated Certificate of Incorporation (incorporated by reference to Exhibit 3.1 of the Registrant’s Registration Statement on Form 10, filed with the SEC on March 31, 2011)
3.2   Certificate of Designations of Series A Non-Voting Convertible Preferred Stock of the Registrant (incorporated by reference to Exhibit 3.1 of the Registrant’s Current Report on Form 8-K filed with the SEC on April 13, 2018)
3.3   Amended and Restated Bylaws (incorporated by reference to Exhibit 3.2 of the Registrant’s Registration Statement on Form 10, filed with the SEC on March 31, 2011)
4.1   Specimen Common Stock Certificate (incorporated by reference to Exhibit 4.1 of the Registrant’s Registration Statement on Form 10, filed with the SEC on March 31, 2011)
4.2   Amended and Restated Stockholders Agreement among the Registrant and certain investors dated December  21, 2006 (incorporated by reference to Exhibit 4.2 of the Registrant’s Registration Statement on Form 10, filed with the SEC on March 31, 2011)
4.3   Securities Purchase Agreement among the Registrant and certain investors dated December  21, 2006 (incorporated by reference to Exhibit 4.3 of the Registrant’s Registration Statement on Form 10, filed with the SEC on March 31, 2011)
4.4   Securities Purchase Agreement among the Registrant and certain investors dated October  15, 2009 (incorporated by reference to Exhibit 4.4 of the Registrant’s Registration Statement on Form 10, filed with the SEC on March 31, 2011)
4.5   Third Amended and Restated Registration Rights Agreement dated October  15, 2009 (incorporated by reference to Exhibit 4.5 of the Registrant’s Registration Statement on Form 10, filed with the SEC on March 31, 2011)
4.6   Investor Rights Agreement, dated April  11, 2018, between the Registrant and ETF Securities Limited (incorporated by reference to Exhibit 4.1 of the Registrant’s Current Report on Form 8-K filed with the SEC on April 13, 2018)
31.1 (1)   Certification of Chief Executive Officer and Principal Executive Officer pursuant to Rule 13a-14 of the Exchange Act
31.2 (1)   Certification of Chief Financial Officer and Principal Financial Officer pursuant to Rule 13a-14 of the Exchange Act
31.3 (1)   Certification of Chief Accounting Officer and Principal Accounting Officer pursuant to Rule 13a-14 of the Exchange Act
32 (1)   Section 1350 Certification
101 (1)   Financial Statements from the Quarterly Report on Form 10-Q of the Company for the quarter ended September 30, 2018, formatted in XBRL: (i) Consolidated Balance Sheets; (ii) Consolidated Statements of Operations and Comprehensive Income (Unaudited); (iii) Consolidated Statements of Cash Flows (Unaudited); and (iv) Notes to Consolidated Financial Statements, as blocks of text and in detail.
101.INS (1)   XBRL Instance Document
101.SCH (1)   XBRL Taxonomy Extension Schema Document
101.CAL (1)   XBRL Taxonomy Extension Calculation Linkbase Document
101.DEF (1)   XBRL Taxonomy Extension Definition Linkbase Document
101.LAB (1)   XBRL Taxonomy Extension Label Linkbase Document
101.PRE (1)   XBRL Taxonomy Extension Presentation Linkbase Document


(1)

Filed herewith.


55


Table of Contents

SIGNATURE

Pursuant to the requirements of the Securities Exchange Act of 1934, the registrant has duly caused this Report to be signed on its behalf by the undersigned thereunto duly authorized on this 7th day of November 2018.


WISDOMTREE INVESTMENTS, INC.
By:  

/s/ Jonathan Steinberg

  Jonathan Steinberg
  Chief Executive Officer and President (Authorized Officer and Principal Executive Officer)
WISDOMTREE INVESTMENTS, INC.
By:  

/s/ Amit Muni

  Amit Muni
  Chief Financial Officer (Authorized Officer and Principal Financial Officer)
WISDOMTREE INVESTMENTS, INC.
By:  

/s/ Bryan Edmiston

  Bryan Edmiston
  Chief Accounting Officer (Authorized Officer and Principal Accounting Officer)


56