PART I
| ITEM 1. |
BUSINESS |
Our Company
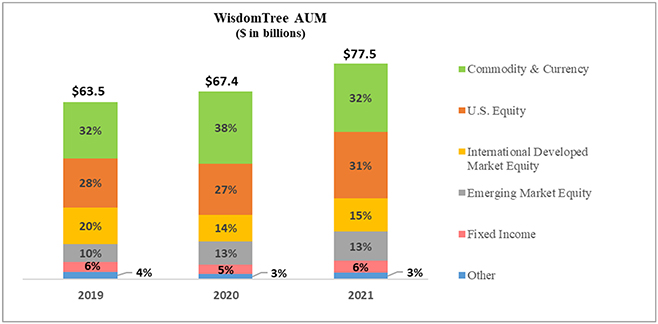
We are an asset management company in the business of offering transparent financial exposures to our clients and are a leading global exchange traded product, or ETP, sponsor based on assets under management, or AUM, with AUM of $77.5 billion as of December 31, 2021. More recently, we have been positioning ourselves to expand beyond our existing ETP business by leveraging blockchain technology, digital assets and principles of decentralized finance, or DeFi, to deliver transparency, choice and inclusivity to customers and consumers around the world.
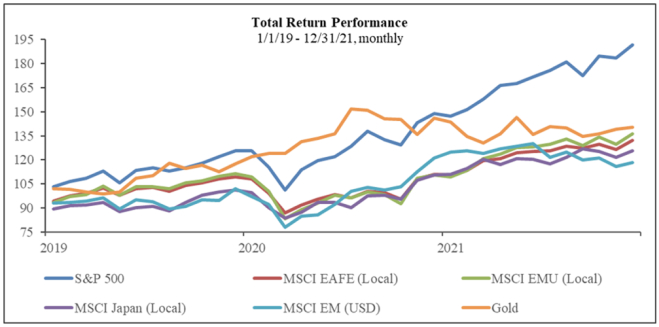
Our family of ETPs includes products that provide exposure to equities, commodities, fixed income, leveraged and inverse, currency, cryptocurrency and alternative strategies. We have launched many products and pioneered alternative weighting we call “Modern Alpha,” which combines the outperformance potential of active management with the benefits of passive management to offer investors cost-effective funds that are built to perform. Most of our equity-based funds employ a fundamentally weighted investment methodology, which weights securities based on factors such as dividends, earnings or investment factors, whereas most other industry indexes use a capitalization weighted methodology. These products are distributed through all major channels in the asset management industry, including banks, brokerage firms, registered investment advisers, institutional investors, private wealth managers and online brokers primarily through our sales force.
first-to-market
We are at the forefront of innovation and have differentiated ourselves through continued investments in technology-enabled and research-driven solutions such as our Advisor Solutions program, which includes portfolio construction, asset allocation, practice management services and digital tools for financial advisors. We seek to usher in the next chapter of financial services by introducing new revenue streams and expanding our offerings to include a new financial services mobile application, branded WisdomTree Prime™, a digital wallet that is native to the blockchain and being developed for saving, spending and investing in both native crypto assets and tokenized versions of mainstream financial assets (e.g., blockchain enabled investment funds). We also are planning to launch asset- and fund-tokenization products beginning with a dollar token, gold token and digital short term treasury fund which will be available on multiple public and permissioned blockchains, leveraging federal and state regulated entities. As we pursue our digital assets strategy, we are embracing a concept we refer to as “responsible DeFi,” which we believe upholds the foundational principles of regulation in this innovative and quickly evolving space.
We were incorporated under the laws of the state of Delaware on September 19, 1985 as Financial Data Systems, Inc. and ultimately renamed WisdomTree Investments, Inc. on September 6, 2005.
Assets Under Management
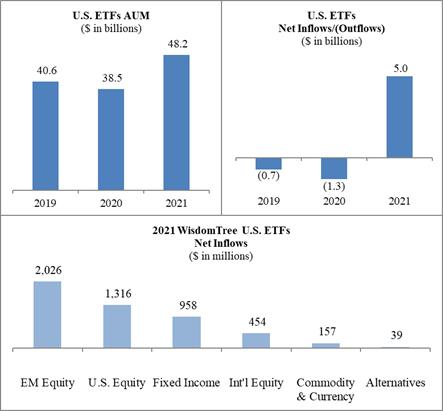
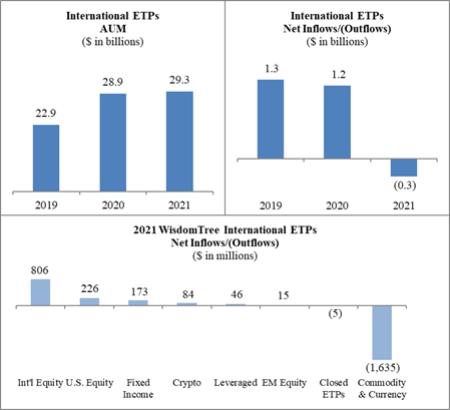
WisdomTree ETPs
We offer ETPs covering equity, commodity, fixed income, currency, cryptocurrency and alternative strategies. The chart below sets forth the asset mix of our ETPs for the last three years:
leveraged-and-inverse,
2