UNITED STATES
SECURITIES AND EXCHANGE COMMISSION
Washington, D.C. 20549
____________________________
Form
____________________________
| (Mark One) | ||
| | ANNUAL REPORT PURSUANT TO SECTION 13 OR 15(d) OF THE SECURITIES EXCHANGE ACT OF 1934 | |
For fiscal year ended
or
| | TRANSITION REPORT PURSUANT TO SECTION 13 OR 15(d) OF THE SECURITIES EXCHANGE ACT OF 1934 |
For the transition period from _______ to ________.
Commission File Number
____________________________
____________________________
| | | |
| (State or other jurisdiction of | (IRS Employer |
| | | |
| (Address of principal executive offices) | (Zip Code) |
(Registrant’s telephone number, including area code)
____________________________
Securities registered pursuant to Section 12(b) of the Act:
| Title of each class | Trading Symbol(s) | Name of each exchange on which registered | ||
| | | | ||
| | |
Securities registered pursuant to Section 12(g) of the Act:
None
____________________________
Indicate by check mark if the registrant is a well-known seasoned issuer, as defined in Rule 405 of the Securities Act. ☒
Indicate by check mark if the registrant is not required to file reports pursuant to Section 13 or Section 15(d) of the Act. ☐ Yes ☒
Indicate by check mark whether the registrant (1) has filed all reports required to be filed by Section 13 or 15(d) of the Securities Exchange Act of 1934 during the preceding 12 months (or for such shorter period that the registrant was required to file such reports), and (2) has been subject to such filing requirements for the past 90 days. ☒
Indicate by check mark whether the registrant has submitted electronically every Interactive Data File required to be submitted pursuant to Rule 405 of Regulation S-T (§232.405 of this chapter) during the preceding 12 months (or for such shorter period that the registrant was required to submit such files). ☒
Indicate by check mark whether the registrant is a large accelerated filer, an accelerated filer, a non-accelerated filer, a smaller reporting company, or emerging growth company. See definitions of “large accelerated filer,” “accelerated filer,” “smaller reporting company” and “emerging growth company” in Rule 12b-2 of the Exchange Act.
| | ☒ | Accelerated filer | ☐ | |||||
| Non-accelerated filer | ☐ | Smaller reporting company | | |||||
| Emerging growth company | |
If an emerging growth company, indicate by check mark if the registrant has elected not to use the extended transition period for complying with any new or revised financial accounting standards provided pursuant to Section 13(a) of the Exchange Act. ☐
Indicate by check mark whether the registrant has filed a report on and attestation to its management’s assessment of the effectiveness of its internal control over financial reporting under Section 404(b) of the Sarbanes-Oxley Act (15 U.S.C. 7262(b)) by the registered public accounting firm that prepared or issued its audit report.
If securities are registered pursuant to Section 12(b) of the Act, indicate by check mark whether the financial statements of the registrant included in the filing reflect the correction of an error to previously issued financial statements.
Indicate by check mark whether any of those error corrections are restatements that required a recovery analysis of incentive-based compensation received by any of the registrant’s executive officers during the relevant recovery period pursuant to §240.10D-1(b). ☐
Indicate by check mark whether the registrant is a shell company (as defined in Rule 12b-2 of the Exchange Act). Yes ☐ No
At June 30, 2023, the aggregate market value of the registrant’s Common Stock held by non-affiliates (computed by reference to the closing sale price of such shares on The New York Stock Exchange on June 30, 2023) was $
DOCUMENTS INCORPORATED BY REFERENCE
The information required by Part III of this Report, to the extent not set forth herein, is incorporated herein by reference from the registrant’s definitive proxy statement relating to the Annual Meeting of Stockholders to be held in 2024, which definitive proxy statement shall be filed with the Securities and Exchange Commission within 120 days after the end of the fiscal year to which this Report relates.
WISDOMTREE, INC.
Form 10-K
For the Fiscal Year Ended December 31, 2023
TABLE OF CONTENTS
|
2 |
||||
|
ITEM 1. |
2 |
|||
|
ITEM 1A. |
25 |
|||
|
ITEM 1B. |
40 |
|||
|
ITEM 1C. |
40 |
|||
|
ITEM 2. |
41 |
|||
|
ITEM 3. |
41 |
|||
|
ITEM 4. |
41 |
|||
|
42 |
||||
|
ITEM 5. |
42 |
|||
|
ITEM 6. |
42 |
|||
|
ITEM 7. |
Management’s Discussion and Analysis of Financial Condition and Results of Operations |
43 |
||
|
ITEM 7A. |
73 |
|||
|
ITEM 8. |
74 |
|||
|
ITEM 9. |
Changes in and Disagreements with Accountants on Accounting and Financial Disclosure |
74 |
||
|
ITEM 9A. |
74 |
|||
|
ITEM 9B. |
75 |
|||
|
ITEM 9C. |
Disclosure Regarding Foreign Jurisdictions That Prevent Inspections |
75 |
||
|
75 |
||||
|
ITEM 10. |
75 |
|||
|
ITEM 11. |
76 |
|||
|
ITEM 12. |
Security Ownership of Certain Beneficial Owners and Management and Related Stockholder Matters |
76 |
||
|
ITEM 13. |
Certain Relationships and Related Transactions, and Director Independence |
76 |
||
|
ITEM 14. |
76 |
|||
|
76 |
||||
|
ITEM 15. |
76 |
|||
|
ITEM 16. |
76 |
|||
Unless otherwise indicated, references to “the Company,” “we,” “us,” “our” and “WisdomTree” mean WisdomTree, Inc. and its subsidiaries.
WisdomTree®, WisdomTree Prime™ and Modern Alpha® are trademarks of WisdomTree, Inc. in the United States and in other countries. All other trademarks are the property of their respective owners.
i
CAUTIONARY NOTE REGARDING FORWARD-LOOKING STATEMENTS
This Annual Report on Form 10-K, or Report, contains forward-looking statements that are based on our management’s beliefs and assumptions and on information currently available to our management. Although we believe that the expectations reflected in these forward-looking statements are reasonable, these statements relate to future events or our future financial performance, and involve known and unknown risks, uncertainties and other factors that may cause our actual results, levels of activity, performance or achievements to be materially different from any future results, levels of activity, performance or achievements expressed or implied by these forward-looking statements.
In some cases, you can identify forward-looking statements by terminology such as “may,” “will,” “should,” “expects,” “intends,” “plans,” “anticipates,” “believes,” “estimates,” “predicts,” “potential,” “continue” or the negative of these terms or other comparable terminology. These statements are only predictions. You should not place undue reliance on forward-looking statements because they involve known and unknown risks, uncertainties and other factors, which are, in some cases, beyond our control and which could materially affect our results. Factors that may cause actual results to differ materially from current expectations include, among other things, those listed in the section entitled “Risk Factors” and elsewhere in this Report. If one or more of these or other risks or uncertainties occur, or if our underlying assumptions prove to be incorrect, actual events or results may vary significantly from those implied or projected by the forward-looking statements. No forward-looking statement is a guarantee of future performance. You should read this Report and the documents that we reference in this Report and have filed with the Securities and Exchange Commission, or the SEC, as exhibits to this Report, completely and with the understanding that our actual future results may be materially different from any future results expressed or implied by these forward-looking statements.
In particular, forward-looking statements in this Report may include statements about:
• anticipated trends, conditions and investor sentiment in the global markets and exchange-traded products, or ETPs;
• anticipated levels of inflows into and outflows out of our ETPs;
• our ability to deliver favorable rates of return to investors;
• competition in our business;
• whether we will experience future growth;
• our ability to develop new products and services and their potential for success;
• our ability to maintain current vendors or find new vendors to provide services to us at favorable costs;
• our ability to successfully implement our strategy relating to digital assets and blockchain-enabled financial services, including WisdomTree Prime, and achieve its objectives;
• our ability to successfully operate and expand our business in non-U.S. markets;
• the effect of laws and regulations that apply to our business; and
• actions of activist stockholders.
The forward-looking statements in this Report represent our views as of the date of this Report. We anticipate that subsequent events and developments may cause our views to change. However, while we may elect to update these forward-looking statements at some point in the future, we have no current intention of doing so except to the extent required by applicable law. Therefore, these forward-looking statements do not represent our views as of any date other than the date of this Report.
1
PART I
ITEM 1. BUSINESS
Our Company
We are a global financial innovator, offering a well-diversified suite of exchange traded products, or ETPs, models, solutions and products leveraging blockchain technology. We empower investors and consumers to shape their future and support financial professionals to better serve their clients and grow their businesses. We are leveraging the latest financial infrastructure to create products that provide access, transparency and an enhanced user experience. Building on our heritage of innovation, we are also developing and have launched next-generation digital products, services and structures, including digital or blockchain-enabled mutual funds (“Digital Funds”) and tokenized assets, as well as our blockchain-native digital wallet, WisdomTree Prime, which is currently available in the U.S. in 38 states, representing approximately 70% of the U.S. population.
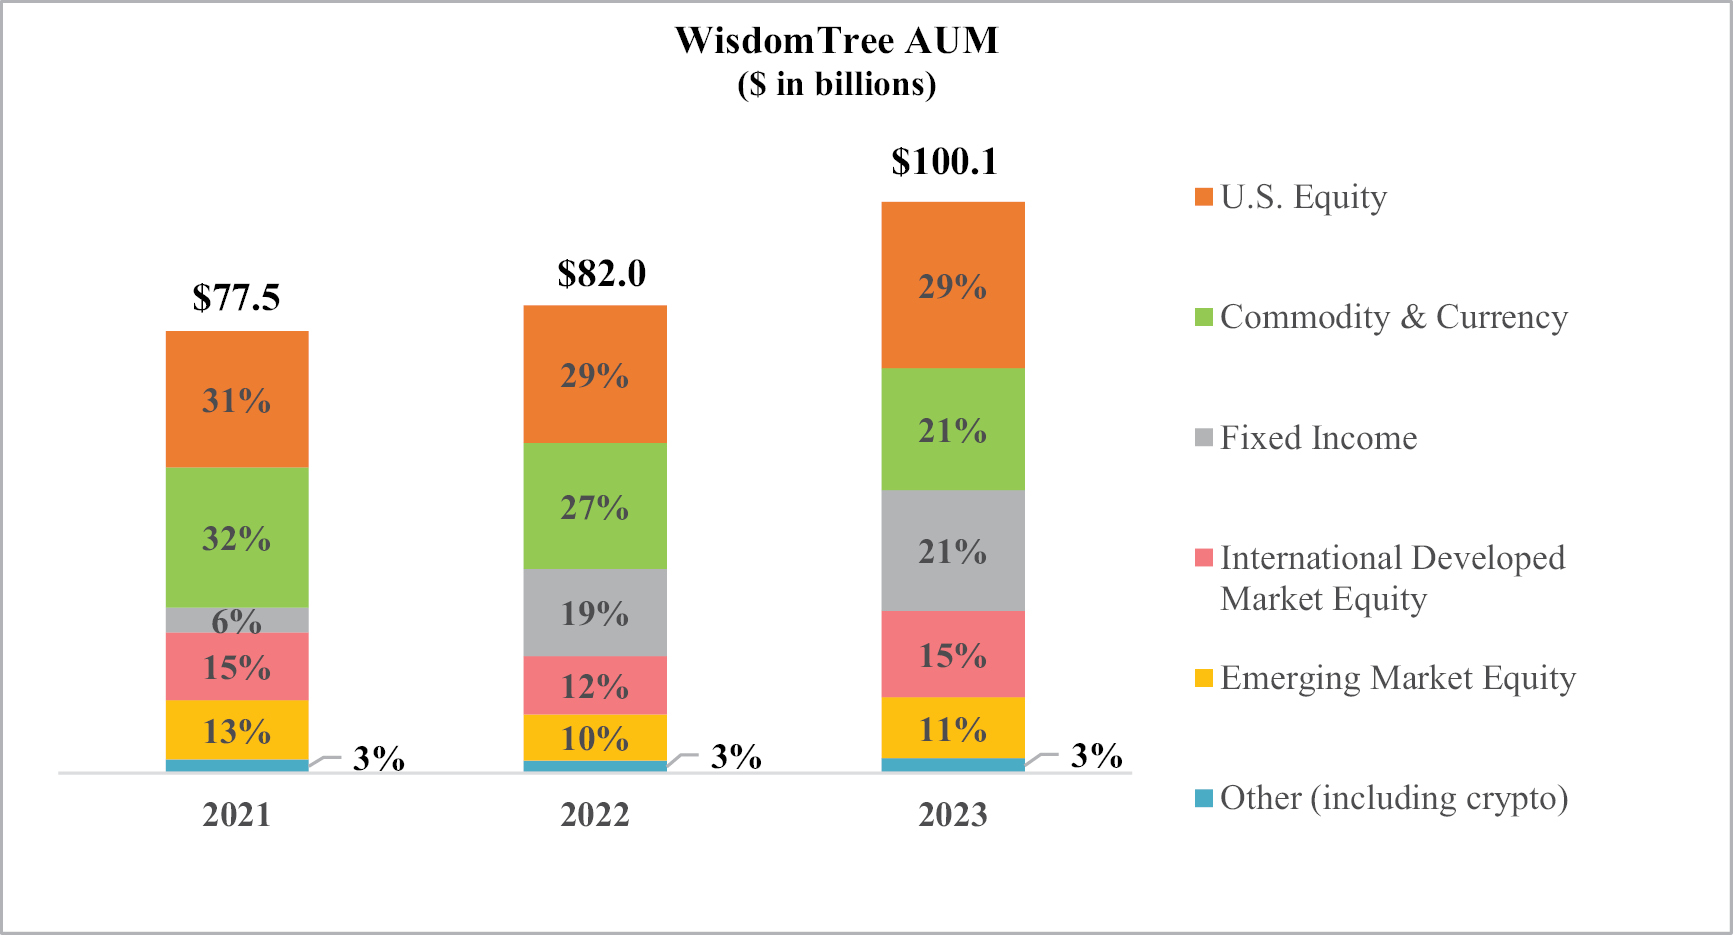
We had approximately $100.1 billion in assets under management, or AUM, as of December 31, 2023. Our family of ETPs includes products that provide exposure to equities, fixed income, commodities, leveraged-and-inverse, currency, alternatives and cryptocurrency strategies. We have launched many first-to-market products and pioneered alternative weighting we call “Modern Alpha,” which combines the outperformance potential of active management with the benefits of passive management to offer investors cost-effective funds that are built to perform. Most of our equity-based funds employ a fundamentally weighted investment methodology, which weights securities based on factors such as dividends, earnings or investment factors, whereas most other industry indexes use a capitalization weighted methodology. These products are distributed through all major channels in the asset management industry, including banks, brokerage firms, registered investment advisers, institutional investors, private wealth managers and online brokers primarily through our sales force. We believe technology is altering the way financial advisors conduct business and through our Advisor and Portfolio Solutions programs we offer technology-enabled and research-driven solutions including portfolio construction, asset allocation, practice management services and digital tools to help financial advisors address technology challenges and grow and scale their businesses.
We are at the forefront of innovation and believe that tokenization and leveraging the utility of blockchain technology is the next evolution in financial services. We are building the foundation that we believe will allow us to lead in this coming evolution. WisdomTree Prime, our blockchain-native digital wallet, positions us to expand our blockchain-enabled financial product and services offerings with a new direct-to-consumer channel where spending, saving and investing are united. As we continue to pursue our digital assets strategy, we are embracing what we refer to as “responsible DeFi,” which we believe upholds the foundational principles of regulation in this innovative and quickly evolving space. We believe that our expansion into digital assets and blockchain-enabled finance complements our existing core competencies in a holistic manner and will diversify our revenue streams and contribute to our growth.
We were incorporated under the laws of the state of Delaware on September 19, 1985 as Financial Data Systems, Inc. and were ultimately renamed WisdomTree, Inc. on November 7, 2022.
2
Assets Under Management
WisdomTree ETPs
We offer ETPs covering equity, fixed income, commodities, leveraged-and-inverse, currency, alternatives and cryptocurrency. The chart below sets forth the asset mix of our ETPs at December 31, 2021, 2022 and 2023:
Our Operating and Financial Results
We operate as an ETP sponsor and asset manager, providing investment advisory services globally through our subsidiaries in the U.S. and Europe.
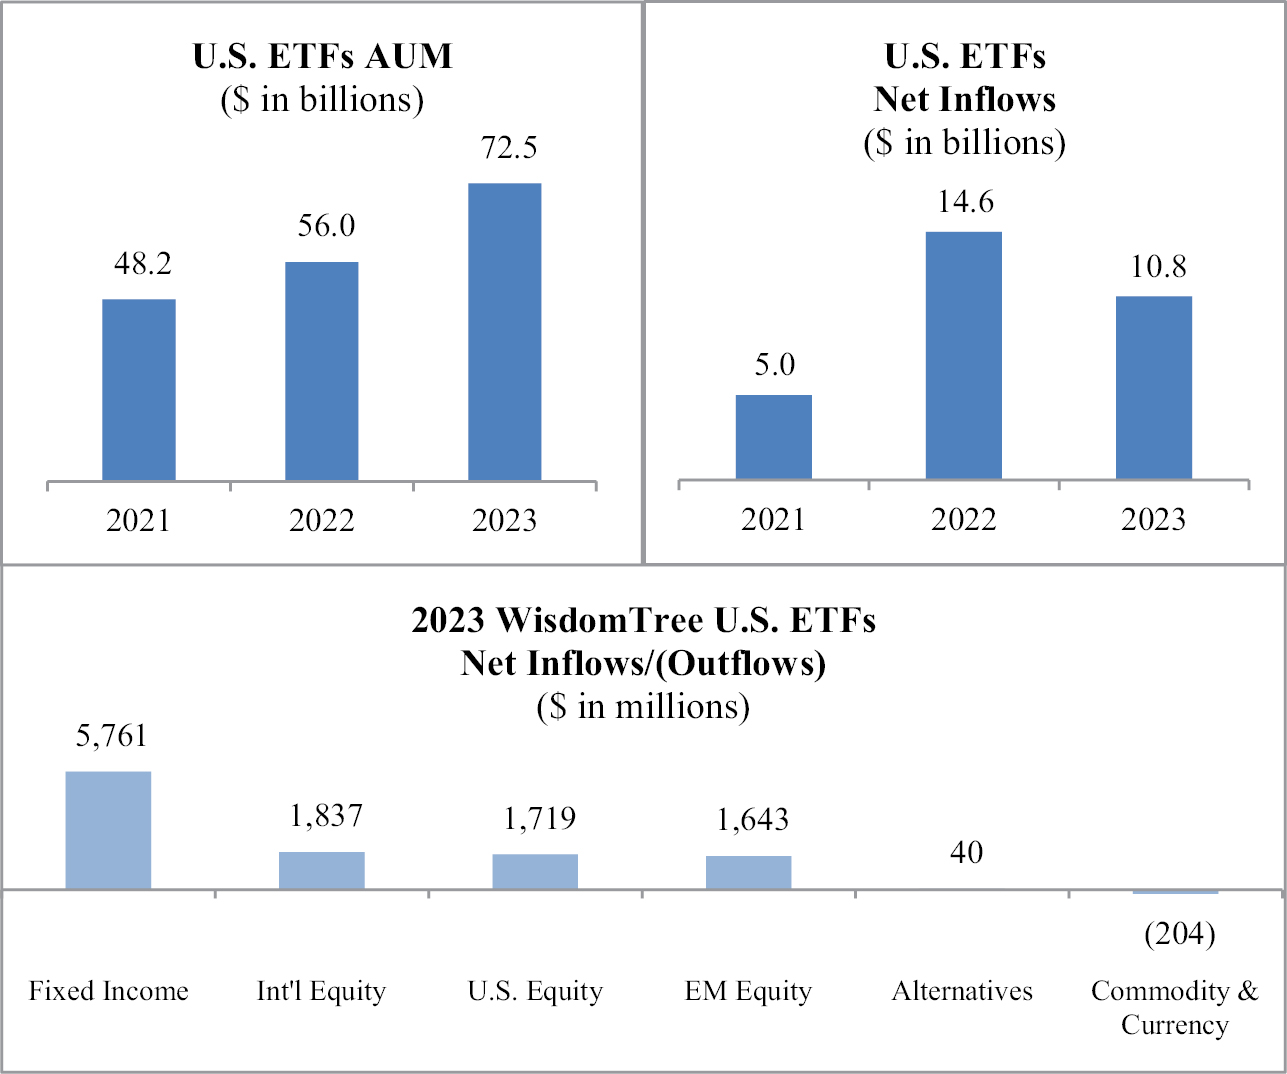
U.S. Listed ETFs
The AUM of our U.S. listed exchange traded funds, or U.S. listed ETFs, increased from $56.0 billion at December 31, 2022 to $72.5 billion at December 31, 2023 due to net inflows and market appreciation.
3
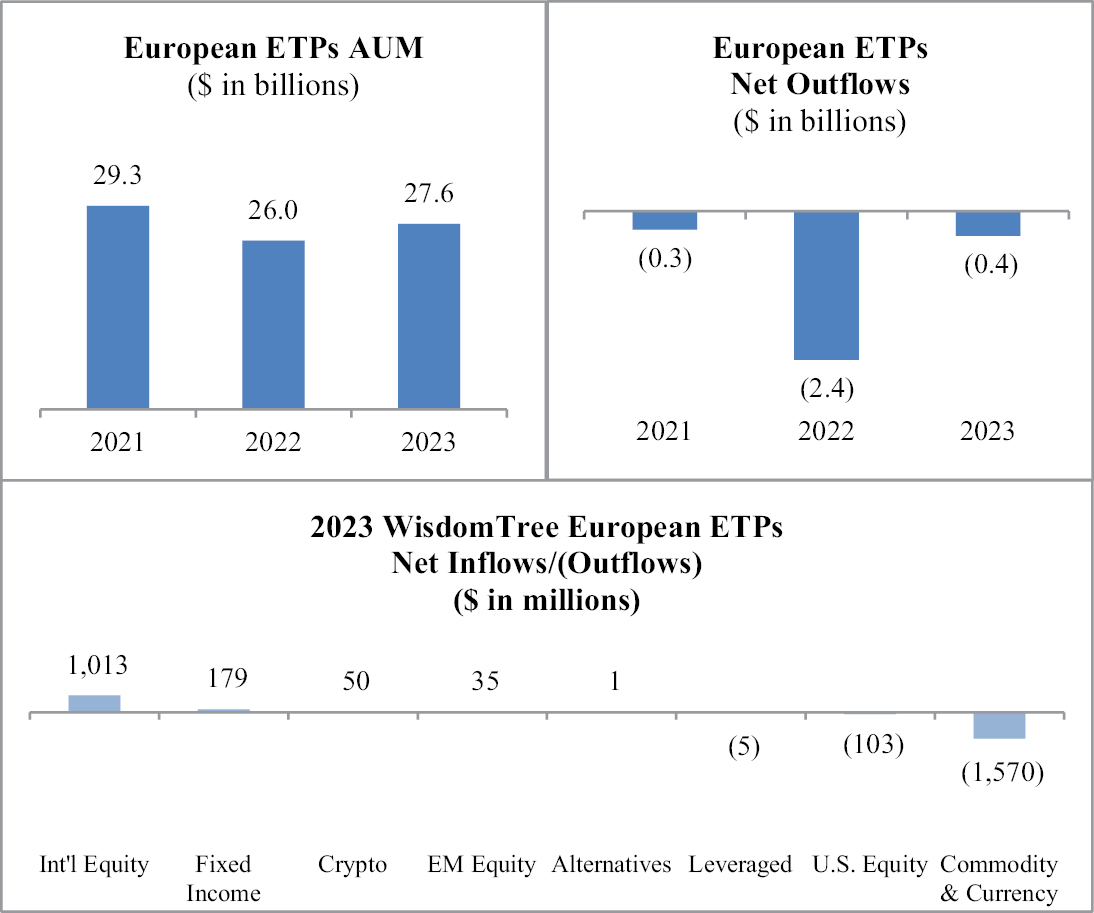
European Listed ETPs
The AUM of our European listed (including internationally cross-listed) ETPs, or European listed ETPs, increased from $26.0 billion at December 31, 2022 to $27.6 billion at December 31, 2023, due to market appreciation, partly offset by net outflows.
Consolidated Operating Results
The following table sets forth our revenues and net income for the last three years.
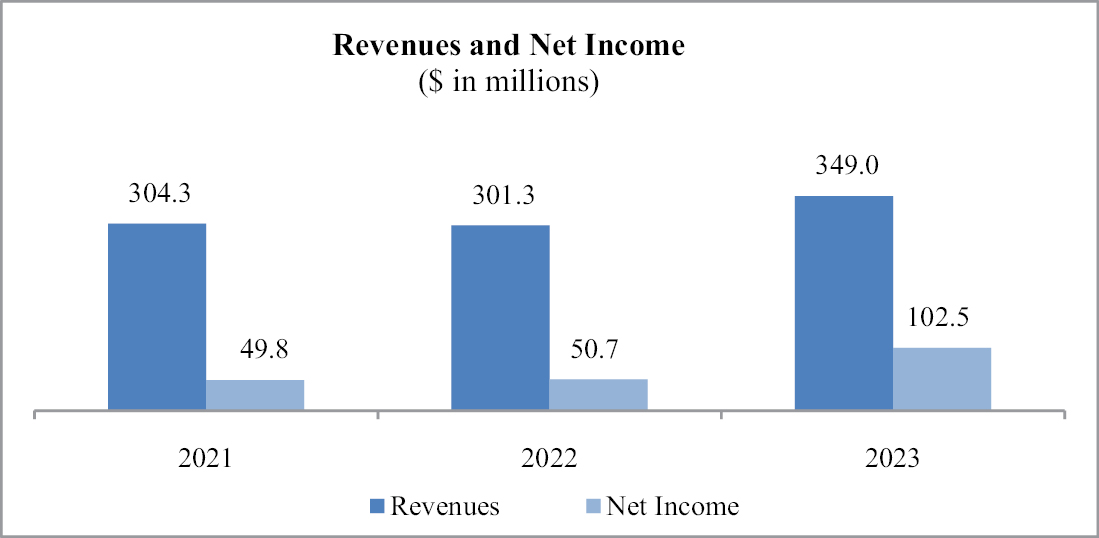
• Revenues – We recorded operating revenues of $349.0 million during the year ended December 31, 2023, up 15.8% from the year ended December 31, 2022 due to higher average AUM and higher other income from large flows from some of our European products, partly offset by a lower average advisory fee.
• Expenses – Total operating expenses increased 8.4% from the year ended December 31, 2022 to $261.5 million primarily due to higher stock-based compensation and headcount, fund management and administration costs, professional fees, marketing expenses, third-party distribution fees, sales and business development expenses and other expenses. These increases were partly offset by the termination of our deferred consideration—gold payments obligation on May 10, 2023.
• Other Income/(Expenses) – Other income/(expenses) includes interest income and interest expense, gains and losses on revaluation/termination of deferred consideration—gold payments, impairments and other losses and gains. See “Other Income/(Expenses)” in Item 7 “Management’s Discussion and Analysis of Financial Condition and Results of Operations” for additional information.
• Net income – We reported net income of $50.7 million and $102.5 million during the years ended December 31, 2022 and 2023, respectively.
See “Non-GAAP Financial Measures” included in Item 7 “Management’s Discussion and Analysis of Financial Condition and Results of Operations” for additional information.
4
Seasonality
We believe seasonal fluctuations in the asset management industry are common, however such trends are generally masked by global market events and market volatility in general. Therefore, period-to-period comparisons of our or the industry’s flows and operating results may not be meaningful or indicative of results in future periods.
Our Industry – ETPs
We believe ETPs have been one of the most innovative investment products to emerge in the last two decades in the asset management industry. As of December 31, 2023, aggregate AUM of ETPs globally was $11.6 trillion.
The chart below reflects the AUM of the global ETP industry since 2006:
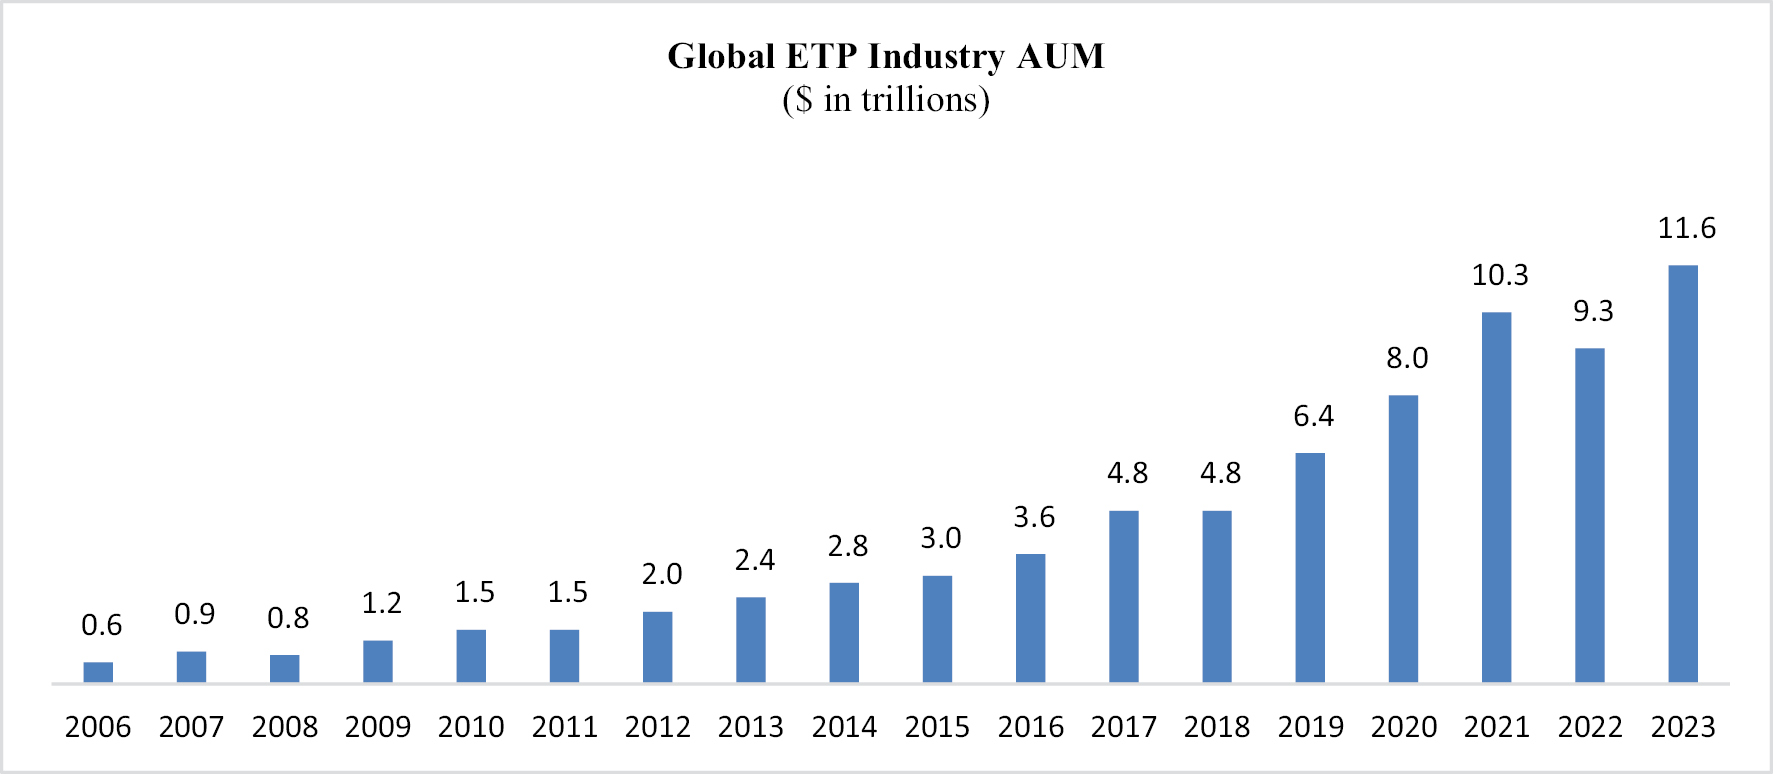
Source: ETFGI LLP
As of December 31, 2023, we were the fourteenth largest ETP sponsor globally based on AUM.
|
GLOBAL RANKING |
||||
|
Rank |
ETP Sponsor |
AUM |
||
|
1 |
iShares |
3,552 |
||
|
2 |
Vanguard |
2,505 |
||
|
3 |
State Street |
1,303 |
||
|
4 |
Invesco |
543 |
||
|
5 |
Charles Schwab |
319 |
||
|
6 |
Nomura |
230 |
||
|
7 |
Amundi |
229 |
||
|
8 |
Xtrackers |
207 |
||
|
9 |
First Trust |
155 |
||
|
10 |
JPMorgan |
153 |
||
|
11 |
Dimensional |
118 |
||
|
12 |
Nikko AM |
106 |
||
|
13 |
Daiwa |
101 |
||
|
14 |
WisdomTree |
100 |
||
|
15 |
UBS |
97 |
||
Source: Morningstar
Exchange traded funds, or ETFs, have become more popular among a broad range of investors as they come to understand the benefits of ETFs and use them for a variety of purposes and strategies, including low-cost index investing and asset allocation, access to specific asset classes, protective hedging, income generation, arbitrage opportunities and diversification.
5
While ETFs are similar to mutual funds in many respects, they also have some important differences:
• Transparency. ETFs disclose the composition of their underlying portfolios on a daily basis, unlike mutual funds, which typically disclose their holdings every 90 days.
• Intraday trading, hedging strategies and complex orders. Like stocks, ETFs and other exchange-traded products can be bought and sold on exchanges throughout the trading day at market prices. ETFs update the indicative values of their underlying portfolios every 15 seconds. As publicly-traded securities, ETF shares can be purchased on margin and sold short, enabling the use of hedging strategies, and traded using limit orders, allowing investors to specify the price points at which they are willing to trade.
• Tax efficiency. In the U.S., whenever a mutual fund or ETF realizes a capital gain that is not balanced by a realized loss, it must distribute the capital gain to its shareholders. These gains are taxable to all shareholders, even those who reinvest the gain distributions in additional shares of the fund. However, most ETFs typically redeem their shares through “in-kind” redemptions in which low-cost securities are transferred out of the ETF in exchange for fund shares in a non-taxable transaction. By using this process, ETFs can avoid the transaction fees and tax impact incurred by mutual funds that sell securities to generate cash to pay out redemptions.
• Uniform pricing. From a cost perspective, ETFs are one of the most equitable investment products on the market. Investors in a U.S. listed ETF pay identical advisory fees regardless of the investors’ size, structure or sophistication. Unlike mutual funds, U.S. listed ETFs generally do not have different share classes or different expense structures for retail and institutional clients and ETFs typically are not sold with sales loads or 12b-1 fees. In many cases, ETFs offer lower expense ratios than comparable mutual funds.
ETFs are used in various ways by a range of investors, from conservative to speculative uses including:
• Low-cost index investing. ETFs provide exposure to a variety of broad-based indexes across equities, fixed income, commodities and other asset classes and strategies, and can be used as both long-term portfolio holdings or short-term trading tools. ETFs offer an efficient and less costly method by which to gain exposure to indexes as compared to individual stock ownership.
• Improved access to specific asset classes. Investors often use ETFs to gain access to specific market sectors or regions around the world or a particular asset, such as physical gold or crypto, by investing in an ETF that holds a portfolio of securities in that sector, region or asset rather than gaining exposure by purchasing individual securities, physical commodities or currencies.
• Asset allocation. Investors seeking to invest in various asset classes to develop an asset allocation model in a cost-effective manner can do so easily with ETFs, which offer broad exposure to various asset classes in a single security.
• Protective hedging. Investors seeking to protect their portfolios may use ETFs as a hedge against unexpected declines in prices of securities arising from market movements and changes in currency and interest rates.
• Income generation. Investors seeking to obtain income from their portfolios may buy fixed income ETFs that typically distribute monthly income or dividend-paying ETFs that encompass a basket of dividend-paying stocks rather than buying individual stocks.
• Speculative investing. Investors with a specific directional opinion about a market sector may choose to buy or sell (long or short) an ETF covering or leveraging that market sector.
• Arbitrage. Sophisticated investors may use ETFs to exploit perceived value differences between the ETF and the value of the ETF’s underlying portfolio of securities.
• Diversification. By definition, ETFs represent a basket of securities and each fund may contain hundreds or even thousands of different individual securities. The “instant diversification” of ETFs provides investors with broad exposure to an asset class, market sector or geography.
The ETF sector of the asset management industry continues to demonstrate that it is favored among investors. According to Morningstar, from January 1, 2021 through December 31, 2023, equity ETFs have generated positive inflows of approximately $1.9 trillion, while long-term equity mutual funds have generated outflows of approximately ($830) billion. In addition, ETF fixed income flows are benefiting from a broader range of investors gravitating toward fixed income products in the ETF structure. We believe this trend is due to the inherent benefits of ETFs – transparency, liquidity and tax efficiency.
6
We believe that our growth, and the growth of the industry in which we operate, will continue to be driven by the following factors:
• Education and greater investor awareness. Over the last several years, ETPs have been taking a greater share of inflows and AUM from mutual funds. We believe investors have become more aware of some of the deficiencies of mutual funds and other financial products and are increasing their focus on important characteristics of their traditional investments – namely transparency, tradability, liquidity, tax efficiency and fees. Their attention and education focused on these important investment characteristics may be one of the drivers of the shift in inflows from traditional mutual funds to ETPs. We believe these products will continue to take market share from traditional mutual funds and other financial products or structures such as hedge funds, separate accounts and individual stocks as investors continue to become more aware and educated about ETPs and their benefits.
• Move to fee-based models. Financial advisors are shifting their business model from one that is “transaction-based,” that is, based on commissions for trades or receiving sales loads, to a “fee-based” approach, where an overall fee is charged based on the value of AUM. This fee-based approach lends itself to the advisor selecting lower-fee financial products, and in our opinion, better aligns advisers with the interests of their clients. Since ETFs generally charge lower fees than mutual funds, we believe this model shift will benefit the ETF industry.
• Innovative product offerings. ETPs are now available for virtually every asset class including equities, fixed income, commodities, leveraged-and-inverse, currencies, alternative strategies and cryptocurrencies (with greater access in markets outside the U.S.). However, we believe that there remain substantial areas for sponsors to continue to innovate, including cryptocurrency, liquid alternative, thematic and other strategies. We also believe the further expansion of ETPs will fuel additional growth and investments from investors who typically access these products through hedge funds, separate accounts, stock investments or the futures and commodity markets.
• Changing demographics. As the “baby boomer” generation continues to mature and retire, we expect that there will be a greater demand for a broad range of investment solutions, with an emphasis on income generation and principal protection, and that more of these investors will seek advice from professional financial advisors. We believe these financial advisors will migrate more of their clients’ portfolios to ETPs due to their lower fees, better fit within fee-based models, and their ability to provide access to more diverse market sectors, improve multi-asset class allocation, and be used for different investment strategies, including income generation. Overall, we believe ETFs are well-suited to meet the needs of this large and important group of investors. In addition, since many younger investors and financial advisors have demonstrated a preference for the ETP structure over traditional product structures, we believe that wealth transfers from one generation to another will also have a positive effect on ETP industry growth.
• International markets. We believe the growth of ETPs is a global phenomenon. While the U.S. currently represents the vast majority of global ETP assets, many of the same growth drivers in the U.S. market are also taking hold in global markets.
Our Industry – Digital Assets
We believe that digital assets, tokenization and blockchain technology will help to innovate and evolve financial services from an investments, savings, payments and operational perspective. The digital assets industry has picked up significant momentum among market participants, including asset management firms, fintech firms, banks, broker-dealers and investors, which has spurred unprecedented adoption, growth and innovation. We believe that the benefits of blockchain technology can provide for the best product structures and executions in financial services. We expect that over time, benefits will include the following:
• Transparency. Blockchain technology employs mutualized standards, protocols and shared processes, acting as a single shared source of truth for network participants. The increased transparency among financial institutions and market participants may also improve regulatory reporting and monitoring.
• Economic benefits. Automated, more efficient processes may lead to reduced operational, transactional and infrastructure costs.
7
• Streamlined processes. Automation and overall operational efficiency increases with the use of blockchain technology. It enables real-time (near instant) settlement, auditability and reporting; and it reduces processing times, the potential for error and delay, and the number of steps and intermediaries required to achieve the same levels of confidence in traditional processes, thereby reducing counterparty risks.
• New products and potential markets. Blockchain technology can make fractionalized ownership of real-world assets and tokenized economies a reality, with the same, if not better, level of security and scalability found in traditional finance.
• Programmable capabilities. Through the creation and execution of smart contracts, governance protocols, compliance, data privacy, customer identification (e.g., KYC/AML), system incentives and features can be programmed or built into the assets themselves.
• Scalability. Blockchain technology supports interoperability between private and public blockchains, thereby expanding the global reach and resiliency of transactions.
The laws and regulatory frameworks pertaining to digital assets and blockchain technology continue to evolve with an increase in scope and complexity. Contemporaneously, there has been heightened regulatory scrutiny of digital asset activities, which include material litigation and regulatory proceedings (e.g., enforcement actions) by government authorities, an increase in cybersecurity incidents leading to the theft or severe loss of assets, and insolvency proceedings (including bankruptcies) resulting from a variety of factors including poor risk management and oversight controls, speculative or risky behavior, and/or fraud or the misappropriation of customer funds. As a financial innovator seeking to bridge the gap between traditional finance and blockchain-enabled finance, we are embracing what we refer to as “responsible DeFi” for our digital assets and blockchain-enabled products and services, which we believe upholds the foundational principles of regulation in this innovative and rapidly evolving space. We are committed to being a trusted provider of innovative products and services guided by proactive engagement and continued collaboration with current and new regulators.
Competition in the digital assets industry on a global basis is increasing, ranging from large, established financial incumbents to smaller, early-stage financial technology providers and companies. There are jurisdictions with more stringent and robust regulatory and compliance requirements than others, which could impact the ability of a company to compete in the digital assets industry. We believe that we will continue to successfully compete in the digital assets industry by offering innovative products through digital asset exposures, generating strong after-fee performance and track records, embracing regulation, developing strategic partnerships with participants in the digital assets ecosystem, promoting thought leadership and investor education or awareness, building upon our brand and attracting and retaining talented employees. We remain focused on providing the best structures and executions in financial services through digital assets and blockchain technology.
Our Competitive Strengths
• Well-positioned in large and growing markets. We believe that ETPs are well positioned to grow significantly faster than the asset management industry as a whole, making our focus on ETPs an advantage over traditional asset management firms. We also believe that asset tokenization will be the future of financial services and expect our early-mover position in digital assets will serve to solidify our position as a forward-thinking innovator and industry leader in blockchain-enabled financial services.
• Strong, seasoned and creative management team. We have built a strong and dedicated senior leadership team. Most of our leadership team has significant ETP or financial services industry experience in fund operations, regulatory and compliance oversight, product development and management or marketing and communications. We also continue to expand our global digital assets team, which is focused on growing existing and developing new investment products, indexes and strategies that provide exposure to digital assets, along with new blockchain-enabled products and services across global markets. Whether through ETPs, digital assets or decentralized finance, we will continue to be a trusted provider of innovative products and services guided by proactive engagement and regulatory collaboration. We believe that our team has demonstrated an ability to innovate as well as recognize and respond to market opportunities and effectively execute our strategy and has a proven track record including developing an ETP sponsor from the ground up despite significant competitive regulatory and operational barriers.
8
• Strong performance. We create our own indexes, most of which weight companies in our equity ETFs by a measure of fundamental value and are rebalanced annually. By contrast, traditional indexes are market capitalization weighted and tend to track the momentum of the market. We also offer actively managed ETFs, as well as ETFs based on third-party indexes. In evaluating the performance of our U.S. listed equity, fixed income and alternative ETFs against actively managed and index based mutual funds and ETFs, over 80% of our U.S. listed AUM covered by Morningstar were in the top two quartiles of peer performance in the 3-year and 10-year timeframes. In addition, approximately 50% of our U.S. listed AUM is rated 4- or 5-star by Morningstar.
• Differentiated product set, powered by innovation and performance. Our products span a variety of traditional and high growth asset classes covering equity, fixed income, commodity, leveraged-and-inverse, currency, alternative strategies and cryptocurrency, and include both passive and actively managed funds. We are also developing and have launched next-generation digital products, services and structures, including Digital Funds and tokenized assets. Our innovations include the following:
• the launch of the WisdomTree Prime mobile application, our blockchain-native digital wallet that serves as a new direct-to-consumer channel positioning us as an early mover and industry leader in blockchain-enabled financial services; the application is currently available in 38 states in the U.S., representing approximately 70% of the U.S. population;
• the tokenization of real-world assets like physical gold (i.e., gold tokens) and U.S. dollars (i.e., dollar tokens);
• 13 Digital Funds accessible through WisdomTree Prime including a government money market fund and other digital funds offering asset allocation, fixed income and equity exposures that use blockchain technology to maintain a secondary record of their respective shares on one or more blockchains (e.g., Stellar or Ethereum);
• among the first to launch a spot bitcoin ETF in the U.S.;
• the first ETF to add bitcoin futures exposure;
• the first gold and oil ETPs via our acquisition of the European exchange-traded commodity, currency and leveraged-and-inverse business of ETFS Capital Limited, or ETFS Capital. Throughout this Report, we refer to the acquired business as ETFS and the acquisition as the ETFS Acquisition;
• the first emerging markets small-cap equity ETF;
• the first actively managed currency ETF;
• the first ETF to provide investors with access to the Additional Tier 1 Contingent Convertible, or CoCo, bond market;
• one of the first international local currency denominated fixed income ETFs;
• the first managed futures strategy ETF;
• the first currency hedged international equity ETFs in the U.S.;
• the first 90/60 balanced ETF;
• the first multifactor ETFs incorporating dynamic currency hedging as a factor; and
• the first smart beta corporate bond suite.
Our product development strategy utilizes our Modern Alpha approach, which combines the outperformance potential of active management with the benefits of passive management to offer investors cost-effective funds that are built to perform. Self-indexing is a significant component of this approach. Many of our products are based on proprietary WisdomTree indexes which we believe gives us several advantages. First, it minimizes our third-party index licensing fees, which increases our profitability. Second, because we develop our own intellectual property, we are intimately familiar with our strategies and able to effectively communicate their value proposition in the market with research content and support. Third, it can enhance our speed to market and first mover advantage. Fourth, because these indexes are proprietary to WisdomTree, we may face similar competition, but we never face exact competition. Our expertise in product development combined with our self-indexing capabilities provides a strategic advantage, enabling us to launch innovative products. Building on our heritage of innovation, we are developing and have launched next-generation digital products and structures, including Digital Funds and tokenized assets.
9
• Extensive marketing, research and sales efforts. We have invested significant resources to establish the WisdomTree brand and to promote our products through online and television targeted advertising and social media, as well as through our public relations efforts. Close to 40% of our employees are dedicated to marketing, research and sales. Our sales professionals are the primary points of contact for financial advisors, independent advisory firms and institutional investors who invest in our ETPs. Their efforts are enhanced through value-added services provided by our research and marketing efforts. We have strong relationships with financial advisors and institutional investors and we believe that by strategically aligning these advisor relationships and marketing campaigns with targeted research and sales initiatives and products that align with market sentiment, we differentiate ourselves from our competitors.
• Efficient business model with lower risk profile. We have invested heavily in digital tools and data to market and sell our products and in the internal development of our core competencies with respect to product development, marketing, research and sales of our products. We outsource to third parties those services that are not our core competencies or may be resource or risk intensive, such as the portfolio management responsibilities and fund accounting operations of our products. In addition, our licensing costs are moderated since we create our own indexes for most of our ETFs.
Our Growth Strategies
We are a global financial innovator, offering a well-diversified suite of ETPs, models, solutions and products leveraging blockchain-enabled technology, with AUM of $100.1 billion as of December 31, 2023. We are at the forefront of innovation and believe that tokenization and leveraging the utility of blockchain technology is the next evolution in financial services. We are building the foundation that we believe will allow us to lead in this coming evolution. WisdomTree Prime, our blockchain-native digital wallet, positions us to expand our blockchain-enabled financial services product offerings with a new direct-to-consumer channel where spending, saving and investing are united. As we continue to pursue our digital assets strategy, we are embracing what we refer to as “responsible DeFi,” which we believe upholds the foundational principles of regulation in this innovative and rapidly evolving space. We believe that our expansion into digital assets complements our existing core competencies in a holistic manner and will diversify our revenue streams and contribute to our growth. Our strategy includes the following:
• Launch innovative ETPs that diversify our product offerings and revenues. We have launched many first-to-market ETFs in the U.S. and pioneered alternative weighting and performance methods we call “Modern Alpha,” which combines the outperformance potential of active management with the benefits of passive management to offer investors cost-effective funds that are built to perform. Our growth plan focuses on filling strategic gaps and seizing tactical opportunities by launching new products globally.
• Establish ourselves as a leader in digital assets and blockchain-enabled financial services. Our deep experience with innovation and proven track record of entering new asset classes and markets, coupled with our firmwide strategic attention on blockchain-enabled finance and a culture focused on governance and risk management with a regulatory minded approach positions us to become a leader in the digital assets industry. We are an early mover in this space, with the launch of our blockchain-native digital wallet, WisdomTree Prime, a new direct-to-consumer channel where spending, saving and investing are united. WisdomTree Prime provides access to bitcoin, ether, tokenized gold and U.S. dollar tokens, as well as 13 Digital Funds, including a government money market fund and other digital funds offering asset allocation, fixed income and equity exposures. In addition, we have partnered with a financial institution to provide co-branded debit cards to our retail customers on the WisdomTree Prime platform. We continue to focus on enhancing the products and capabilities of the platform with plans to allow for peer-to-peer transfers and payments. We are also exploring strategic partnerships and other business development opportunities for both our platform and product suite that could unlock additional tokenization revenue streams in the future.
• Foster deeper client relationships through technology-enabled and research-driven solutions. We believe technology is altering the way financial advisors conduct business. Our Advisor and Portfolio Solutions programs provide technology-enabled and research-driven solutions to help financial advisors grow and scale their businesses and address their technology challenges.
10
The Advisor and Portfolio Solutions programs include:
• access to our U.S. model portfolios which are available to over 70,000 advisors across a number of platforms, including, Merrill Lynch, Morgan Stanley, LPL Financial, Charles Schwab, Envestnet, 55ip and others. Our model portfolios are a natural extension of our research capabilities and provide advisors access to an open-architecture approach, a tenured team and a firm dedicated to innovation and value creation. As part of this initiative, we launched a series of model portfolios in collaboration with Professor Jeremy Siegel;
• providing customized portfolio and asset allocation services to support registered investment advisers and independent broker dealers in building, implementing, and managing their client portfolios while providing strategic guidance for advisors to support their business growth;
• access to portfolio construction tools such as our award-winning Portfolio Analysis Tools Hub (PATH), an enhanced portfolio construction tool that assists financial advisors in analyzing an existing investment portfolio by examining the data and providing alternative portfolio approaches to consider in seeking to improve outcomes based on different measures;
• wealth investment research and ETF education; and
• practice management resources, including access to thought leaders in behavioral finance, leadership, and transforming wealth management technology.
• Deepen relationships with distribution platforms. We maintain relationships with certain distribution platforms that allow commission-free trading of our ETFs. These relationships are beneficial to us as they can provide greater marketing privileges and access to the platforms’ advisors. As financial advisors continue to migrate away from mutual funds, we use our expertise in ETFs to build new relationships and educate advisors about the benefits of ETFs. Some of these relationships that exist today are with LPL Financial, BNY Mellon/Pershing, Raymond James, Charles Schwab, Cetera and others.
• Leverage data intelligence to serve and expand investor base and improve sales and marketing effectiveness. We utilize a cognitive customer-focused lead prioritization system which has enhanced our distribution efforts. The system evaluates data across structured and unstructured sources such as historical investment data, market data and investor activity history, extracting behavioral insights, and is designed to enable our sales and marketing teams to optimize outreach to our current and potential investor base.
• Selectively pursue acquisitions or other strategic transactions. We may pursue acquisitions or other strategic transactions that will enable us to strengthen our current business, expand and diversify our product offerings, complement our Advisor and Portfolio Solutions programs, increase our AUM or enter into new markets. We believe pursuing acquisitions or other strategic transactions is a cost-effective means of growing our business and AUM.
Human Capital Resources
We compete in the highly competitive asset management industry. Attracting, retaining and motivating highly skilled, and sometimes highly specialized, employees in operations, product development, research, technology, sales and marketing and other positions is crucial to our ability to compete effectively. Our ability to recruit and retain such employees depends on a number of factors, including our corporate culture and work environment, informed by our values and behaviors, talent development and career opportunities and compensation and benefits. We strive to differentiate ourselves through our sense of community and purpose integrated into our culture, while encouraging a culture where every employee has a voice.
Employee Profile
At December 31, 2023, we had 303 full-time employees globally, consisting of 190 in the U.S. and 113 in Europe. We consider our relations with employees to be good.
Diversity, Equity and Inclusion (DEI)
We recognize that a diverse set of perspectives is critical to innovation and have built a diverse global workforce, inclusive of gender, race, ethnicity, religion, age, gender identity, gender expression and sexual orientation, as well as those in the disabled community. We actively seek candidates from different backgrounds and outside traditional fields and reinforce our commitment to diversity through organizational policies, such as mandating fairness and equality for all employees and creating performance appraisal systems that are non-discriminatory.
11
At WisdomTree, we envision a future of investment excellence driven by a commitment to continuously strengthen our diverse, equitable and inclusive workplace culture. Our DEI Council, formed in 2021, is comprised of senior leaders and employees from both the U.S. and Europe and provides oversight and guidance in connection with the implementation of programs designed to foster a culture where every employee thrives, leveraging diverse perspectives and inclusive practices. For example, in 2023, the DEI Council held training sessions on understanding neurodiversity, implicit bias and embedding inclusion in feedback, roundtables on success and failure, and financial literacy workshops for employees and secondary school students. The DEI Council also promoted awareness days and months across the firm including with respect to black history, women’s history, pride, mental health and men’s health.
Our Women’s Initiative Network, or WIN, is a global employee-led network designed to provide opportunities and support from all genders for women at WisdomTree, career development and professional training opportunities, and female empowerment and leadership within the organization. Since its inception in 2019, WIN has held numerous global events, including panel discussions on women in the workforce featuring WisdomTree employees and notable guest speakers, interactive seminars on topics including negotiation skills, workshops and coaching sessions to enhance confidence to speak up, and various roundtable forums, informal coffee catch-ups and in-person and virtual social gatherings to promote connectivity and increase engagement. WIN also produces regular internal “spotlight” newsletters to increase visibility and raise the profile of our female employees. Both this initiative and WIN’s coffee catch-up initiative evolved into successful firm-wide initiatives. In addition, through WIN’s mentorship program, WIN members of all genders are connected with firm leaders who can help them achieve their career development goals.
Employee Wellness, Health and Safety
The wellbeing of our employees is a primary focus. We are continuously evolving and refining how we work best to achieve individual, team and Company goals. To that end, we have embraced a “Work Smart” philosophy that transcends physical work settings, with a focus on optimizing productivity, efficiency and effectiveness of our work. Time in the office generally is not prescribed, and team leaders are empowered to determine how their teams work best, based on their roles, with employees remaining accountable for achieving individual, team and Company outcomes. To foster employee wellbeing and a healthy work-life balance, we offer numerous wellness programs including meditation and yoga classes, health webinars, a weekly wellness newsletter and access to mental health professionals and other resources. Leveraging technology, we enhance the employee experience through digital wellness platforms, facilitating remote access to health and wellbeing resources. We also offer paid vacation (unlimited in the U.S.) and sick leave policies to provide employees additional flexibility, and our U.S. employees enjoy additional “wellness days,” which are scheduled office closures around major market holidays for employees to collectively disconnect and rejuvenate. We support employees with their information technology needs, provide a monthly stipend to cover remote work-related business expenses and provide guidance for managers to ensure that employees remain connected and maintain physical, mental and emotional wellbeing.
In keeping with “Work Smart,” we now maintain a smaller office footprint globally to better align with the number of employees expected to collaborate in person on any given day, while providing a space for employees to work and socialize. As the safety and security of our employees who choose to work in our office space are of critical importance, we have selected office buildings with robust security procedures, fire safety and sanitation and health practices.
Compliance, Training and Development
We comply with all applicable government laws, rules and regulations and it is the responsibility of each employee to adhere to the standards and restrictions imposed by those laws, rules and regulations. All new employees attend a compliance training session with a compliance officer, and thereafter, employees are required to attend firmwide annual compliance training and to complete compliance certifications annually and in some instances, quarterly. We also conduct mandatory cybersecurity training and other training programs as required by law.
As we believe that our employees are our greatest asset, we recognize the importance of investing in their continued development. We provide a variety of opportunities for our employees to build new skills and further their career development. These include role-specific training courses, virtual lunches with senior leaders in a small group setting and webinars hosted by various departments to gain a holistic view of the Company. We also support employees’ continuing education, including through our educational assistance program. In addition, we invest in our current and future leaders through leadership development courses and individual and team coaching. We also hold monthly regional and quarterly global town halls to inform our employees of business developments, employee news and job openings, as well as to provide opportunities for employees to hone their presentation skills by sharing department updates.
12
Employee Engagement
We believe engaging our employees is key to fostering new ideas and driving commitment and productivity. We communicate frequently and transparently with our employees through a variety of communication methods, including an annual global virtual offsite where senior leaders review the firm’s prior-year accomplishments and articulate the objectives for the coming year, and each department presents its respective prior-year accomplishments and current-year objectives, monthly regional and quarterly global town halls and firmwide weekly emails championing the team’s work. We also seek feedback from our employees through annual engagement surveys and follow-up pulse surveys on various topics. In addition, we provide opportunities for employees to participate in volunteer and charitable events.
We also believe it is important to celebrate employee and Company accomplishments. In 2023, we celebrated our fourth annual “Team Alpha” Awards to mark significant events and successes and to recognize employees who led those successes while exhibiting extraordinary teamwork and demonstrating strong character. Over 50 nominations were submitted and narrowed down by a selection committee. The winners received a modest incentive compensation award, the opportunity to donate to a charity of their choice and to recognize other employees who assisted them.
The success of our employee engagement efforts is demonstrated by our employee retention rate of approximately 93.4% in 2023. We also achieved overall positive results from our 2023 global employee engagement survey, with a 99% participation rate. Additionally, in the U.S., we were named a “2023 Best Places to Work in Money Management” by Pensions & Investments for the fourth consecutive year and seventh year since the award was created. We ranked second within the category for managers with 100-499 employees, the second consecutive year earning a ranking among the top five employers. In the U.K., we were also named Best Workplace for medium-sized companies for a fourth consecutive year and a 2023 Best Workplace for Women for medium-sized companies by Great Place to Work.
Compensation and Benefits
We are committed to rewarding and supporting our employees in order to continue to attract and retain top talent. Our incentive compensation program has been designed to reward our employees for their individual performance as well as the Company’s performance and includes various quantitative metrics and qualitative results that incentivize growth. We believe a key factor in our success has been and continues to be fostering an entrepreneurial culture where our employees act and think like our owners. As such, we believe that equity awards are an important part of our employees’ overall compensation package and that incentivizing our employees with equity aligns the interests of our employees with our stockholders. We also offer a wide array of benefits including generous healthcare coverage, paid vacation (unlimited in the U.S.), parental, sabbatical and sick leave, life and travel insurance, short- and long-term disability benefits and, in the U.S., a 401(k) plan with a matching contribution of up to 50% of eligible employee contributions.
Our Product Categories
U.S. Equity
We offer equity products that provide access to the securities of large, mid and small-cap companies located in the U.S., as well as particular market sectors and styles. Our U.S. Equity products track our own indexes, the majority of which are fundamentally weighted as opposed to market capitalization weighted indexes, which assign more weight to stocks with the highest market capitalizations. These fundamentally weighted indexes focus on securities of companies that pay regular cash dividends or on securities of companies that have generated positive cumulative earnings over a certain period. We believe weighting equity markets by dividends and income, rather than by market capitalization, can provide investors with better risk-adjusted returns over longer term periods in core equity exposures. Total AUM of our U.S. Equity products was $29.2 billion at December 31, 2023.
Commodity & Currency
We offer products in Europe with exposure to gold and other precious metals and commodities such as silver and platinum, oil and energy, agriculture and broad basket commodities. Our currency products provide investors with exposure to developed and emerging markets currencies, as well as exposures to foreign currencies relative to the U.S. dollar. Total AUM of our Commodity & Currency products was $21.3 billion at December 31, 2023.
13
Fixed Income
Our Fixed Income products seek to enhance income potential within the fixed income universe. We offer a suite of rising rate bond products based on leading fixed income benchmarks we license from third parties. We also launched the industry’s first smart beta corporate bond suite. Other product offerings include those that seek to track a yield-enhanced index of U.S. investment grade bonds and international fixed income products which are denominated in either local or U.S. currencies. Total AUM of our Fixed Income products was $21.2 billion at December 31, 2023.
International Developed Market Equity
Our International Developed Market Equity products offer a variety of strategies including currency hedged and dynamic currency hedged products, exposures to large, mid and small-cap companies in these markets and multifactor strategies. Total AUM of our International Developed Market Equity products was $15.1 billion at December 31, 2023.
Emerging Market Equity
Our Emerging Market Equity products provide access to exposure of large, mid and small-cap companies located in Taiwan, China, India, Russia, South Africa, South Korea and other emerging markets regions. These products also track our own indexes, which are fundamentally weighted focusing on securities of companies that pay regular cash dividends or that have generated positive cumulative earnings over a certain period. Total AUM of our Emerging Market Equity products was $10.7 billion at December 31, 2023.
Leveraged & Inverse
We offer leveraged products which seek to achieve a return that is a multiple of the performance of the underlying index and inverse products that seek to deliver the opposite of the performance in the index or benchmark they track. Strategies span across equity, commodity, government bond and currency exposures. Total AUM of our Leveraged & Inverse products was $1.8 billion at December 31, 2023.
Cryptocurrency
Our cryptocurrency ETPs provide investors with a simple, secure and cost-efficient way to gain exposure to the price of cryptocurrencies, while utilizing the best of traditional financial infrastructure and product structuring. We offer exposures to bitcoin, ether, crypto asset baskets and other cryptocurrency exposures. Total AUM of our cryptocurrency products was $0.4 billion at December 31, 2023.
Alternatives
Our Alternative products include the industry’s first managed futures strategy ETF and a global real return ETF. We also offer a dynamic long/short U.S. equity ETF, a dynamic bearish U.S. equity ETF and a collateralized put write strategy ETF on the S&P 500 index. We also intend to explore additional alternative strategy products in the future. Total AUM of our Alternative products was $0.4 billion at December 31, 2023.
Our Sales, Marketing and Research Efforts
Sales
We distribute our ETPs through all major channels within the asset management industry, including banks, brokerage firms, registered investment advisers, institutional investors, private wealth managers and online brokers. Our primary sales efforts are not directed towards the retail segment but rather are directed towards the financial or investment adviser who acts as the intermediary between the end-client and us. We do not pay commissions, nor do we offer 12b-1 fees to financial advisors to use or recommend the use of our products.
We have developed an extensive network and relationships with financial advisors and we believe that our ETPs and related research are well structured to meet their needs and those of their clients. We have taken steps to enhance and form new relationships through our Advisor and Portfolio Solutions programs, including providing customized portfolio and asset allocation services to support registered investment advisers and independent broker dealers in building, implementing and managing their client portfolios while providing strategic guidance for advisors to support their business growth. Our Advisor and Portfolio Solutions programs also provide technology-enabled and research-driven solutions to help financial advisors grow and scale their businesses.
14
In addition, senior and academic advisors of ours, including Professor Jeremy Siegel, Senior Economist to WisdomTree, participate as keynote speakers in various industry and WisdomTree hosted conferences and events. Our sales professionals act in a consultative role to provide financial advisors with value-added services. We seek to consistently grow our network of financial advisors and we opportunistically seek to introduce new products and services that best deliver our investment strategies to investors through these distribution channels. We have our own team of 77 sales professionals globally as of December 31, 2023.
In addition, we have agreements with third parties to serve as the external marketing agents for our products in Latin America and Israel, as well as with select brokerage firms and independent broker-dealers to allow certain of our products to trade commission free on their platforms in exchange for a percentage of our advisory fee revenues from certain AUM. We believe these arrangements expand our distribution capabilities in a cost-effective manner and we may continue to enter into such arrangements in the future.
Marketing
Our marketing efforts are focused on the following objectives: increase our global brand awareness, leverage a robust data-driven digital sales experience to generate new clients and drive inflows to our products and model portfolios and retain existing clients, with a focus on cross-selling additional WisdomTree ETPs. We also anticipate launching marketing campaigns to drive awareness and user adoption for WisdomTree Prime and to position ourselves to become a leader in asset tokenization and blockchain-enabled funds. We pursue these objectives utilizing the following strategies:
• Targeted advertising. We create highly targeted multi-media advertising campaigns limited to established core financial media. For example, our television advertising to promote our ETPs runs exclusively on the cable networks CNBC, Fox Business and Bloomberg. It is anticipated that television advertising also will be utilized to promote WisdomTree Prime. Also, our digital advertising runs on many investing and ETF-specific web-sites, such as www.etftrends.com and www.etfdb.com, using targeted dynamic and personalized ad messaging. We also utilize non-linear TV advertising that leverages the same targeted segments of users who use streaming devices. In Europe, we filter the targeting of promotions by both region and language, focusing heavily on professional investors.
• Media relations. We have a full-time global corporate communications and public relations team that has established relationships with major financial and digital assets media outlets. We utilize these relationships to help increase global awareness of WisdomTree ETPs, the ETP industry in general in the U.S. and Europe and our digital assets efforts. Several members of our management team and multiple members of our research team are frequent market commentators and conference panelists.
• Database Messaging Strategy. We have a database of financial advisors to whom we regularly market through a series of messages across channels (email, display, site) that are triggered based on user interest and predictive analytics, on-demand research presentations, ETP-specific or educational events and presentations, and market commentary from Professor Jeremy Siegel, Senior Economist to WisdomTree. Additionally, in the U.S., we communicate to our retail database about new product launches and provide ETF education through a monthly newsletter.
• Social media. We have implemented a social media strategy that allows us to connect directly with financial advisors and investors by offering timely access to our research material and more general market commentary. Our social media strategy allows us to continually enhance our brand reputation of expertise and thought leadership in the ETP industry. For example, we have an established presence on LinkedIn, X (formerly Twitter), Instagram, Reddit and YouTube, and our blog content is syndicated across multiple business-oriented websites. We also leverage the strength and reach of our existing brand, in addition to utilizing a highly focused “test, learn, iterate” paid and social media marketing strategy, to drive awareness and user adoption for WisdomTree Prime.
• Sales support. We create comprehensive materials to support our sales process of our ETP products, including whitepapers, research reports, webinars, blogs, podcasts, videos and performance data for our products. Our marketing automation system connects seamlessly to our database of financial advisors to provide the sales team with additional insights about their clients.
We will continue to evolve our marketing and communication efforts in response to changes in the ETP industry, market conditions, marketing trends and our evolving strategy around digital assets.
15
Research and Chief Investment Office
Our research team and chief investment office has four core functions: product development and oversight, investment research, model portfolio management and sales support across equities, fixed income, alternatives, crypto and asset allocation portfolios. In its index and active product development and oversight role, the group is responsible for creating the investment methodologies and overseeing the maintenance of indexes and active strategies. The team also provides a variety of investment research around these indexes and markets and manages a series of model portfolios that incorporate WisdomTree and third-party products for various investment platforms, including WisdomTree Prime. Our research is typically academic-type research to support our products, including white papers on the strategies underlying our indexes and ETPs, investment insights on current market trends, and types of investment strategies that drive long-term performance. We distribute our research and insights through our sales professionals, online through our website and blog, targeted emails to financial advisors, or through financial media or social media outlets. Finally, the team supports our sales professionals in meetings as market experts and through custom analysis on client portfolio holdings. In addition, we consult with our senior advisers, including Professor Jeremy Siegel, Senior Economist to WisdomTree, on product development ideas, model collaboration and market commentaries.
Product Development
We are focused on driving continued growth through innovative product development including through our Modern Alpha approach and our digital assets offerings. Modern Alpha combines the outperformance potential of active management with the benefits of passive management to offer investors cost-effective products that are built to perform.
Due to our proprietary index development capabilities and a strategic focus on product development, we have demonstrated an ability to launch innovative and differentiated ETPs. Building on our heritage of innovation, we are also developing next-generation digital products and structures, including Digital Funds and tokenized assets. When developing new products, we seek to position ourselves as first to market, offering improvement in structure or strategy relative to an incumbent product or offering some other key distinction relative to an incumbent product. In short, we want to add choice in the market and seek to introduce thoughtful investment solutions. Lastly, when launching new products, we seek to expand and diversify our overall product line.
Competition
The asset management industry is highly competitive and we face substantial competition in virtually all aspects of our business. Factors affecting our business include fees for our products, our offerings and investment performance, brand recognition, business reputation, quality of service and the continuity of our financial advisor and platform relationships. We compete directly with other ETP sponsors and mutual fund companies and indirectly against other investment management firms, insurance companies, banks, brokerage firms and other financial institutions. Many of the firms we compete with are subsidiaries of large diversified financial companies and many others are much larger in terms of AUM, years in operations and revenues and, accordingly, have much larger sales organizations and budgets. In addition, these larger competitors may attract business through means that are not available to us, including retail bank offices, investment banking, insurance agencies and traditional broker-dealers.
ETPs are now available for virtually every asset class including equities, fixed income, commodities, alternative strategies, leveraged-and-inverse, currencies and cryptocurrencies. Existing players have broadened their suite of products offering strategies that are, in some cases, similar to ours and large traditional asset managers are also launching ETPs, some with similar strategies as well. There remain substantial areas for sponsors to continue to innovate, including but not limited to cryptocurrency, liquid alternative, thematic and other strategies.
Price competition exists in not only commoditized product categories such as traditional, market capitalization weighted index exposures and commodities, but also in non-market capitalization weighted or factor-based exposures and commodities. Fee reductions by certain of our competitors has been a trend over the last few years and continues to persist and many of our competitors are well positioned to benefit from this trend. Certain larger competitors are able to offer products at lower price points or otherwise as loss leaders due to other revenue sources available within such competitors that are currently unavailable to us. Newer players have also been entering the ETP industry and frequently seek to differentiate by offering ETPs at a lower price point. Funds are being offered with fees of 20 basis points or less, which have attracted approximately 80% of the net flows globally during the last three years. However, while these low-cost products have accumulated a significant amount of AUM recently, we estimate that these same funds represent only approximately 34% of global revenues.
16
Being a first mover, or one of the first providers of ETPs in a particular asset class, can be a significant advantage, as the first ETP in a category to attract scale in AUM and trading liquidity is generally viewed as the most attractive product. We believe that our early launch of products in a number of asset classes or strategies, including fundamental weighting and currency hedging, along with commodities including gold, certain fixed income, alternative and thematic categories, positions us well to maintain our standing as one of the leaders of the ETP industry. Additionally, we believe that our affiliated indexing or “self-indexing” model, as well as our more recent active ETFs, enable us to launch proprietary products that do not have direct competition and are positioned to generate alpha versus benchmarks. As investors increasingly become more comfortable with the product structure, we believe there will be a greater focus on after-fee performance rather than using ETPs primarily as low-cost market access vehicles. While we have selectively lowered fee rates on certain products that have yet to attain scale, and there is no assurance that we will not lower fee rates on certain products in the future, our strategy continues to include launching new funds in the same category with a differentiated exposure at a lower fee rate, rather than reducing fees on existing products with a significant amount of AUM, long performance track records, and secondary market liquidity, which continue to remain competitively priced for the value provided, among other factors. We generally believe we are well positioned from a product pricing perspective.
We also have been positioning ourselves to expand beyond our existing ETP business by leveraging blockchain technology, digital assets and principles of DeFi to deliver transparency, choice and inclusivity to customers and consumers around the world. Our blockchain-native digital wallet, WisdomTree Prime, provides access to bitcoin, ether, tokenized gold and U.S. dollar tokens, as well as 13 Digital Funds, including a government money market fund and other digital funds offering asset allocation, fixed income and equity exposures. These products have been developed with the ability to be recorded and/or transferred on multiple public and/or permissioned blockchains with interoperability between blockchains. In addition, we were among the first to launch a spot bitcoin ETF in the United States. We believe this expansion complements our core competencies in a holistic manner, will diversify our revenue streams and contribute to our growth. Competition in the digital assets industry on a global basis is increasing, ranging from large, established financial incumbents to smaller, early-stage financial technology providers and companies. There are jurisdictions with more stringent and robust regulatory and compliance requirements than others which could impact the ability of a company to compete in the digital assets industry. We are embracing what we refer to as “responsible DeFi” for our anticipated and expanded products and services which we believe upholds the foundational principles of regulation in this innovative and quickly evolving space. We remain committed to being a trusted provider of innovative products and services guided by proactive engagement and continued collaboration with current and new regulators.
Our ability to successfully compete will depend largely on offering innovative products through traditional ETPs and digital asset exposures (and more broadly in blockchain-enabled finance, including savings and payments), having strong internal controls and risk management infrastructure to enable customer trust, generating strong after-fee performance and track records, embracing regulation, developing distribution relationships, promoting thought leadership and a differentiated solutions program, building upon our brand and attracting and retaining talented sales professionals and other employees.
Regulatory Framework of the ETP Industry and Digital Assets Business
ETPs
Not all ETPs are ETFs. ETFs are a distinct type of security with features that are different than other ETPs. ETFs are open-end investment companies or unit investment trusts regulated in the U.S. by the Investment Company Act of 1940, as amended, or the Investment Company Act. This regulatory structure is designed to provide investor protection within a pooled investment product. For example, the Investment Company Act requires that at least 40% of the Trustees for each ETF must not be affiliated persons of the fund’s investment manager, or Independent Trustees. If the ETF seeks to rely on certain rules under the Investment Company Act, a majority of the Trustees for that ETF must be Independent Trustees. ETFs generally operate under regulations that allow them to operate within the ETF structure, while ETFs also operate under regulations that prohibit affiliated transactions, are subject to standard pricing and valuation rules and have mandated compliance programs. ETPs can take a number of forms in addition to ETFs, including exchange-traded notes, grantor trusts or limited partnerships. In the U.S. market, a key factor differentiating ETFs, grantor trusts and limited partnerships from exchange-traded notes is that the former hold assets underlying the ETP. Exchange traded notes, on the other hand, are debt instruments issued by the exchange-traded note sponsor. Also, each of these structures has implications for taxes, liquidity, tracking error and credit risk.
17
Digital Assets
As we continue to make progress and pursue various initiatives in connection with our digital assets business, we believe it is necessary and important to do so in compliance with applicable laws and regulations. As a result, we are actively engaged with a variety of U.S. federal and state regulators (e.g., the SEC, FINRA, New York Department of Financial Services (NYDFS) and other state regulators) to secure, as necessary, or maintain the appropriate regulatory, registration and/or licensing approvals for various business initiatives and operations, including but not limited to: a New York state-chartered limited purpose trust company; money services and money transmitter business; limited purpose broker-dealer; transfer agent; investment adviser; and investment funds. As we seek to expand globally, similar approvals and/or reliance on exemptions will be required in applicable foreign markets, which also may involve approvals specific to a digital assets or related business. As we secure the appropriate regulatory, registration and/or licensing approvals, or otherwise rely on, seek or confirm exemptions therefrom, in connection with our digital assets business, we are and will be subject to a myriad of complex and evolving global policy frameworks and associated regulatory requirements that we need to comply with, or otherwise be exempt from, to ensure that our digital assets products and services are successfully brought to different markets in a compliant manner. We remain committed to being a trusted provider of innovative products and services guided by proactive engagement and regulatory collaboration.
U.S. Regulation
All aspects of our business are subject to various federal and state laws and regulations. These laws and regulations are primarily intended to protect the end user, which may include retail and institutional customers, investment advisory clients and shareholders of registered investment companies. These laws generally grant supervisory agencies broad administrative powers, including the power to limit or restrict the conduct of our business and to impose fines, sanctions or other penalties for failure to comply with these laws and regulations. Further, such laws and regulations provide the basis for examination, inquiry, investigation, enforcement action and/or litigation which could materially affect our business.
We are primarily subject to the following laws and regulations, among others. The costs of complying with such laws and regulations have increased and will continue to contribute to the costs of doing business:
• The Investment Advisers Act of 1940 (Investment Advisers Act). The SEC is the federal agency generally responsible for administering the U.S. federal securities laws. WisdomTree Asset Management, Inc., or WT Asset Management, and WisdomTree Digital Management, Inc., or WT Digital Management, two of our subsidiaries, are registered as investment advisers under the Investment Advisers Act and, as such, are regulated by the SEC. The Investment Advisers Act requires registered investment advisers to comply with numerous obligations, including, among others, recordkeeping requirements, fiduciary duties, operational procedures, and registration, reporting and disclosure obligations.
• The Investment Company Act of 1940 (Investment Company Act). All of our Digital Funds and U.S. listed ETFs are registered with the SEC pursuant to the Investment Company Act. These products must comply with the applicable requirements of the Investment Company Act and other regulations, such as those related to publicly offering and listing shares, as well as requirements of Rule 6c-11, or the ETF Rule, including, among others, requirements relating to operations, fees charged, sales, accounting, recordkeeping, disclosure, transparency and governance. In addition, the SEC continues to take an active approach in its rulemaking activity by finalizing and proposing new rules and/or rule amendments under the Investment Company Act that will impact current and future Digital Fund and ETF operations and/or investments.
• Broker-Dealer Regulations. WisdomTree Securities, Inc., or WT Securities, is a FINRA member firm. As a limited purpose broker-dealer, WT Securities is operating as a mutual fund retailer for the Digital Funds offered through WisdomTree Prime. This business is separate from other WisdomTree subsidiaries operating as Digital Fund and ETF sponsors in the U.S. which are not required to be registered with the SEC as broker-dealers under the Securities Exchange Act of 1934, as amended, or Exchange Act. However, many of our employees, including all of our salespersons, are licensed with FINRA and are registered either as associated persons of WT Securities or the distributor of the WisdomTree Digital Funds and U.S. listed ETFs and, as such, are subject to FINRA rules that relate to licensing, continuing education requirements and sales practices. FINRA rules also apply to our fund marketing and sales material.
18
• Federal Money Services Business and State Money Transmission Laws. WisdomTree Digital Movement, Inc. is a money services business registered with the Financial Crimes Enforcement Network, or FinCEN, and a state licensed money transmitter operating a platform for the purchase, sale and exchange of digital assets, while also providing blockchain-enabled digital wallet services through WisdomTree Prime to facilitate such activity. Navigating state regulations across the U.S. provides compliance challenges and significant costs as regulations and expectations differ between states, with different states seeking to achieve different objectives with their regulations, from consumer protection to preventing money laundering. In addition, licensure requirements are quickly evolving (including regulators not permitting certain activities related to digital assets pursuant to such licenses), with the associated timeframes for licensure increasing and licensure being further complicated by recent market events and bankruptcies of firms in the digital assets space.
• Internal Revenue Code. The WisdomTree Trust generally has obligations with respect to the qualification of the registered investment companies for pass-through tax treatment under the Internal Revenue Code.
• U.S. Commodity Futures Trading Commission (CFTC) and National Futures Association (NFA). Regulations adopted by the CFTC have required WT Asset Management to become a member of the NFA and register as a commodity pool operator for a select number of our ETFs.
• Products Exchange Listing Requirements. Each WisdomTree U.S. listed ETF is listed on a secondary market (each, an Exchange), including NYSE Arca, the NASDAQ Market and the Cboe Exchange, and accordingly is subject to the listing requirements of these Exchanges. Any new WisdomTree U.S. listed ETF will seek listing on an Exchange and also will need to meet continued Exchange listing requirements, which generally align with requirements of the ETF Rule. However, the SEC or an Exchange may ultimately determine not to allow the issuance of potential new WisdomTree U.S. listed ETFs or may require strategy or operational modifications as part of the registration and/or listing process.
• Corporate Exchange Listing Requirements. In addition, our common stock is listed on the New York Stock Exchange and we are therefore also subject to its rules including corporate governance listing standards, as well as federal and state securities laws.
• FINRA Rules. FINRA rules and guidance may affect how WisdomTree U.S. listed ETFs are sold by member firms. Although we currently do not offer so-called leveraged ETFs in the U.S., which may include within their holdings derivative instruments such as options, futures or swaps to obtain leveraged exposures. FINRA guidance, the recently effective SEC Rule 18f-4, or the Derivatives Rule, and/or other future rules or regulations may influence how member firms effect sales of certain WisdomTree U.S. listed ETFs, such as our currency ETFs, or how such ETFs operate, which also use some forms of derivatives, including forward currency contracts and swaps, our international hedged equity ETFs, which use currency forwards, and our rising rates bond ETFs and alternative strategy ETFs, which use futures or options.
• Section 17A of the Exchange Act. WisdomTree Transfers, Inc., or WT Transfers, is a transfer agent registered with the SEC. As a transfer agent, WT Transfers provides transfer agency and registrar services for the Digital Funds offered through WisdomTree Prime. WT Transfers’ transfer agency and registrar services are subject to Section 17A of the Exchange Act and applicable rules promulgated thereunder.
International Regulation
Our operations outside the U.S. are subject to the laws and regulations of various non-U.S. jurisdictions and non-U.S. regulatory agencies and bodies. As we have expanded our international presence, a number of our subsidiaries and international operations have become subject to regulatory systems, in various jurisdictions, comparable to those covering our operations in the U.S. Regulators in these non-U.S. jurisdictions may have broad authority with respect to the regulation of financial services including, among other things, the authority to grant or cancel required licenses or registrations.
19
Jersey-Domiciled Issuers (Managed by WisdomTree Management Jersey Limited)
One of our subsidiaries, WisdomTree Management Jersey Limited, or ManJer, is a Jersey based management company providing investment and other management services to several Jersey-domiciled issuers, or ManJer Issuers, of exchange-traded commodities, or ETCs, each of which was established as a special purpose vehicle to issue exchange-traded securities. All ETCs are listed and marketed across the European Union, or EU, under Regulation (EU) 2017/1129 of the European Parliament and of the Council of 14 June 2017 (as amended), or the Prospectus Regulation. Since January 4, 2021, the Central Bank of Ireland, or Central Bank, approves all ETC Base Prospectuses (with the exception of WisdomTree Issuer X Limited’s prospectus which is approved by the Swedish Financial Supervisory Authority) as meeting the requirements imposed under EU law pursuant to the Prospectus Regulation. Such approval relates only to those securities to be admitted to trading on a regulated market for the purpose of Markets in Financial Instruments Directive (recast) – Directive 2014/65/EU of the European Parliament and the Council, or MiFID II, and/or which are to be offered to the public in any European Economic Area, or EEA, Member State. All ETC prospectuses (except WisdomTree Issuer X Limited’s prospectus) are also approved by the Financial Conduct Authority, or FCA, as U.K. Listing Authority, as competent authority pursuant to the U.K. version of Regulation (EU) No 2017/1129 of the European Parliament and the Council of 14 June 2017 on the form and content of such prospectuses and repealing Directive 2003/71/EC which is part of U.K. law by virtue of the European Union (Withdrawal) Act 2018, or the U.K. Prospectus Regulation. Each prospectus (except WisdomTree Issuer X Limited’s prospectus) is prepared, and a copy is sent to the Jersey Financial Services Commission, or JFSC, in accordance with the Collective Investment Funds (Certified Funds – Prospectuses) (Jersey) Order 2012. Each ManJer Issuer (other than WisdomTree Issuer X Limited) has obtained a certificate under the Collective Investment Funds (Jersey) Law 1988 (as amended), to enable it to undertake its functions in relation to its ETCs. At the request of the relevant ManJer Issuer, the Central Bank has notified the approval of the Base Prospectus in accordance with the Prospectus Regulation to other EU listing authorities, including Austria, Belgium, Denmark, Finland, France, Germany, Italy, Luxembourg, the Netherlands, Norway, Poland, Spain and Sweden, by providing them with certificates of approval attesting that the Base Prospectus has been prepared in accordance with the Prospectus Regulation. Each issuer may request the Central Bank to provide competent authorities in other EEA Member States with such certificates for the purposes of making a public offer in such Member States and/or for admission to trading of all or any securities on a regulated market. WisdomTree Issuer X Limited’s program for the issuance of WisdomTree digital securities does not constitute a collective investment fund for the purpose of the Collective Investment Funds (Jersey) Law 1988 (as amended) as it satisfies the requirements of Article 2 of the Collective Investments Funds (Restriction of Scope) (Jersey) Order 2000. A copy of WisdomTree Issuer X Limited’s prospectus has been delivered to the Registrar of Companies in Jersey in accordance with Article 5 of the Companies (General Provisions) (Jersey) Order 2002, and the Registrar has consented to its circulation. The JFSC has consented under Article 4 of the Control of Borrowing (Jersey) Order 1958 to the issue of the WisdomTree digital securities by WisdomTree Issuer X Limited. The prospectus of WisdomTree Issuer X Limited is also recognized by the Swiss Prospectus Office.
The ManJer Issuers are primarily subject to the following legislation and regulatory requirements:
• The Companies (Jersey) Law 1991. Each ManJer Issuer is incorporated as a public limited liability company under the Companies (Jersey) Law 1991. Therefore, the ManJer Issuers are required to comply with various obligations under this law including, but not limited to, convening general meetings, keeping proper books and records and filing financial statements.
• The Foreign Account Tax Compliance Act, or FATCA, a U.S. federal law that was passed as part of the Hiring Incentives to Restore Employment (HIRE) Act, generally requires that foreign financial institutions and certain other non-financial foreign entities report on the foreign assets held by their U.S. account holders or be subject to withholding on withholdable payments. The HIRE Act also contained legislation requiring U.S. persons to report, depending on the value, their foreign financial accounts and foreign assets. ETCs benefit from the so called “listing exemption” and Jersey local authorities have determined that for companies which can benefit from such exemption the filing of a nil report is optional.
• The Common Reporting Standards, or CRS, were developed by the Organization for Economic Cooperation and Development and is a global reporting standard for the automatic exchange of information. The ManJer Issuers need to conduct FATCA style due diligence and annual local reporting in relation to financial accounts held directly and indirectly by residents of those jurisdictions with which the Foreign Financial Institutions (FFIs) jurisdiction of residence has signed an Intergovernmental Agreement (IGA) to implement the CRS. Unlike FATCA, there is no clear listing exemption available under the CRS so the ManJer Issuers are required to conduct full due diligence to identify such accounts and report on them on an annual basis to their local tax authorities, at least in respect of the certificated interests and primary market issuances. However, Jersey tax authorities have applied less onerous reporting obligations to interests such as ETCs that are regularly traded on an established securities market and are held through CREST, the U.K. based central securities depository.
20
• The Collective Investment Funds (Jersey) Law 1988. Each ManJer Issuer (other than WisdomTree Issuer X Limited) is a collective investment fund and therefore required to comply with the obligations under the Collective Investment Funds (Jersey) Law 1988 and the Code of Practice for Certified Funds.
• The Prospectus Regulation. The Base Prospectus of each ManJer Issuer has been drafted, and any offer of ETCs in any EEA Member State that has implemented the Prospectus Regulation is made in compliance with the Prospectus Regulation and any relevant implementing measure in such Member States.
• Regulation (EU) No 648/2012 of the European Parliament and of the Council of 4 July 2012 on OTC derivatives, central counterparties and trade repositories, known as the European Market Infrastructure Regulation (“EMIR”). EMIR, which became effective on August 16, 2012, provides for certain over-the-counter, or OTC, derivative contracts to be submitted to central clearing and imposes margin posting and other risk mitigation techniques, reporting and record keeping requirements. The clearing obligations under EMIR are still under discussion, and currently there are no mandatory clearing obligations in relation to equity, FX or commodity derivatives. The clearing obligation only applies to EU-based financial counterparties (defined as those authorized under MiFID, CRR, AIFMD, UCITS or insurance regulations) or those non-financial entities that have a rolling three-month notional exposure above a certain amount (between €1 and €3 billion, depending on asset class), which means that the ManJer Issuers are not directly subject to these obligations, but could indirectly be subject to them by virtue of their interaction with EU-based financial counterparties. In terms of reporting obligations, being non-EU entities, the ManJer Issuers are only indirectly subject to such obligations when they interact with their EU-based financial counterparties. Each ManJer Issuer has adhered to the 2013 EMIR Portfolio Reconciliation, Dispute Resolution and Disclosure Protocol published by the International Swaps and Derivatives Association, Inc.
• Regulation (EU) No 596/2014 of the European Parliament and of the Council on market abuse (the “Regulation”) and Directive 2014/57/EU of the European Parliament and of the Council on criminal sanctions for market abuse (the “Directive” and, together with the Regulation, “MAD”). Obligations imposed on the relevant ManJer Issuer and distributor under MAD, which became effective on July 3, 2016, include the requirement to publish inside information in a public and timely manner, to prepare and maintain a list of insiders and to refrain from market manipulation.
• Regulation (EU) 2016/1011 of the European Parliament and of the Council of 8 June 2016 on indices used as benchmarks in financial instruments and financial contracts or to measure the performance of investment funds and amending Directives 2008/48/EC and 2014/17/EU and Regulation (EU) No 596/2014 (“BMR”). Supervised EU entities which issue financial instruments that reference a benchmark are required to comply with applicable obligations as set out under the BMR. The BMR was published on June 30, 2016 and the majority of the provisions became effective on January 1, 2018. The ManJer Issuers are non-EU entities and as a result, BMR application is very limited, although in some circumstances a few residual obligations could be deemed to be applicable because the ETCs are marketed across Europe.
• Regulation (EU) No 1286/2014 of the European Parliament and of the Council of 26 November 2014 on key information documents for packaged retail and insurance-based investment products (“PRIIPS”). PRIIPs became effective on January 1, 2018 and applies to investment product manufacturers and distributors. Under PRIIPs, manufacturers need to provide a key information document (KIDs) to investors. The intention of KIDs is to improve transparency for investors on the products and enhance investor protection. The product manufacturer is responsible for drafting the KID and for its content. All ETCs are currently subject to PRIIPs and KIDs have been produced since January 1, 2018.
• MiFID II. MiFID II covers a wide range of areas that affect the relevant issuer and distributor, such as product governance, a definition of complex products which captures all physical and synthetic ETCs and the production of a European MiFID template, or an EMT, to facilitate the dissemination of relevant information to the markets and distributors in relation to each financial product.
• Regulation (EU) 2015/2365 of the European Parliament and of the Council of 25 November 2015 on transparency of securities financing transactions and of reuse and amending Regulation (EU) No 648/2012. (“SFTR”). Counterparties to securities financing transactions must report the transaction to trade repositories. The SFTR introduces a reporting requirement for transactions, and a disclosure requirement to investors with a requirement for prior consent. It also designates that financial instruments used for re-hypothecation are transferred to an account in the name of the other counterparty. Since the ManJer Issuers are based in non-EU jurisdictions, obligations are only indirectly applicable to them, but a certain level of interaction with EU counterparties is required to comply with some of these requirements.
21
WisdomTree Issuer X Limited is also primarily subject to the following legislation and regulatory requirements:
• The Control of Borrowing (Jersey) Order 1958. WisdomTree Issuer X Limited is required to comply with the obligations under the Control of Borrowing (Jersey) Order 1958 in respect of its issue of the WisdomTree digital securities.
• The Companies (General Provisions) (Jersey) Order 2002. WisdomTree Issuer X Limited is required to comply with the obligations under the Companies (General Provisions) (Jersey) Order 2002 in respect of its circulation of the WisdomTree digital securities prospectus.
Irish-Domiciled Issuer of UCITS ETFs (Managed by WisdomTree Management Limited)
The investment management industry in Ireland is subject to both Irish domestic law and EU law. The Central Bank of Ireland, or the Central Bank, is responsible for the authorization and supervision of collective investment schemes, or CIS, in Ireland. CIS’s are also commonly known as funds/schemes. There are two main categories of funds authorized by the Central Bank, Undertakings for Collective Investment in Transferable Securities (UCITS) and funds that are not UCITS known as alternative investment funds. ETFs form part of the Irish and European regulatory frameworks that govern UCITS, with ETFs having been the subject of specific consideration at the European level which is then repeated and/or interpreted by Irish regulators and the Central Bank in regulations and related guidance issued by the Central Bank.
One of our subsidiaries, WisdomTree Management Limited, is an Ireland based management company authorized in Ireland providing collective portfolio management services to WisdomTree Issuer ICAV, or WTICAV, and WisdomTree UCITS ETFs. The WisdomTree UCITS ETFs, or Sub-Funds, are issued by WTICAV. WTICAV, a non-consolidated third party, is an Irish-collective-asset-management vehicle, or ICAV, organized in Ireland and is authorized as a UCITS by the Central Bank. All UCITS have their basis in EU legislation and once authorized in one EEA Member State, may be marketed throughout the EU, without further authorization. This is described as an EU passport. WisdomTree Management Limited registered with the FCA as an Authorised Schedule 5 – operator of a temporary recognized scheme, and under the Temporary Marketing Permissions Regime, the WisdomTree UCITS ETFs continue to be available to U.K. investors.
WTICAV is established and operated as an ICAV with segregated liability between its Sub-Funds. The Sub-Funds are segregated portfolios, each with their own investment objective and policies and assets. Each Sub-Fund has a separate approval from the Central Bank, and each is structured as an ETF. Each Sub-Fund tracks a different index. The index must comply with regulatory criteria that govern, among others, the eligibility and diversification of its constituents, and the availability of information on the index such as the frequency of calculation of the index, the index’s transparency, its methodology and frequency of calculation. Each Sub-Fund has shares admitted to trading on the London Stock Exchange and, typically, on various European stock exchanges, and accordingly, is subject to the listing requirements of those exchanges.
WTICAV is primarily subject to the following legislation and regulatory requirements:
• European Communities (Undertakings for Collective Investment in Transferable Securities) Regulations 2011 (as amended) (“UCITS Regulations”). The UCITS Regulations, which transpose Council Directive 2009/65/EC, Commission Directive 2010/43/EC and Commission Directive 2010/44/EC into Irish law, became effective on July 1, 2011. UCITS established in Ireland are authorized under the UCITS Regulations.
• Central Bank (Supervision and Enforcement) Act 2013 (Section 48(1)) (Undertakings for Collective Investment in Transferable Securities) Regulations 2019 (“Central Bank UCITS Regulations”). The Central Bank UCITS Regulations were adopted in May 2019 and, together with the UCITS Regulations, any guidance produced by the Central Bank, and the Central Bank forms, form the basis for all the requirements that the Central Bank imposes on UCITS, UCITS management companies and depositaries of UCITS.
• Central Bank Guidance. The Central Bank also has produced guidance that provides direction on issues relating to the funds industry, certain of which set forth conditions not contained in the UCITS Regulations or the Central Bank Regulations with which UCITS must conform.
• The Irish Collective Asset-Management Vehicle Act 2015 (“ICAV Act”). WTICAV is registered as an ICAV under the ICAV Act. Therefore, WTICAV is required to comply with various obligations under the ICAV Act such as, but not limited to, keeping proper books and records. The segregation of liability between Sub-funds means there cannot be, as a matter of Irish law, cross-contamination of liability between Sub-funds. Therefore, the insolvency of one Sub-fund cannot affect another Sub-fund.
22
• EMIR. EMIR provides for OTC derivative contracts to be submitted to central clearing and imposes, inter alia, margin posting and other risk mitigation techniques, reporting and record keeping requirements. WTICAV uses OTC derivatives instruments to hedge the currency risk of some of its sub-funds, which are subject to EMIR. WTICAV has adhered to the 2013 EMIR Portfolio Reconciliation, Dispute Resolution and Disclosure Protocol published by the International Swaps and Derivatives Association, Inc. The Central Bank has been designated as the competent authority for EMIR.
• BMR. The BMR is directly applicable law across the EU and applies to certain “administrators,” “contributors” and “users” of benchmarks with the aim of reducing the risk of benchmark manipulation and promoting confidence in their integrity and that of the financial markets which they support. Since WTICAV issues financial instruments that reference a benchmark, it will be required to comply with applicable obligations as set out under the BMR. In addition, non-EU administrators of benchmarks are required to satisfy a number of requirements to enable the benchmarks they provide to be used in the EU. To ensure investor protection, the BMR provides equivalence, recognition and endorsement conditions under which third country benchmarks may be used by supervised entities in the EU. Since we control the provision of benchmarks, we are required to comply with applicable obligations within the timeframes set out under the BMR.
• Regulation (EU) No 1286/2014 of the European Parliament and of the Council of 26 November 2014 on key information documents for packaged retail and insurance-based investment products (“PRIIPS”). As above, WisdomTree’s ETCs have been subject to PRIIPS since January 1, 2018. On January 1, 2023, PRIIPS also began to apply to UCITS. WTICAV has been producing and publishing these KIDs for share classes of the Sub-funds of the ICAV since January 1, 2023.
• Regulation on Disclosures (EU/2019/2088) (“SFDR”) and the EU Taxonomy Regulation (2020/852) (“EU Taxonomy”). SFDR requires WisdomTree Management Limited, as a UCITS management company, to disclose in a consistent and harmonized manner how environmental, social and governance, or ESG, factors are adopted in its decision-making process. SFDR also requires certain pre-contractual and periodic disclosure requirements for in scope WTICAV’s Sub-funds, such as UCITS financial products. Level 1 of SFDR requirements applied from March 1, 2021 and Level 2 of the SFDR requirements applied from January 1, 2023. The EU Taxonomy Regulation amends the disclosure requirements in place under SFDR. The EU Taxonomy disclosures for the economically sustainable objectives of climate change mitigation and climate change adaptation were applicable from January 1, 2022, while the requirement for disclosures for the remaining objectives applied from January 1, 2023. The WTICAV Prospectus, as well as supplements and product pages of the WTICAV Sub-funds in scope of SFDR and EU Taxonomy, have been updated to reflect the respective regulatory requirements.
• Regulation (EU) 2019/1156 on the cross-border distribution framework (“CBDF”). The CBDF amend the UCITS Directive to increase the harmonization of cross-border marketing between both (a) the UCITS regime and (b) different practices adopted by EU member states and came into effect on August 2, 2021. The CBDF eliminated the need for WTICAV to have local paying agents within EU member states the Sub-funds passported into, but introduced rules around marketing communications, pre-marketing notifications and the discontinuation of marketing.
• Regulatory technical standards on settlement discipline (“CSDR”). CSDR introduced measures to prevent settlement failures, with settlement failures resulting in penalty charges applied by the Central Securities Depositaries to failing parties. Since most WTICAV sub-funds employ physical replication using equities and bonds, trades in these equities that take place within the EU come into scope of CSDR. This regulation came into force on February 1, 2022.
Irish-Domiciled Issuer (Managed by WisdomTree Multi Asset Management Limited)
One of our subsidiaries, WisdomTree Multi Asset Management Limited, is a Jersey based management company providing investment and other management services to WisdomTree Multi Asset Issuer PLC, or WMAI, in respect of the ETPs issued by WMAI. WisdomTree Multi Asset Management Limited operates under the Schedule 2 businesses (Schedule 2 of the Proceeds of Crime (Jersey) Law 1999) must adhere to Jersey AML/CFT/CPF regulations, and is supervised for compliance by the JFSC. WMAI, a non-consolidated third party, is a public limited company incorporated in the laws of Ireland. It was established as a special purpose vehicle for the purposes of issuing collateralized exchange-traded securities, or ETP Securities, under the Collateralized ETP Securities Programme described in its Base Prospectus. WMAI is a ‘qualifying company’ within the meaning of section 110 of the Taxes Consolidation Act 1997 (as amended), of Ireland. WMAI is not authorized or regulated by the Central Bank by virtue of issuing ETPs.
23
The Central Bank, as competent authority under the Prospectus Regulation, has approved the Base Prospectus as meeting the requirements imposed under Irish and EU law pursuant to the Prospectus Regulation. Such approval relates only to ETP Securities which are to be admitted to trading on a regulated market for the purpose of MiFID II and/or which are to be offered to the public in any EEA Member State. The Base Prospectus also has been approved by the FCA as competent authority pursuant to the U.K. version of Regulation (EU) No 2017/1129 of the European Parliament and the Council of 14 June 2017 on the form and content of such prospectuses and repealing Directive 2003/71/EC which is part of U.K. law by virtue of the U.K. Prospectus Regulation.
At the request of WMAI, the Central Bank has notified the approval of the Base Prospectus in accordance with the Prospectus Regulation to the Commissione Nazionale per le Societá e la Borsa (the Italian financial supervisory authority), the Bundesanstalt für Finanzdienstleistungsaufsicht (the German Federal Financial Supervisory Authority), the Financial Market Authority of Austria, the Commission de Surveillance du Secteur Financier (the financial regulator in Luxembourg), the Finanstilsynet (the Norwegian financial supervisory authority), the Autorité des Services et Marchés Financiers (the Belgian Financial Services and Markets Authority), the Finanstilsynet (the Danish Financial Supervisory Authority), the Finanssivalvonta (the Finnish Financial Supervisory Authority), the Autorité des Marchés Financiers (the French Authority for the Financial Markets), the Autoriteit Financiële Markten (the Netherlands Authority for the Financial Markets), the Komisja Nadzoru Finansowego (the Polish Financial Supervisory Authority), the Comisión Nacional del Mercado de Valores (the Securities Market Commission in Spain) and Finansinspektionen (the Swedish Financial Supervisory Authority) by providing them, inter alia, with certificates of approval attesting that the Base Prospectus has been prepared in accordance with the Prospectus Regulation. WMAI may request the Central Bank to provide competent authorities in other EEA Member States with such certificates whether for the purposes of making a public offer in such Member States or for admission to trading of all or any ETP Securities on a regulated market therein or both.
WMAI is primarily subject to the following legislation and regulatory requirements:
• The Companies Act. WMAI is incorporated as a public limited liability company under the Companies Act. Therefore, WMAI is required to comply with various obligations under the Companies Act such as, but not limited to, convening general meetings, keeping proper books and records and filing financial statements.
• The Prospectus Regulation. The Base Prospectus has been drafted, and any offer of ETP Securities in any EEA Member State that has implemented the Prospectus Regulation is made in compliance with the Prospectus Regulation and any relevant implementing measure in such Member States.
• EMIR. WMAI hedges its payment obligations in respect of the ETP Securities by entering into swap transactions with swap providers, which are subject to EMIR. The Central Bank has been designated as the competent authority for EMIR and, to assess compliance with EMIR, requests that WMAI submits annually an EMIR Regulatory Return.
• BMR. Since WMAI issues financial instruments that reference a benchmark, it also will be required to comply with applicable obligations within the timeframes set out under the BMR.
• MAD. MAD has a direct effect in Ireland and strengthens the legal framework underpinning the function of detecting, sanctioning and deterring market abuse. Broadly, MAD applies to any financial instrument admitted to, or for which a request for admission has been made to, trading on a regulated market in at least one member state of the EU or in an EEA Member State. Obligations imposed on WMAI under MAD include the requirement to publish inside information in a public and timely manner, to draw up and maintain a list of insiders and to refrain from market manipulation.
• CSDR. As above, CSDR introduced measures to prevent settlement failures, with settlement failures resulting in penalty charges applied by the Central Securities Depositaries to failing parties.
Intellectual Property
We regard our name, WisdomTree, as material to our business and have registered the WisdomTree name and logo design as a service mark with the U.S. Patent and Trademark Office and in various foreign jurisdictions. We also have registered Modern Alpha as a service mark with the U.S. Patent and Trademark Office and in various foreign jurisdictions and have applied for trademark registration of the WisdomTree Prime name and logo design.
Many of our index-based equity ETFs are based on our own indexes and we do not license them from, nor do we pay licensing fees to, third parties for these indexes. We do, however, license third-party indexes for certain of our fixed income, currency and alternative ETFs.
24
On March 6, 2012, the U.S. Patent and Trademark Office issued to us our patent on Financial Instrument Selection and Weighting System and Method, which is embodied in our dividend weighted equity indexes. We currently do not rely upon our patent for a competitive advantage.
Available Information
Company Website and Public Filings
Our website is located at www.wisdomtree.com, and our investor relations website is located at https://ir.wisdomtree.com. We make available, free of charge through our investor relations website, our Annual Reports on Form 10-K, Quarterly Reports on Form 10-Q and Current Reports on Form 8-K, and amendments to those reports, filed or furnished pursuant to Sections 13(a) or Section 15(d) of the Exchange Act as soon as reasonably practicable after they have been electronically filed with, or furnished to, the SEC. The SEC maintains a website that contains reports, proxy and information statements, and other information regarding the Company at www.sec.gov.
We webcast our earnings calls and certain events we participate in or host with members of the investment community on our investor relations website. Additionally, we provide notifications of news or announcements regarding our financial performance, SEC filings, investor events and press and earnings releases on our investor relations website. Further corporate governance information, including board committee charters and our code of business conduct and ethics, is also available on our investor relations website under the heading “Governance.” The contents of our websites are not incorporated by reference into this Annual Report on Form 10-K or in any other report or document we file with the SEC, and any references to our websites are intended to be inactive textual references only.
ITEM 1A. RISK FACTORS
Any investment in our common stock involves a high degree of risk. You should carefully consider the specific risk factors described below in addition to the other information contained in this Report before making a decision to invest in our common stock. If any of these risks actually occur, our business, operating results, financial condition and prospects could be harmed. This could cause the trading price of our common stock to decline and a loss of all or part of your investment. Certain statements below are forward-looking statements. See the section entitled “Cautionary Note Regarding Forward-Looking Statements.”
Market Risks
Declining prices of securities, gold and other precious metals and other commodities and changes in interest rates and general market conditions can adversely affect our business by reducing the market value of the assets we manage or causing WisdomTree ETP investors to sell their fund shares and trigger redemptions.
We are subject to risks arising from declining prices of securities, gold and other precious metals and other commodities, which may result in a decrease in demand for investment products, a higher redemption rate and/or a decline in AUM. The financial markets are highly volatile and prices for financial assets may increase or decrease for many reasons, including general economic conditions, trade uncertainties, rising or falling interest rates, the strengthening or weakening of the U.S. dollar, events such as a pandemic or war, geopolitical conflicts, political events, acts of terrorism and other matters beyond our control. Substantially all our revenues are derived from advisory fees earned on our AUM, in both the international and U.S. markets. As a result, our business can be expected to generate lower revenues in declining market environments or general economic downturns. Such adverse conditions would likely cause the value of our AUM to decrease, which would result in lower advisory fees, or cause investors in the WisdomTree ETPs to sell their shares in favor of investments they perceive to offer greater opportunity or lower risk, thus triggering redemptions that would also result in decreased AUM and lower fees.
Fluctuations in the amount and mix of our AUM may negatively impact revenues and operating margins.
The level of our revenues depends on the amount and mix of our AUM. Our revenues are derived primarily from advisory fees based on a percentage of the value of our AUM and vary with the nature of the ETPs, which have different fee levels. Fluctuations in the amount and mix of our AUM may be attributable in part to market conditions outside of our control that have had, and in the future could have, a negative impact on our revenues and operating margins.
Abnormally wide bid/ask spreads and market disruptions that halt or disrupt trading or create extreme volatility could undermine investor confidence in the ETP investment structure and limit investor acceptance of ETPs.
ETPs trade on exchanges in market transactions that generally approximate the value of the referenced assets or underlying portfolio of securities held by the particular ETP. Trading involves risks including the potential lack of an active market for fund shares, abnormally wide bid/ask spreads (the difference between the prices at which shares of an ETP can be bought and sold) that can exist for a variety of reasons and losses from trading. These risks can be exacerbated during periods when there is low demand for an ETP, when the markets in the underlying investments are closed, when market conditions are extremely volatile or when trading is disrupted. This could result in limited growth or a reduction in the overall ETP market and result in our revenues not growing as rapidly as it has in the recent past or even in a reduction of revenues.
25
Concentration Risks
We derive a substantial portion of our revenues from a limited number of products and, as a result, our operating results are particularly exposed to investor sentiment toward investing in the products’ strategies and our ability to maintain the AUM of these products, as well as the performance of these products.
At December 31, 2023, 54% of our AUM was concentrated in ten of our WisdomTree ETPs with approximately 18% in three of our domestic equity ETFs, 17% in the WisdomTree Floating Rate Treasury Fund, or USFR, 10% in three of our precious metal products, 6% in two of our emerging markets ETFs, and 3% in one of our international developed market equity ETPs. As a result, our operating results are particularly exposed to the performance of these funds and our ability to maintain the AUM of these funds, as well as investor sentiment toward investing in the funds’ strategies. If the AUM in these funds were to decline, either because of declining market values or net outflows from these funds, our revenues would be adversely affected.
Declining commodity prices, and gold prices in particular, including as a result of changes in demand for commodities and gold as an investment, could materially and adversely affect our business.
At December 31, 2023, approximately 12% of our AUM were in ETPs backed by gold and approximately 10% were in ETPs backed by other commodities. Precious metals such as gold are often viewed as “safe haven” assets as they tend to attract demand during periods of economic and geopolitical uncertainty. Accommodative monetary policies are also favorable as the opportunity cost of forgoing investment in interest-bearing assets is low. Market conditions that are not conducive to investment in precious metals, such as a rising interest rate environment, may lead to declining prices that are linked to our ETPs and thereby adversely affect our AUM and revenues. We cannot provide any assurance that our products backed by precious metals will benefit from favorable market conditions. In addition, changes in long-term demand cycles for commodities generally and cyclicality in demand for commodities as an investment asset, could reduce demand for certain of our products, limit our ability to successfully launch new products and also may lead to redemptions by existing investors.
Also, a portion of the advisory fee revenues we receive on our ETPs backed by gold are paid in gold ounces. While we may readily sell the gold that we earn under these advisory contracts, we still may maintain a position. We currently do not enter into arrangements to hedge against fluctuations in the price of gold and any hedging we may undertake in the future may not be cost-effective or sufficient to hedge against this gold exposure.
A significant portion of our AUM is held in products with exposure to U.S. and international developed markets, and we therefore have exposure to domestic and foreign market conditions and are subject to currency exchange rate risks.
At December 31, 2023, approximately 29% and 15% of our AUM was held in products with exposure to the U.S. and international developed markets, respectively. Therefore, the success of our business is closely tied to various conditions in these markets which may be affected by domestic and foreign political, social and economic uncertainties, monetary policies conducted in these regions and other factors.
In addition, fluctuations in foreign currency exchange rates could reduce the revenues we earn from certain foreign invested products. This occurs because an increase in the value of the U.S. dollar relative to non-U.S. currencies may result in a decrease in the dollar value of the AUM in these products, which, in turn, would result in lower revenues. Furthermore, investors may perceive certain foreign invested products, as well as certain of our currency and fixed income products to be a less attractive investment opportunity when the value of the U.S. dollar rises relative to non-U.S. currencies, which could have the effect of reducing investments in these products, thus reducing revenues. Our products exposed to the U.S. market may benefit from a rising U.S. dollar, but we can provide no assurance that this will be the case. Also, a weakening U.S. dollar relative to the euro or yen may make less attractive our international hedged equity products, as unhedged alternatives would benefit from the appreciation of the foreign currency or currencies while our products would not, which could result in redemptions in our funds.
Withdrawals or broad changes in investments in our ETPs by investors with significant positions may negatively impact revenues and operating margins.
We have had in the past, and may have in the future, investors who maintain significant positions in one or more of our ETPs. If such an investor were to broadly change or withdraw its investments in our ETPs because of a change to its investment strategy, market conditions or any other reason, it may significantly change the amount and mix of our AUM, which may negatively affect our revenues and operating margins.
26
Third-Party Provider Risks
We primarily depend on Mellon Investments Corporation, Newton Investment Management North America, LLC and Voya Investment Management Co., LLC to provide portfolio management services, State Street Bank and Trust Company to provide us with critical administrative services to operate our business and our U.S. listed ETFs, and other third parties to provide many other critical services to operate our business and our U.S. listed ETFs. The failure of key vendors to adequately provide such services could materially affect our operating business and harm investors in our products.
We depend on third-party vendors to provide us with many services that are critical to operating our business, including Mellon Investments Corporation, Newton Investment Management North America, LLC and Voya Investment Management Co., LLC as sub-advisers providing portfolio management services, and State Street Bank and Trust Company, or State Street, to provide custody services, fund accounting, administration, transfer agency and securities lending services. We also rely on third-party providers to license indexes to certain of our U.S. listed ETFs, perform index calculation services for our indexes and a third-party distributor for our products. The failure of any of these key vendors to provide us and our products with these services could lead to operational issues and result in financial loss to us and investors in our products.
We depend on HSBC and JP Morgan to provide us with critical physical custody services for precious metals that back our ETCs. The failure of HSBC and JP Morgan to adequately safeguard the physical assets could materially adversely affect our business and harm investors in our products.
We depend on HSBC and JP Morgan to provide us with critical physical custody services for precious metals that back our ETCs. Such products that are backed by physical metal are subject to risks associated with the custody of physical assets, including the risk that access to the metal held in the secure facilities managed by HSBC and JP Morgan could be restricted by a pandemic (such as the COVID-19 pandemic), natural events (such as an earthquake) or human actions (such as a terrorist attack). In addition, there is a risk that the physical metal could be lost, stolen, damaged or restricted. The failure of HSBC and JP Morgan to successfully provide us with these services could result in financial loss to us and investors in our products and our recovery of any losses from a custodian, sub-custodian or insurer may be inadequate.
We depend on Swissquote Bank Ltd and Coinbase Custody Trust LLC to provide us with critical custody services for digital currencies that back WisdomTree digital assets. The failure of Swissquote and/or Coinbase to adequately safeguard these digital assets could materially adversely affect our business and harm investors in this product.
We depend on Swissquote Bank Ltd and Coinbase Custody Trust LLC to provide us with critical custody services for digital currencies that back WisdomTree digital assets. Products that are backed by digital currencies are subject to the risks associated with the custody of digital assets, including the risk that the digital currencies or the blockchain infrastructure could be impacted by hacks or other malicious actions. WisdomTree Issuer X Limited is reliant on the security procedures and infrastructure of the custodian to safeguard the underlying digital currency cryptographic keys. There is no guarantee that the arrangements of the custodian will fully protect from loss of assets. Damage to the infrastructure or loss of these assets may render the digital currency inaccessible and adversely impact the value of an investment in digital assets. The digital currencies may also be exposed to the Internet briefly before reaching the secure accounts of the custodian. There are additional risks involved with an investment backed by digital currencies such as changes to the protocol (such as forks) which could damage the reputation of digital assets or result in losses for investors. The risks associated with digital currencies and the failure of the custodian to safeguard the underlying assets could result in financial loss to us and investors in our products and our recovery of any losses from a custodian may be inadequate. The custodians perform additional services to crypto ETPs that may derive additional revenue by delegating a part of our assets to validate transactions on the relevant blockchain (“staking”). There are certain operational and technological risks associated with staking such as penalties due to bad validator behavior. Operational and technical errors in the context of staking could damage the reputation of digital assets or result in losses for investors.
We depend on R&H Fund Services (Jersey) Limited in respect of the products issued by our Jersey-domiciled issuers, or ManJer Issuers, of ETCs (except WisdomTree Issuer X Limited), JTC Trust Company Jersey in respect of products issued by WisdomTree Issuer X Limited, APEX IFS Limited in respect of the products issued by WMAI and State Street Fund Services (Ireland) Limited in respect of the WisdomTree UCITS ETFs to provide us with critical administrative services to those products. The failure of any of those providers to adequately provide such services could materially affect our operating business and harm investors in those products.
We depend on R&H Fund Services (Jersey) Limited in respect of the products issued by the ManJer Issuers (except WisdomTree Issuer X Limited), JTC Trust Company Jersey in respect of products issued by WisdomTree Issuer X Limited, APEX IFS Limited in respect of the products issued by WMAI and State Street Fund Services (Ireland) Limited in respect of the WisdomTree UCITS ETFs, to provide fund accounting, administration and, transfer agency services, as well as custody services in the case of the WisdomTree UCITS ETFs. The failure of any service provider to successfully provide these services could result in financial loss to the products, us and investors in those products. In addition, because each of the service providers provides a multitude of important services, changing these vendor relationships would be challenging. It might require us to devote a significant portion of management’s time to negotiate a similar relationship with other vendors or have these services provided by multiple vendors, which would require us to coordinate the transfer of these functions to another vendor or vendors.
27
The WisdomTree UCITS ETFs primarily depend on either of Assenagon Asset Management S.A. or Irish Life Investment Managers Limited to provide portfolio management services and other third parties to provide many critical services to operate the WisdomTree UCITS ETFs. The failure of key vendors to adequately provide such services could materially affect our operating business and harm investors in the WisdomTree UCITS ETFs.
The WisdomTree UCITS ETFs depend on third-party vendors to provide many services that are critical to operating our business, including Assenagon Asset Management S.A. and Irish Life Investment Managers Limited as investment managers that provide us with portfolio management services and third-party providers of index calculation services. The failure of any of these key vendors to provide the WisdomTree UCITS ETFs with these services could lead to operational issues and result in financial loss to us and investors in the WisdomTree UCITS ETFs.
Failure of third-party vendors to maintain sufficient internal controls could adversely affect us.
If a third-party vendor fails to develop and maintain sufficient internal control processes or adequate data privacy controls and security systems, such failure could adversely affect us. For example, we have been notified of a deficiency in the internal controls of a third-party vendor of software we utilize in our accounting processes. We have identified sufficient mitigating controls to alleviate the deficiency and do not believe the third-party’s deficiency has a material impact on our operations or financial reporting. Any internal control failures that may arise in the future could adversely affect us if not sufficiently mitigated.
The products issued by our European business are subject to counterparty risks.
The products issued by our European business depend on the services of counterparties, custodians and other agents and are therefore subject to a variety of counterparty risks, which are detailed above. Products issued by WMAI, certain WisdomTree UCITS ETFs and certain products issued by the ManJer Issuers are backed by swap, derivative or similar arrangements, which are subject to risks associated with the creditworthiness of their counterparties, including the risk that a counterparty will not settle a transaction in accordance with its terms and conditions because of a dispute over the terms of the relevant arrangement (whether or not bona fide) or because of a credit, liquidity, regulatory, tax or operational problem. Any deterioration of the credit or downgrade in the credit rating of a counterparty, or the custodian holding the collateral, could cause the associated products to trade at a discount to the value of the underlying assets.
The terms of contracts with counterparties are generally complex, often customized and often not subject to regulatory oversight. A voluntary or involuntary default by a counterparty may occur at any time without notice. In the event of any default by, or the insolvency of, any counterparty, the relevant products may be exposed to the under-segregation of assets, fraud or other factors that may result in the recovery of less than all of the property of our issuers that was held in custody or safekeeping in the case of physically backed products or the recovery of property that is insufficient in value to cover all amounts payable to holders of the applicable products upon their redemption.
The impact of market stress or counterparty financial condition may not be accurately foreseen or evaluated and, as a result, we may not take sufficient action to reduce counterparty risks effectively. Any losses due to a counterparty’s failure to perform its contractual obligations will be borne by the relevant product issuer and there could be a substantial delay in recovering assets due from counterparties or it may not be possible to do so at all. Defaults by, or even rumors or questions about, the solvency of counterparties may increase operational risks or transaction costs, which may negatively affect the investment performance of the relevant products and have a material adverse effect on our business and operations.
Our risk management policies and procedures, and those of our third-party vendors upon which we rely, may not be fully effective in identifying or mitigating risk exposure, including employee misconduct. If our policies and procedures do not adequately protect us from exposure to these risks, we may incur losses that would adversely affect our financial condition, reputation and market share.
We have developed risk management policies and procedures and we continue to refine them as we conduct our business. Many of our procedures involve oversight of third-party vendors that provide us with critical services such as portfolio management, custody, fund accounting and administration, and index calculation as further described in “Third-Party Provider Risks” above. However, our policies and procedures to identify, monitor and manage risks may not be fully effective in mitigating our risk exposure. Deficiencies in the risk management policies and procedures, internal systems and controls of our third-party vendors may adversely affect our systems and controls. Moreover, we are subject to the risks of errors and misconduct by our employees, including fraud and non-compliance with policies. These risks are difficult to detect in advance and deter, and could harm our business, results of operations or financial condition. Although we maintain insurance and use other traditional risk-shifting tools, such as third-party indemnification, to manage certain exposures, they are subject to terms such as deductibles, coinsurance, limits and policy exclusions, as well as risk of counterparty denial of coverage, default or insolvency. If our policies and procedures do not adequately protect us from exposure and our exposure is not adequately covered by insurance or other risk-shifting tools, we may incur losses that would adversely affect our financial condition and could cause a reduction in our revenues as investors in our products shift their investments to the products of our competitors.
28
Competition and Distribution Risks
The asset management business is intensely competitive, and we may experience pressures on our pricing and market share, which could reduce revenues and profit margins.
Our business operates in a highly competitive industry. We compete directly with other ETP sponsors and mutual fund companies and indirectly against other investment management firms, insurance companies, banks, brokerage firms and other financial institutions that offer products that have similar features and investment objectives to those offered by us. This includes fundamentally weighted or factor-based indexes or currency hedged products with fees that are generally equivalent to, and in some instances lower than, our products. We compete based on a number of factors, including name recognition, service, investment performance, product features, breadth of product choices and fees.
In addition, the adoption of Rule 6c-11, or the ETF Rule, removed the need to file for exemptive relief in order to issue ETFs, thereby creating fewer barriers to entry for competitors. We continue to expect that additional companies, both new and traditional asset managers, will enter and expand in the ETP space.
Also, non-transparent active ETFs have been launched. These products are not required to disclose their holdings daily, as most ETFs currently are required to do. Such products may allow traditional actively managed mutual fund sponsors to compete more effectively against ETFs.
Several ETP sponsors with whom we directly compete continue to migrate toward offering low and no fee products targeting gains in market share. Price competition exists in not only commoditized product categories such as traditional, market capitalization weighted index exposures and commodities, but also in non-market capitalization weighted or factor-based exposures and commodities. Fee reductions by certain of our competitors has been a trend over the last few years and continues to persist and many of our competitors are well positioned to benefit from this trend. Certain larger competitors are able to offer products at lower price points or otherwise as loss leaders due to other revenue sources available within such competitor that are unavailable to us. Newer players have also been entering the ETP industry and frequently seek to differentiate by offering ETPs at a lower price point. Funds are being offered with fees of 20 basis points or less, which have attracted approximately 80% of the net flows globally during the last three years. Fee reduction by certain of our competitors has been a trend over the last few years and continues to persist and many of our competitors are well positioned to benefit from this trend.
Our competition may have greater market share, offer a broader range of products and platforms and have greater financial resources than we do. Some financial institutions operate in a more favorable regulatory environment and/or have proprietary products, sources of revenue and distribution channels, which may provide them and their investment products with certain competitive advantages, including in pricing ETPs as loss leaders. Further consolidation within the industry may also put us at a competitive disadvantage.
We believe that due to the continuing evolution of the competitive landscape described above, we have experienced, and may in the future experience, pressures on our pricing and market share, which could reduce our revenues and profit margins.
We rely on third-party distribution channels to sell our products, and increased competition, a failure to maintain business relationships and other factors could adversely impact our business.
We rely on various third-party distribution channels, including registered investment advisers, wirehouse and institutional channels to sell our products. Increasing competition, a failure to maintain business relationships and other factors could impair our distribution capabilities and increase the cost of conducting business. In addition, several of the largest custodial platforms and online brokerage firms eliminated trading commissions for ETFs. Any inability to access and successfully sell our products through our distribution channels could have a negative effect on our AUM levels and adversely impact our business.
29
Performance and Investment Risks
Many of our ETPs have a limited track record and poor investment performance could cause our revenues to decline.
Many of our ETPs have a limited track record upon which an evaluation of their investment performance can be made. Certain investors limit their investments to ETPs with track records of ten years or more. Furthermore, as part of our strategy, we continuously evaluate our product offerings to ensure that all our funds are useful, compelling and differentiated investment offerings, to align our overall product line more competitively in the current ETP landscape and to reallocate our resources to areas of greater client interest. As a result, we may further adjust our product offerings, which may result in the closing of some of our ETPs, changing their investment objective or offering of new funds. The investment performance of our products is important to our success. While strong investment performance could stimulate sales of our ETPs, poor investment performance, on an absolute basis or as compared to third-party benchmarks or competitive products, could lead to a decrease in sales or stimulate redemptions, thereby lowering the AUM and reducing our revenues. Our fundamentally-weighted equity products are designed to provide the potential for better risk-adjusted investment returns over full market cycles and are best suited for investors with a longer-term investment horizon. However, the investment approach of our equity products may not perform well during certain shorter periods of time during different points in the economic cycle.
Operational Risks
Our European business subjects us to increased operational, regulatory, financial and other risks.
We face increased operational, regulatory, financial, compliance, reputational and foreign exchange rate risks as a result of conducting our business internationally. The failure of our compliance and internal control systems to properly mitigate such additional risks, or of our infrastructure to support our European business, could result in operational failures and regulatory fines or sanctions. If our European products and operations experience any negative consequences or are perceived negatively in non-U.S. markets, it may also harm our reputation in other markets, including the U.S. market.
We have and may continue to pursue acquisitions or other strategic transactions. Any strategic transactions that we are a party to will result in increased demands on our management and other resources, may be significant in size relative to our assets and operations, result in significant changes in our business and materially and adversely affect our stock price. If we were unable to manage our strategic initiatives, it could have a material adverse effect on our business.
We have and may continue to pursue acquisitions or strategic transactions. These initiatives have placed increased demands on our management and other resources and may continue to do so in the future. We may not be able to manage our operations effectively or achieve our desired objectives on a timely or profitable basis. To do so may require, among other things:
• continuing to retain, motivate and manage our existing employees and/or attract and integrate new employees;
• developing, implementing and improving our operational, financial, accounting, reporting and other internal systems and controls on a timely basis; and
• maintaining and developing our various support functions including human resources, information technology, legal and corporate communications.
If we are unable to manage these initiatives effectively, there could be a material adverse effect on our ability to maintain or increase revenues and profitability.
Managing strategic initiatives may require continued investment in personnel, information technology infrastructure and marketing activities, as well as further development and implementation of financial, operational and compliance systems and controls. We may not be successful in implementing all of the processes that are necessary. Unless such initiatives result in an increase in our revenues that is at least proportionate to the increase in the costs associated with implementing them, our future profitability will be adversely affected.
In addition, any future strategic transactions may result in the issuance of a significant amount of our common stock or other securities that could be dilutive to our stockholders, require substantial borrowings, result in changes in our board composition and/or management team, constitute a change of control of our Company, lead to significant changes in our product offering, business operations and earning and risk profiles, and/or result in a decline in the price of our common stock.
Our ability to complete future strategic transactions depends upon a number of factors that are not entirely within our control, including our ability to identify suitable merger or acquisition candidates, negotiate acceptable terms, conclude satisfactory agreements and secure financing. Our failure to complete strategic transactions or to integrate and manage acquired or combined businesses successfully could materially and adversely affect our business, results of operations and financial conditions.
30
We instruct trades and perform other operational processes in respect of crypto basket ETPs that we have launched in Europe. Operational failures could materially affect our business and harm investors in these products.
We have launched products in Europe that are indexed to baskets of cryptocurrencies or that may allow for staking. We have outsourced the administrator, transfer agent and custodial functions for these products. While we typically outsource portfolio management services to third-party sub-advisers for our products, in this case, we instead act as determination agent and place buy and sell orders directly with a broker to rebalance these crypto basket ETPs in line with the indices. These rebalances typically occur quarterly. Expanding trading volumes may increase the risk of trading errors. The failure of any of our vendors to provide us and our products with the outsourced services and our failure to correctly place trade orders could lead to operational issues and result in financial loss to us and/or investors in our products. For products through which we derive additional revenue by staking, we operationally delegate the relevant assets to validators in our role as determination agent. Operational errors in the process could materially affect our business and harm investors in these products. In addition, staking features, such as lock-up periods, staking reward payout periods and reward amounts, are not necessarily fixed over time and can cause liquidity risk or delay the standard settlement period. This may cause redemptions to be delayed and may result in a financial loss to investors.
Catastrophic and unpredictable events could have a material adverse effect on our business.
A terrorist attack, war, power failure, cyber-attack, natural disaster, pandemic event or other catastrophic or unpredictable event could adversely affect our revenues, expenses and operating results by: interrupting our normal business operations; inflicting employee casualties, including loss of our key employees; requiring substantial expenditures and expenses to repair, replace and restore normal business operations; and reducing investor confidence. We have a disaster recovery plan to address certain contingencies, but this plan may not be sufficient in responding or ameliorating the effects of all disaster scenarios. Similarly, these types of events could also affect the ability of the third-party vendors that we rely upon to conduct our business, including parties that provide us with sub-advisory portfolio management services, custodial, fund accounting and administration services or index calculation services, to continue to provide these necessary services to us, even though they may also have disaster recovery plans to address these contingencies. In addition, a failure of the stock exchanges on which our products trade to function properly could cause a material disruption to our business. If we or our third-party vendors are unable to respond adequately or in a timely manner, these failures may result in a loss of revenues and/or increased expenses, either of which would have a material adverse effect on our operating results.
Technology Risks
Any significant limitation or failure of our technology systems, or of our third-party vendors’ technology systems, or any security breach of our information and cyber security infrastructure, software applications, technology or other systems that are critical to our operations could interrupt or damage our operations and result in material financial loss, regulatory violations, reputational harm or legal liability.
We are dependent upon the effectiveness of our own, and our vendors’, information security policies, procedures and capabilities to protect the technology systems used to operate our business, to protect the data that reside on or are transmitted through them and to maintain adequate internal controls. Although we and our third-party vendors take protective measures to secure information, our and our vendors’ technology systems have experienced cybersecurity threats and may still be vulnerable to unauthorized access, computer viruses or other events that could result in inaccuracies in our information or system disruptions or failures, which could materially interrupt or damage our operations. These risks have increased with the launch of the WisdomTree Prime mobile application and may continue to increase in the future as the mobile application’s availability expands. In addition, technology is subject to rapid change and we cannot guarantee that our competitors may not implement more advanced technology platforms for their products, which could affect our business. Any inaccuracies, delays, system failures or breaches, or advancements in technology, and the cost necessary to address them, could subject us to client dissatisfaction and losses or result in material financial loss, regulatory violations, reputational harm or legal liability, which, in turn, could cause a decline in our earnings or stock price.
Human Capital Risks
Our ability to operate effectively could be impaired if we fail to retain or recruit key personnel.
The success of our business is highly dependent on our ability to attract, retain and motivate highly skilled, and sometimes highly specialized, employees, including in particular, operations, product development, research, technology, sales and marketing personnel. Our U.S. employees generally may voluntarily terminate their employment at any time. The market for these individuals is extremely competitive and is likely to become more so as additional investment management firms enter the ETF industry and as the digital assets market continues to develop. Our compensation methods may not enable us to recruit and retain required personnel. For example, price volatility in our common stock may impact our ability to effectively use equity grants as an employee compensation incentive. Also, we may need to increase compensation levels, which would decrease our net income or increase our losses. If we are unable to retain and attract key personnel, it could have an adverse effect on our business, our results of operations and financial condition.
31
Expense and Cash Management Risks
Our expenses are subject to fluctuations that could materially affect our operating results.
Our results of operations are impacted by the magnitude of our expenses and may fluctuate as a result of inflation, as well as discretionary spending, including additional headcount, accruals for incentive compensation, marketing, advertising, sales and other expenses we incur in connection with our operations. We also have launched our digital assets business and expenses ultimately incurred in the near and long-term may be higher than anticipated. Accordingly, fluctuations in our expenses could materially affect our operating results and may vary from quarter to quarter.
Legal and Regulatory Risks
Compliance with extensive, complex and changing regulation imposes significant financial and strategic costs on our business, and non-compliance could result in fines and penalties.
We are subject to extensive regulation of our business and operations. One of our U.S. subsidiaries, WT Asset Management, is a registered investment adviser and is subject to oversight by the SEC pursuant to its regulatory authority under the Investment Advisers Act. We also must comply with certain requirements under the Investment Company Act, with respect to the WisdomTree U.S. listed ETFs for which WT Asset Management acts as investment adviser. WT Asset Management is also a member of the NFA and registered as a commodity pool operator for certain of our ETFs. As a commodity pool operator, we are subject to oversight by the NFA and the CFTC pursuant to regulatory authority under the Commodity Exchange Act. In addition, the content and use of our marketing and sales materials and of our sales force in the U.S. regarding our U.S. listed ETFs is subject to the regulatory authority of FINRA. The SEC also has recently adopted rule amendments that are designed to modernize sales and marketing materials and, as a result, impact marketing materials. We are also subject to foreign laws and regulatory authorities with respect to operational aspects of our products that invest in securities of issuers in foreign countries, in the marketing, offer and/or sales of our products in foreign jurisdictions and in our offering of investment products domiciled outside of the U.S., such as our ETPs issued by the ManJer Issuers, UCITS ETFs and ETPs issued by WMAI. Each of the regulatory bodies with jurisdiction over us has regulatory powers dealing with many aspects of our business, including the authority to grant, and, in specific circumstances to cancel, permissions to carry on particular businesses. Our or our ETPs’ failure to comply with applicable laws or regulations could result in fines, censure, suspensions of personnel or other sanctions, including revocation of our registration as an investment adviser. Even if a sanction imposed against us, our personnel or our ETPs is small in monetary amount, the adverse publicity arising from the imposition of sanctions against us, our personnel or our ETPs by regulators could harm our reputation and thus result in redemptions from our products and impede our ability to retain and attract investors in WisdomTree ETPs, all of which may reduce our revenues.
We face the risk of significant intervention by regulatory authorities, including extended investigation activity, adoption of costly or restrictive new regulations and judicial or administrative proceedings that may result in substantial penalties. Among other things, we could be fined or be prohibited from engaging in some of our business activities. The requirements imposed by our regulators are designed to ensure the integrity of the financial markets and to protect investors in WisdomTree ETPs and our advisory clients and are not designed to protect our stockholders. Consequently, these regulations often serve to limit our activities, including through WisdomTree ETP investor protection and market conduct requirements.
The regulatory environment in which we operate also is subject to modifications and further regulation. Concerns have been raised at various times about ETFs’ possible contribution to market volatility as well as the disclosure requirements applicable to certain types of more complex ETFs. In addition, the SEC recently approved a broad set of rules regarding data reporting and fund liquidity, fund valuation and funds’ use of derivatives, which are imposing additional expense and require additional administrative services and requirements, among other matters, in seeking to comply with these rules. New laws or regulations, or changes in the enforcement of existing laws or regulations, applicable to us or investors in our products also may adversely affect our business, and our ability to function in this environment will depend on our ability to constantly monitor and react to these changes. Compliance with new laws and regulations may result in increased compliance costs and expenses.
Specific regulatory changes also may have a direct impact on our revenues. In addition to regulatory scrutiny and potential fines and sanctions, regulators continue to examine different aspects of the asset management industry. New regulation, revised regulatory or judicial interpretations, revised viewpoints, outcomes of lawsuits against other fund complexes or growth in our ETP assets and/or profitability related to the annual approval process for investment advisory agreements may result in the reduction of fees under these agreements, which would mean a reduction in our revenues or otherwise may lead to an increase in costs or expenses.
Our operations outside the U.S. are subject to the laws and regulations of various non-U.S. jurisdictions and non-U.S. regulatory agencies and bodies. As we have expanded our international presence, a number of our subsidiaries and international operations have become subject to regulatory systems in various jurisdictions, comparable to those covering our operations in the U.S. Regulators in these non-U.S. jurisdictions may have broad authority with respect to the regulation of financial services including, among other things, the authority to grant or cancel required licenses or registrations.
32
From time to time, we may be involved in legal proceedings that could require significant management time and attention, possibly resulting in significant expense or in an unfavorable outcome, which could have a material adverse effect on our business, financial condition, results of operations and cash flows.
From time to time, we may be subject to litigation. In any litigation in which we are involved, we may be forced to incur costs and expenses to defend ourselves or to pay a settlement or judgment or comply with any injunctions in connection therewith if there is an unfavorable outcome. The expense of defending litigation may be significant. The amount of time to resolve lawsuits is unpredictable and defending ourselves may divert management’s attention from the day-to-day operations of our business, which could adversely affect our business, results of operations, financial condition and cash flows. In addition, an unfavorable outcome in any such litigation, including actual and potential claims by investors in our WisdomTree WTI Crude Oil 3x Daily Leveraged ETP totaling approximately €23.6 million ($26.1 million), could have a material adverse effect on our business, results of operations, financial condition and cash flows. See Note 14 to our Consolidated Financial Statements for additional information.
We may from time to time be subject to claims of infringement of third-party intellectual property rights, which could harm our business.
Third parties may assert against us alleged patent, copyright, trademark or other intellectual property rights to intellectual property that is important to our business. Any claims that our products or processes infringe the intellectual property rights of others, regardless of the merit or resolution of such claims, could cause us to incur significant costs in responding to, defending and resolving such claims, and may divert the efforts and attention of our management from our business. As a result of such intellectual property infringement claims, we could be required or otherwise decide that it is appropriate to:
• pay third-party infringement claims;
• discontinue selling the particular funds subject to infringement claims;
• discontinue using the processes subject to infringement claims;
• develop other intellectual property or products not subject to infringement claims, which could be time-consuming and costly or may not be possible; or
• license the intellectual property from the third party claiming infringement, which license may not be available on commercially reasonable terms.
The occurrence of any of the foregoing could result in unexpected expenses, reduce our revenues and adversely affect our business and financial results.
We have been issued trademark and other intellectual property rights, but may not be able to enforce or protect such intellectual property rights, which may harm our business.
Although we have trademarks, including the marks WisdomTree®, WisdomTree Prime™ and Modern Alpha®, and other intellectual property rights that are registered in the U.S. and certain other countries, including a patent relating to our index methodology and the operation of our ETFs, our ability to enforce such intellectual property rights is subject to general litigation risks. If we cannot successfully enforce our intellectual property rights, we may lose the value of our brand and business reputation. If we seek to enforce our rights, we could be subject to litigation, including challenges to our registered intellectual property right and claims that our intellectual property right is invalid or is otherwise not enforceable in jurisdictions where our intellectual property right is not registered. Furthermore, our assertion of intellectual property rights could result in the other party seeking to assert alleged intellectual property rights of its own or assert other claims against us, which could harm our business. If we are not ultimately successful in defending ourselves against these claims in litigation, we may be subject to the risks described in the immediately preceding risk factor entitled “We may from time to time be subject to claims of infringement of third-party intellectual property rights, which could harm our business.”
Digital Assets Risks
As we endeavor to expand our digital assets product offerings and services beyond our existing ETP business, we believe the risks associated with our digital assets business include, but are not limited to, the following risks:
33
Competition risks
Competition in the digital assets industry on a global basis is increasing, ranging from large, established financial incumbents to smaller, early-stage financial technology providers and companies. There are jurisdictions with more stringent and robust regulatory and compliance requirements than others which could impact the ability of a company to compete in the digital assets industry. Our ability to successfully compete will depend largely on offering innovative products through digital asset exposures (and more broadly in blockchain-enabled finance, including savings and payments), having strong internal controls and risk management infrastructure to enable customer trust, embracing regulation, developing strategic partnerships with participants in the digital assets ecosystem and broader financial services ecosystem, promoting thought leadership and consumer education or awareness, building upon our brand and attracting and retaining talented employees. Failure to do so could negatively impact the success of our digital assets business.
New product risks
We have and may continue to spend substantial time and resources developing our digital assets product offerings and services. If these products and initiatives are not successful, or their implementation or launches are delayed, including in connection with our inability to obtain new product regulatory approvals, we may not be able to offset their costs, which could have an adverse effect on our business, reputation, financial condition and operating results.
Our digital assets business subjects us to risks similar to those associated with any new product offerings, including, but not limited to, our ability to accurately anticipate market demand and adoption, technical issues with the operation of the products, and legal and regulatory risks as discussed herein. Substantial risks and uncertainties are associated with the introduction of new products and services, including rapid technological change in the industry, significant and ongoing investments required to bring new products and services to market in a timely manner at competitive prices, protection of intellectual property and other confidential information, the competition for employees with the necessary expertise and experience, and producing sales and other materials that fully and accurately describe the product or service and its underlying risks and that are compliant with applicable regulations. New products or services may fail to operate or perform as expected and may not produce anticipated efficiencies, savings or benefits. Our failure to manage these risks and uncertainties also exposes us to enhanced risk of operational lapses and third-party claims, which may result in the recognition of financial statement liabilities.
Failure to successfully manage these risks in the development and implementation of our digital assets business could have a material adverse effect on our business, reputation, financial condition and operating results.
Outsourced service provider risks
We rely on third-party service providers in connection with different facets of our digital assets business, including but not limited to custodial arrangements, blockchain and wallet infrastructure, banking relationships, cloud computing, payment platforms and processors, data infrastructure, customer support, compliance support and product development, including mobile application development, all of which are critical to the success of our digital assets business. In addition, we have partnered with a financial institution to provide co-branded debit cards to retail customers. The loss of, or interruption of service from, a critical third-party service provider could adversely impact our digital assets business, operating results and financial condition. We may incur significant costs to resolve any such disruptions in service. In addition, such third-party service providers may be subject to financial, legal, regulatory and labor issues, data security and cybersecurity incidents, denial-of-service attacks, sabotage, privacy breaches or violations, fraud and other misconduct, which could directly or indirectly have an impact on our digital assets products and services. If any third-party service provider fails to adequately or appropriately render services or fails to meet its contractual requirements (including compliance with applicable laws and regulations), we could be subject to regulatory enforcement actions and claims from third parties (including our customers), and suffer economic and reputational harm that could have an adverse effect on our digital assets business, operating results and financial condition.
Cybersecurity risks
The use of various technologies is vital to our digital assets business and will become more prevalent, which will make us more susceptible to operational and data security risks resulting from a breach in cybersecurity, including cyberattacks. A breach in cybersecurity, intentional or unintentional, may have an adverse impact on our digital assets business in many ways, including but not limited to, the loss or destruction of proprietary information, theft or corruption of data, denial-of-service attacks on websites or network resources, and the unauthorized release or misuse of confidential information.
Regulatory risks
The digital assets industry is rapidly evolving at an unprecedented rate. There is a high degree of regulatory uncertainty associated with the digital assets industry, which means that the products and services our digital assets business provides or may provide in the future could subject us to enhanced regulatory scrutiny or otherwise materially impact the quality or nature of such products or services. The effect of any future legal or regulatory change or interpretation both domestically and internationally is unknown and such change could be substantial and adverse to our digital assets business.
34
In addition, we are actively engaged with a variety of U.S. federal and state regulators (e.g., the SEC, FINRA, NYDFS and other state regulators) to secure, as necessary, or maintain the appropriate regulatory, registration and/or licensing approvals for various business initiatives and operations, including but not limited to: a New York state-chartered limited purpose trust company; money services and money transmitter business; limited purpose broker-dealer; transfer agent; investment adviser; and investment funds. For example, we are licensed as a money transmitter or the equivalent in many U.S. states and the District of Columbia, but we may be unable to obtain such licenses in all U.S. states (including in the state of New York) or may experience significant delays, and this could have an adverse effect on our digital assets business. As we seek to expand globally, similar approvals and/or reliance on exemptions will be required in applicable foreign markets, which also may involve approvals specific to a digital assets or related business. As we secure the appropriate regulatory, registration and/or licensing approvals, or otherwise rely on, seek or confirm exemptions therefrom, in connection with our digital assets business, we are and will be subject to a myriad of complex and evolving global policy frameworks and associated regulatory requirements that we need to comply with, or otherwise be exempt from, to ensure our digital assets products and services are successfully brought to different markets in a compliant manner. Failure to secure and/or comply with any such approvals and exemptions could result in, among other things, revocation of required licenses or registrations, loss of approved status, private litigation, administrative enforcement actions, sanctions, civil and criminal liability, and constraints on our ability to continue to operate our digital assets business, and have an adverse effect on our digital assets business.
Blockchain infrastructure risks
The consensus or governance mechanisms of blockchain networks are subject to change and malfunctions and may not receive adequate adoption from users and miners, which could negatively impact the blockchain network’s ability to scale and improve programmability, transparency, auditability and security. In addition, blockchain networks face significant challenges in connection with the volume, speed, security and cost of transactions, and their efforts to increase or enhance such characteristics of the blockchain network may not be successful or adversely affect other characteristics of the blockchain network. If the digital asset awards for verifying and confirming transactions on a blockchain network are not sufficiently high to incentivize miners, miners may cease to verify and confirm such transactions or otherwise demand higher fees, which could negatively affect the value of a digital asset.
Blockchain technology risks
Blockchain technology is a relatively new and untested technology which operates as a distributed ledger. Blockchain systems could be vulnerable to fraud, particularly if a significant minority of participants colluded to defraud the rest. Access to a given blockchain requires an individualized key, which if compromised, could result in loss due to theft, destruction or inaccessibility. There is little regulation of blockchain technology other than the intrinsic public nature of the blockchain system. Any future regulatory developments could affect the viability and expansion of our use of blockchain technology. There are currently a number of competing blockchain platforms with competing intellectual property claims. The uncertainty inherent in these competing technologies could cause companies to use alternatives to blockchain. In addition, blockchain networks may undergo technological developments, such as the Ethereum blockchain’s change in September 2022 from proof-of-work mining to a blockchain based on proof-of-stake validation. Segments of the mining community were against this change, which was complex and involved a merger of the then existing Ethereum blockchain with the new Ethereum blockchain, which could potentially lead to greater centralization. Further, certain miners and other users resisted adoption of the new Ethereum blockchain and it is possible that the two Ethereum blockchains (among potentially others) will endure and compete going forward, which may also slow or impede transactions. The risks associated with blockchain technology may not emerge until the technology is widely used, which could adversely impact our digital assets business.
Fork risks
Blockchain software is generally open-source. Any user can download the software, modify it and then propose that the blockchain network adopt the modification. When a modification is introduced and a substantial majority of users consent to the modification, the change is implemented and the blockchain network remains uninterrupted. However, if less than a substantial majority of users consent to the proposed modification, and the blockchain consensus mechanism, such as that used by Ethereum, allows for the modification to nonetheless be implemented by some users and the modification is not compatible with the software prior to its modification, the consequence would be what is known as a “fork” (i.e., “split”) of the blockchain network (and the blockchain), with one version running the pre-modified software and the other running the modified software. The effect of such a fork would be the existence of two (or more) versions of the blockchain network running in parallel, but with each version’s native asset lacking interchangeability. Additionally, a fork could be introduced by an unintentional, unanticipated software flaw in the multiple versions of otherwise compatible software users run. If a fork occurs, the original blockchain and the forked blockchain could potentially compete with each other for users and other participants, leading to a loss of these for the original blockchain. A fork could adversely affect our digital assets business.
35
Anti-Money Laundering (“AML”) risks
The decentralized infrastructure and anonymous or pseudonymous nature of digital assets could facilitate and create the opportunity for money laundering and terrorist financing activities, thereby circumventing certain anti-money laundering and counter terrorist financing laws and regulations designed to prevent financial crimes which could negatively impact our digital assets business. In addition, certain aspects of our digital assets business will have significantly greater anti-money laundering risk, including risk of fines or sanctions, than our historical ETP business due to the greater number of potential customers, which may also include customers considered to be higher risk and/or customer types considered to be higher risk, for which anti-money laundering and related obligations will apply.
Data privacy risks
In connection with the products or services offered by our digital assets business, we may collect, store, process, or transmit nonpublic information (including personally identifiable information and sensitive personally identifiable information) of a customer or consumer to a significantly greater extent than in our historical ETP business. Any change or failure to comply with data privacy laws or regulations related to the collection, processing, use and storage of such nonpublic information could materially affect our digital assets business and overall financial health.
Other risks
The risk of loss in purchasing, selling, trading, using or holding digital assets can be substantial. The price and liquidity of digital assets may be subject to high degrees of volatility resulting in large deviations or fluctuations from normalized levels. There is also heightened custodial risk due to the unique safekeeping attributes associated with public and private keys of digital assets.
Other Company Risks
Responding to actions of activist stockholders against us has been costly and the possibility that activist stockholders may wage proxy contests or seek representation on our Board of Directors in the future may be disruptive and cause uncertainty about the strategic direction of our business.
During fiscal years 2022 and 2023, we were the target of stockholder activism whereby a certain investor, acting together with other investors during 2022 (the “Investor Group”) and acting alone during 2023 (the “Investor”), notified us of their intention to nominate director candidates to stand for election to the Board of Directors at the 2022 and 2023 Annual Meetings of Stockholders. On May 25, 2022, we entered into a cooperation agreement (the “Cooperation Agreement”) with the Investor Group whereby we agreed, among other things, to increase the size of our Board of Directors by two to a total of nine directors and appoint two nominees proposed by the Investor Group. At the 2023 Annual Meeting of Stockholders, our stockholders elected five of our six nominees to the Board of Directors and one of three nominees proposed by the Investor. Responding to actions by the Investor and the Investor Group has been costly and actions by activist stockholders to seek representation on our Board of Directors in the future may similarly impact us.
Activist stockholders, such as the Investor, may from time to time attempt to effect changes in our strategic direction, and in furtherance thereof, may seek changes in how our Company is governed. Our Board of Directors and management strive to maintain constructive, ongoing communications with our stockholders, including the Investor, and welcome their views and opinions with the goal of enhancing value for all stockholders. However, an activist campaign that seeks to replace members of our Board of Directors or changes in our strategic direction could have an adverse effect on us because:
• responding to actions by activist stockholders is costly and may be disruptive, time-consuming and divert the attention of our Board of Directors and senior management from the pursuit of business strategies, which could adversely affect our results of operations and financial condition;
• perceived uncertainties about our future direction as a result of changes to the composition of our Board of Directors or changes to our stockholder base may lead to the perception of a change in the direction of the business, instability or lack of continuity which may be exploited by our competitors, may result in the loss of potential business opportunities and may make it more difficult to attract and retain qualified personnel and business partners;
• these types of actions could cause significant fluctuations in our stock price based on temporary or speculative market perceptions or other factors that do not necessarily reflect the underlying fundamentals and prospects of our business; and
• if individuals are elected to our Board of Directors with a specific agenda, it may adversely affect our ability to effectively implement our business strategy and to create additional value for our stockholders.
36
A change of control of our Company would automatically terminate our investment management agreements relating to the WisdomTree U.S. listed ETFs and Digital Funds, unless the Board of Trustees of the WisdomTree Trust, WisdomTree Digital Trust and shareholders of each voted to continue the agreements. A change in control could occur if a third party were to acquire a controlling interest in our Company.
Under the Investment Company Act, an investment management agreement with a fund must provide for its automatic termination in the event of its assignment. The fund’s board must vote to continue such an agreement following any such assignment and the shareholders of the WisdomTree Trust and WisdomTree Digital Trust must approve the assignment. The cost of obtaining such shareholder approval can be significant and ordinarily would be borne by us. Similarly, under the Investment Advisers Act, a client’s investment management agreement may not be “assigned” by the investment adviser without the client’s consent.
An investment management agreement is considered under both acts to be assigned to another party when a controlling block of the adviser’s securities is transferred. Under both acts, there is a presumption that a stockholder beneficially owning 25% or more of an adviser’s voting stock controls the adviser and conversely a stockholder beneficially owning less than 25% is presumed not to control the adviser. In our case, an assignment of our investment management agreements may occur if a third party were to acquire a controlling interest in our Company. We cannot be certain that the Trustees of the WisdomTree Trust and WisdomTree Digital Trust would consent to assignments of our investment management agreements or approve new agreements with us if a change of control occurs. And even if such approval were obtained, approval from the shareholders of the WisdomTree Trust and WisdomTree Digital Trust would be required to be obtained; such approval could not be guaranteed and even if obtained, likely would result in significant expense. This restriction may discourage potential purchasers from acquiring a controlling interest in our Company.
Our revenues could be adversely affected if the Independent Trustees of the WisdomTree Trust or WisdomTree Digital Trust, as applicable, do not approve the continuation of our advisory agreements or determine that the advisory fees we receive from the WisdomTree U.S. listed ETFs or Digital Funds should be reduced.
Our revenues are derived primarily from investment advisory agreements with related parties. Our advisory agreements with the WisdomTree Trust and WisdomTree Digital Trust, and the fees we collect from the WisdomTree U.S. listed ETFs and Digital Funds are subject to review and approval by the Independent Trustees of the WisdomTree Trust and WisdomTree Digital Trust, as applicable. The advisory agreements are subject to initial review and approval. After the initial two-year term of the agreement for each ETF or Digital Fund, the continuation of such agreement must be reviewed and approved at least annually by a majority of the Independent Trustees. In determining whether to approve the agreements, the Independent Trustees consider factors such as the nature and quality of the services provided by us, the fees charged by us and the costs and profits realized by us in connection with such services, as well as any ancillary or “fall-out” benefits from such services, the extent to which economies of scale are shared with the WisdomTree U.S. listed ETFs or Digital Funds, and the level of fees paid by other similar funds. Our revenues would be adversely affected if the Independent Trustees do not approve the continuation of our advisory agreements or determines that the advisory fees we charge to any particular fund are too high, resulting in a reduction of our fees.
Damage to our reputation could adversely affect our business.
We believe we have developed a strong brand and a reputation for innovative, thoughtful products, favorable long-term investment performance and excellent client services. The WisdomTree name and brand is a valuable asset and any damage to it could hamper our ability to maintain and grow our AUM and attract and retain employees, thereby having a material adverse effect on our revenues. Risks to our reputation may range from regulatory issues to unsubstantiated accusations. Managing such matters may be expensive, time-consuming and difficult.
Risks Relating to our Common and Preferred Stock and Convertible Notes
The market price of our common stock has been fluctuating significantly and may continue to do so, and you could lose all or part of your investment.
The market price of our common stock has been fluctuating significantly and may continue to do so, depending upon many factors, some of which may be beyond our control, including:
• actions of activist stockholders against us, which have been costly and may be disruptive and may cause uncertainty about the strategic direction of our business;
• decreases in our AUM;
• variations in our quarterly operating results;
• differences between our actual financial operating results and those expected by investors and analysts;
• publication of research reports about us or the investment management industry;
• changes in expectations concerning our future financial performance and the future performance of the ETP industry and the asset management industry in general, including financial estimates and recommendations by securities analysts;
37
• our strategic moves and those of our competitors, such as acquisitions or consolidations;
• changes in the regulatory framework of the ETP industry and the asset management industry in general and regulatory action, including action by the SEC to lessen the regulatory requirements or shorten the process under the Investment Company Act to become an ETP sponsor;
• the level of demand for our stock, including the amount of short interest in our stock;
• changes in general economic or market conditions; and
• realization of any other of the risks described elsewhere in this section.
In addition, stock markets in general have experienced volatility that has often been unrelated to the operating performance of a particular company. These broad market fluctuations may adversely affect the trading price of our common stock. Furthermore, in the past, market fluctuations and price declines in a company’s stock have led to securities class action litigations or other derivative stockholder lawsuits. If such a suit were to arise, it could cause substantial costs to us and divert our resources regardless of the outcome.
If equity research analysts issue unfavorable commentary or downgrade our common stock, the price of our common stock could decline.
The trading market for our common stock relies in part on the research and reports that equity research analysts publish about us and our business. We do not control the opinions of these analysts. The price and trading volume of our common stock could decline if one or more equity analysts issue unfavorable commentary or downgrade our common stock or cease publishing reports about us or our business.
We may not have the ability to raise the funds necessary to settle conversions of the Convertible Notes or to repurchase the Convertible Notes upon a fundamental change.
We currently have outstanding $150.0 million of 3.25% convertible senior notes due 2026 and $130.0 million in aggregate principal amount of 5.75% convertible senior notes due 2028, which we collectively refer to as the Convertible Notes. Holders of the Convertible Notes have the right to require us to repurchase their notes upon the occurrence of certain change of control transactions or liquidation, dissolution or common stock delisting events (each, a “fundamental change”), at a repurchase price equal to 100% of the principal amount of the notes to be repurchased, plus accrued and unpaid interest, if any, as described in the respective indentures between us and the trustee. In addition, upon conversion of the Convertible Notes, we will be required to make cash payments in respect of the notes being converted as described in the indentures. However, we may not have enough available cash or be able to obtain financing at the time we are required to make repurchases of notes surrendered therefor or notes being converted. In addition, our ability to repurchase the notes or to pay cash upon conversions of the notes may be limited by law, regulatory authority or agreements governing our future indebtedness. Further, if the fundamental change also constitutes a change of control under the Certificate of Designations for our Series A Preferred Stock and we are required to make other redemption payments as a result of the change of control, we would be required to satisfy that obligation before making any payments on the notes. Our failure to repurchase notes at a time when the repurchase is required by the applicable indenture or to pay any cash payable on future conversions of the notes as required by the indenture would constitute a default under the indenture.
The conditional conversion feature of the Convertible Notes, if triggered, may adversely affect our financial condition and liquidity.
We currently have outstanding $150.0 million in aggregate principal amount of 3.25% convertible senior notes due 2026 and $130.0 million in aggregate principal amount of 5.75% convertible senior notes due 2028, which we collectively refer to as the Convertible Notes. In the event the conditional conversion feature of the Convertible Notes is triggered, holders of notes will be entitled to convert the notes at any time during specified periods at their option, as described in the indentures. If one or more holders elect to convert their notes, we would be required to settle any converted principal through the payment of cash, which could adversely affect our liquidity.
Series A Non-Voting Convertible Preferred Stock issued in connection with the ETFS Acquisition contain redemption rights, which, if triggered, could materially impact our financial position.
In connection with the ETFS Acquisition, we issued 14,750 shares of Series A Non-Voting Convertible Preferred Stock, or Series A Preferred Stock, to ETFS Capital, which are convertible into 14,750,000 shares of our common stock, subject to certain restrictions. ETFS Capital also has redemption rights for the Series A Preferred Stock to protect against corporate events such as our having an insufficient number of shares of authorized common stock to permit full conversion and if, upon a change of control of us, ETFS Capital does not receive the same amount per share of Series A Preferred Stock that it would have received had these shares been converted prior to a change of control. Any such redemption will be at a price per share of Series A Preferred Stock equal to the dollar volume-weighted average price for a share of common stock for the 30-trading day period ending on the date of such attempted conversion or change of control, as applicable, multiplied by 1,000. The redemption value of the Series A Preferred Stock was $96.9 million at December 31, 2023.
38
Future issuances of our common stock or equity-linked securities could lower our stock price and dilute the interests of existing stockholders.
We may issue additional shares of our common stock or equity-linked securities in the future, either in connection with an acquisition or for other business reasons. The issuance of a substantial amount of common stock or equity-linked securities could have the effect of substantially diluting the interests of our current stockholders. In addition, the sale of a substantial amount of common stock or equity-linked securities in the public market, either in the initial issuance or in a subsequent resale by the target company in an acquisition which received such common stock as consideration or by investors who acquired such common stock in a private placement, could have a material adverse effect on the market price of our common stock.
Provisions in our certificate of incorporation and by-laws may prevent or delay an acquisition of our Company, which could decrease the market value of our common stock.
Provisions of Delaware law, our certificate of incorporation and our by-laws may discourage, delay or prevent a merger, acquisition or other change in control that stockholders may consider favorable. These provisions may also prevent or delay attempts by stockholders to replace or remove our current management or members of our Board of Directors. These provisions include:
• limitations on the removal of directors;
• advance notice requirements for stockholder proposals and nominations;
• the inability of stockholders to act by written consent or to call special meetings;
• the ability of our Board of Directors to make, alter or repeal our by-laws; and
• the authority of our Board of Directors to issue preferred stock with such terms as our Board of Directors may determine.
In addition, we are subject to the provisions of Section 203 of the Delaware General Corporation Law, which limits business combination transactions with stockholders of 15% or more of our outstanding voting stock that our Board of Directors has not approved. These provisions and other similar provisions make it more difficult for stockholders or potential acquirers to acquire us without negotiation. These provisions may apply even if some stockholders may consider the transaction beneficial to them.
As a result, these provisions could limit the price that investors are willing to pay in the future for shares of our common stock. These provisions might also discourage a potential acquisition proposal or tender offer, even if the acquisition proposal or tender offer is at a premium over the then current market price for our common stock.
Our stockholder rights plan, or “poison pill,” includes terms and conditions that could discourage a takeover or other transaction that stockholders may consider favorable.
On June 16, 2023, our stockholders voted to ratify the adoption by our Board of Directors of the Stockholder Rights Agreement, dated March 17, 2023 and subsequently amended on May 4, 2023 and on May 10, 2023 (as amended, the “Stockholder Rights Agreement”), by and between the Company and Continental Stock Transfer & Trust Company, as Rights Agent. The Stockholder Rights Agreement was adopted in response to stockholder activism concerns and is intended to protect the Company and its stockholders from efforts by a single stockholder or group of stockholders to obtain control of the Company without paying a control premium through a number of recognized stockholder protections. Generally, the Stockholder Rights Agreement works by causing substantial dilution to any person or group (other than specified exempt persons) that acquires 10% (or 20% in the case of passive stockholders) or more of the shares of common stock without the approval of the Board of Directors (such person or group, an “Acquiring Person”) through the issuance of “Rights” to stockholders of record as of, and subsequent to, the close of business on March 28, 2023, which Rights entitle the registered holders thereof (other than the Acquiring Person) to receive additional shares of our common stock upon exercise of such Rights. As a result, the overall effect of the Stockholder Rights Agreement may be to render more difficult or discourage a merger, tender or exchange offer or other business combination involving our Company that is not approved by the Board of Directors even if the offer may be considered beneficial by some stockholders. The Rights will expire at the close of business on March 16, 2024, unless previously redeemed or exchanged by the Company. See Note 19 to our Consolidated Financial Statements for additional information.
The payment of dividends to our stockholders and our ability to repurchase our common stock is subject to the discretion of our Board of Directors and may be limited by our financial condition and any applicable laws.
Any determination as to the payment of dividends or stock repurchases, as well as the level of such dividends or repurchases, will depend on, among other things, general economic and business conditions, our level of AUM, our strategic plans, our financial results and condition, limitations associated with new credit facilities or other agreements that could limit the amount of dividends we are permitted to pay or the stock we may repurchase, and any applicable laws, including the Inflation Reduction Act, which includes an excise tax that would impose a 1% surcharge on stock repurchases. If, as a consequence of these various limitations and restrictions, we are unable to generate sufficient income from our business, we may need to reduce or eliminate the payment of dividends on our common stock or cease repurchasing our common stock. Any change in our stock repurchases or the level of our dividends or the suspension of the payment thereof could adversely affect our stock price.
In addition, our Board of Directors is authorized, without stockholder approval, to issue preferred stock with such terms as our Board of Directors may, in its discretion, determine. Our Board of Directors could, therefore, issue preferred stock with dividend rights superior to that of the common stock, which could also limit the payment of dividends on the common stock.
39
ITEM 1B. UNRESOLVED STAFF COMMENTS
We have no unresolved comments from the SEC staff relating to our periodic or current reports filed with the SEC pursuant to the Exchange Act.
ITEM 1C. CYBERSECURITY
Cybersecurity Risk Management and Strategy
Under the oversight of our Board of Directors, we have implemented and maintain cybersecurity risk management policies and procedures that include processes for the identification, assessment and treatment through mitigation, transfer, avoidance and/or acceptance of cybersecurity risks.
Our cybersecurity risk management policies and procedures are informed by industry standards, and they are designed to address cybersecurity risks identified by external auditors and assessors, threat intelligence providers, internal stakeholders, vulnerability management programs and security management programs. Our team of information technology and cybersecurity professionals, led by our Chief Information Officer, or CIO, manages and maintains remediation strategies for identified cybersecurity risks and regularly reports on such risks to senior management, including our Governance Committee as described below.
Our cybersecurity risk management program is designed to be aligned with our business strategy. It shares common methodologies, reporting channels and governance processes that apply to other areas of enterprise risk, including legal, compliance, strategic, operational and financial risk. Key elements of our cybersecurity risk management program include:
• periodic risk assessments designed to help identify cybersecurity risks to our critical systems, information, products, services and our broader enterprise information technology environment;
• a security and infrastructure team principally responsible for managing our cybersecurity risk assessment processes, our security controls and our response to cybersecurity incidents;
• the use of external service providers, where appropriate, to assess, test or otherwise assist with aspects of our security controls;
• employee training and awareness programs that include periodic and ongoing assessments in an effort to drive adoption and awareness of cybersecurity processes and controls;
• a cybersecurity incident response plan that includes procedures for responding to cybersecurity incidents; and
• processes to evaluate cybersecurity risks posed by critical third-party vendors, including through the use of security questionnaires.
Additionally, as a public company, we are subject to Sarbanes-Oxley (SOX) requirements and must undergo independent audits of Information Technology General Controls (ITGC) in support of Internal Control over Financial Reporting (ICFR). These audits assess key information security and cybersecurity risks in the environment that may affect the confidentiality, integrity and availability of financial reporting systems and data. If any control deficiencies that represent material cybersecurity risks were identified, those would be reported to the Audit Committee, and the results of these evaluations would be considered in the overall audit opinion for the Company.
Governance Related to Cybersecurity Risks
Our cybersecurity risk management program and related operations and processes are directed by our CIO. Currently, the CIO role is held by an individual who has been in the role for over nine years, has over 22 years of cybersecurity, information technology and systems engineering experience, and has advanced training in the field of technology.
40
The CIO is a member of our Governance Committee and regularly reports on cybersecurity risk management to other members of the Governance Committee comprised of the Company’s senior executive officers. The Governance Committee oversees the prioritization and escalation of risks from cybersecurity threats and is responsible for strategy, operations, financial management, information technology, compliance, legal, administration and corporate governance. The members of the Governance Committee collectively possess experience in these areas, including cybersecurity and risk management.
The Audit Committee oversees our management of cybersecurity risks. Pursuant to the Audit Committee charter, the Audit Committee is responsible for discussing cybersecurity-related risks with management and the steps management has taken to monitor and control such risks, including our risk assessment and risk management policies. The CIO regularly reports to the Audit Committee on our cybersecurity risks, and the chair of the Audit Committee reports on these discussions with the full Board of Directors. In addition, the CIO provides periodic reports to our Board of Directors.
While we have not, as of the date of this Report, experienced a cybersecurity incident that resulted in a material adverse impact to our business or operations, there can be no guarantee that we will not experience such an incident in the future. For information regarding cybersecurity risks that may materially affect our Company, see “Item 1A. Risk Factors” included in this Report.
ITEM 2. PROPERTIES
Our principal executive office is located at 250 West 34th Street, 3rd Floor, New York, New York, pursuant to a license agreement that expires in April 2025, with the option to terminate in April 2024. This reduced footprint, as compared to our prior headquarters, better aligns with the number of employees expected to collaborate in person on any given day. While we believe having a physical office space for employees to work and socialize is important, we embrace a “Work Smart” philosophy that transcends physical work settings, with a focus on optimizing productivity, efficiency and effectiveness of our work. Time in the office generally is not prescribed, and team leaders are empowered to determine how their teams work best, based on their roles, with employees remaining accountable for achieving individual, team and Company outcomes. We believe that this space is sufficient to meet our needs until the expiration of the license agreement.
ITEM 3. LEGAL PROCEEDINGS
We may be subject to reviews, inspections and investigations by the SEC, CFTC, NFA, state and foreign regulators, as well as legal proceedings arising in the ordinary course of business. See Note 14 to our Consolidated Financial Statements for additional information regarding actual and potential claims by investors in our WisdomTree WTI Crude Oil 3x Daily Leveraged ETP totaling approximately €23.6 million ($26.1 million).
ITEM 4. MINE SAFETY DISCLOSURES
Not applicable.
41
PART II
ITEM 5. MARKET FOR REGISTRANT’S COMMON EQUITY, RELATED STOCKHOLDER MATTERS AND ISSUER PURCHASES OF EQUITY SECURITIES
Market Information
Our common stock is traded on the New York Stock Exchange under the symbol “WT.” As of December 31, 2023, there were 30 holders of record of shares of our common stock and we believe there were approximately 18,000 beneficial owners of our common stock.
In November 2014, we commenced a quarterly cash dividend and intend to continue to pay regular dividends to our stockholders. Any determination as to the payment of dividends, as well as the level of such dividends, will depend on, among other things, general economic and business conditions, our level of AUM, our strategic plans, our financial results and condition, limitations associated with new credit facilities or other agreements that could limit the amount of dividends we are permitted to pay, and any applicable laws.
Issuer Purchases of Equity Securities
The following table provides information with respect to purchases made by or on behalf of the Company or any “affiliated purchaser” of shares of our common stock as part of publicly announced plans or programs.
On February 22, 2022, our Board of Directors approved an increase of $85.7 million to our share repurchase program and extended the term for three years through April 27, 2025. There were no shares repurchased under this program during the three months ended December 31, 2023. As of December 31, 2023, approximately $96.4 million remained under this program for future purchases.
|
Total Number |
Average Price |
Total Number |
Approximate |
|||||||
|
Period |
(in thousands) |
|||||||||
|
October 1, 2023 to October 31, 2023 |
— |
$ |
— |
— |
|
|||||
|
November 1, 2023 to November 30, 2023 |
— |
$ |
— |
— |
|
|||||
|
December 1, 2023 to December 31, 2023 |
— |
$ |
— |
— |
|
|
||||
|
Total |
— |
$ |
— |
— |
$ |
96,406 |
||||
In addition, on November 20, 2023, we repurchased our Series C Non-Voting Convertible Preferred Stock, par value $0.01 per share (the “Series C Preferred Stock”), which was convertible into approximately 13.1 million shares of our common stock, for aggregate cash consideration of approximately $84.4 million. See Note 23 to our Consolidated Financial Statements for additional information.
ITEM 6. [RESERVED]
42
ITEM 7. MANAGEMENT’S DISCUSSION AND ANALYSIS OF FINANCIAL CONDITION AND RESULTS OF OPERATIONS
The following discussion and analysis of our financial condition and results of operations should be read together with our consolidated financial statements and the related notes and the other financial information included elsewhere in this Report. In addition to historical consolidated financial information, the following discussion contains forward-looking statements that reflect our plans, estimates and beliefs. Our actual results could differ materially from those discussed in the forward-looking statements. Factors that could cause or contribute to these differences include those discussed below. For a more complete description of the risks noted above and other risks that could cause our actual results to materially differ from our current expectations, please see Item 1A. “Risk Factors” of this Report. We assume no obligation to update or revise publicly any forward-looking statements, whether as a result of new information, future events or otherwise, unless required by law.
Introduction
We are a global financial innovator, offering a well-diversified suite of ETPs, models, solutions and products leveraging blockchain technology. We empower investors and consumers to shape their future and support financial professionals to better serve their clients and grow their businesses. We are leveraging the latest financial infrastructure to create products that provide access, transparency and an enhanced user experience. Building on our heritage of innovation, we are also developing and have launched next-generation digital products, services and structures, including Digital Funds and tokenized assets, as well as our blockchain-native digital wallet, WisdomTree Prime, which is currently available in the U.S. in 38 states, representing approximately 70% of the U.S. population.
We had approximately $100.1 billion in AUM as of December 31, 2023. Our family of ETPs includes products that provide exposure to equities, fixed income, commodities, leveraged-and-inverse, currency, alternatives and cryptocurrency strategies. We have launched many first-to-market products and pioneered alternative weighting we call “Modern Alpha,” which combines the outperformance potential of active management with the benefits of passive management to offer investors cost-effective funds that are built to perform. Most of our equity-based funds employ a fundamentally weighted investment methodology, which weights securities based on factors such as dividends, earnings or investment factors, whereas most other industry indexes use a capitalization weighted methodology. These products are distributed through all major channels in the asset management industry, including banks, brokerage firms, registered investment advisers, institutional investors, private wealth managers and online brokers primarily through our sales force. We believe technology is altering the way financial advisors conduct business and through our Advisor and Portfolio Solutions programs we offer technology-enabled and research-driven solutions including portfolio construction, asset allocation, practice management services and digital tools to help financial advisors address technology challenges and grow and scale their businesses.
We are at the forefront of innovation and believe that tokenization and leveraging the utility of blockchain technology is the next evolution in financial services. We are building the foundation that we believe will allow us to lead in this coming evolution. WisdomTree Prime, our blockchain-native digital wallet, positions us to expand our blockchain-enabled financial product and services offerings with a new direct-to-consumer channel where spending, saving and investing are united. As we continue to pursue our digital assets strategy, we are embracing what we refer to as “responsible DeFi,” which we believe upholds the foundational principles of regulation in this innovative and quickly evolving space. We believe that our expansion into digital assets and blockchain-enabled finance complements our existing core competencies in a holistic manner, and will diversify our revenue streams and contribute to our growth.
Executive Summary
Our business continues to generate significant positive momentum while executing against our long-term strategic initiatives. We ended 2023 with record AUM of $100.1 billion. Our revenues and operating income increased 15.8% and 45.6%, respectively, during the year ended December 31, 2023 as compared to the prior year, which translated into 520 basis points of operating margin expansion. This past year we generated over $10.4 billion of net inflows, representing annual organic flow growth of approximately 13%. Our inflow profile is both broad and deep as we have gathered net inflows into 6 of our 8 major product categories, including fixed income, international equity and emerging markets products, representing organic flow growth in these categories of 39%, 28% and 21%, respectively. This diversification is driving upward our year-to-date average fee capture on our flows, which was approximately two times greater than our fee capture in the prior year. AUM diversification and product performance have us well-positioned for this growth trajectory to continue.
43
Our models strategy is another growth driver where we are succeeding, with our model portfolios available to over 70,000 advisors. We are focused on adding new clients and continuing to deepen our impact on partner platforms such as Merrill Lynch, Morgan Stanley, LPL Financial and others, as well as being an outsourced solution for smaller registered investment advisers and independent broker-dealers to make model portfolios easier to trade through our Portfolio Solutions program. In 2023, we observed a 20% increase in the number of clients that hold multiple WisdomTree products, while at the same time we also grew our overall client base by more than 20%. We believe that continued success penetrating our accessible market and winning advisor mindshare should lead to model flows that are recurring in nature and stackable on top of our current inflow profile.
While we remain focused on providing investors with the best product structure to access various asset classes through ETFs, we believe that by leveraging blockchain technology, tokenized assets are the best product structure of tomorrow and the future of financial services. We are an early mover in this space, with the launch of our blockchain-native wallet, WisdomTree Prime, a new direct-to-consumer channel where spending, saving and investing are united. WisdomTree Prime provides access to bitcoin, ether, tokenized gold and U.S. dollar tokens, as well as 13 Digital Funds, including a government money market fund and other digital funds offering asset allocation, fixed income and equity exposures. In addition, we have partnered with a financial institution to provide co-branded debit cards to our retail customers on the WisdomTree Prime platform. We continue to focus on enhancing the products and capabilities of the platform with plans to allow for peer-to-peer transfers and payments in the upcoming quarters. We are also exploring strategic partnerships and other business development opportunities for both our platform and product suite that could unlock additional tokenization revenue streams in the future.
We are executing on our long-term growth strategy and expect ongoing flows and AUM growth to translate into further margin expansion and outperformance going forward, with our recent investments in digital assets creating additional value for our stockholders over time.
Additional business highlights include the following:
• Strong product performance with over 80% of our U.S. listed AUM covered by Morningstar in the top two quartiles of peer performance on the 3-year and 10-year timeframes. In addition, approximately 50% of our U.S. listed AUM is rated 4- or 5-star by Morningstar (less than 5% in 1-and 2-star funds).
• We launched nine new European listed ETPs, three new U.S. listed ETPs (including the WisdomTree Bitcoin Fund which was among the first to launch in the U.S.) and 12 new Digital Funds. The WisdomTree Bitcoin Fund launched in the U.S. on the Cboe BZX Exchange in January 2024.
• We reduced our convertible senior notes outstanding by $45.0 million, by issuing $130.0 million of convertible senior notes due 2028 and retiring $175.0 million of convertible senior notes due 2023. We also returned approximately $24.1 million to our stockholders through our ongoing quarterly cash dividend and common stock repurchases.
• In May 2023, we closed a transaction resulting in the termination of our contractual gold payments obligation to ETFS Capital for $50.0 million in cash and Series C Preferred Stock convertible into approximately 13.1 million shares of our common stock. The value of these shares was $86.9 million based on the closing price of our common stock on May 9, 2023 of $6.64 per share. The Series C Preferred Stock was issued to Gold Bullion Holdings (Jersey) Limited, or GBH, a subsidiary of the World Gold Council, which was the entity that ultimately received a portion of the contractual gold payments the Company was previously obligated to make to ETFS Capital. The transaction expanded our operating margin by over 500 basis points, was accretive to earnings per share and reduced volatility in our financial results.
• In November 2023, we repurchased our Series C Preferred Stock, which was convertible into approximately 13.1 million shares of our common stock from GBH for aggregate cash consideration of approximately $84.4 million. Under the terms of the transaction, we paid GBH $40.0 million on the closing date, with the remainder of the purchase price payable in equal, interest-free installments on the first, second and third anniversaries of the closing date. The implied price per share was $6.02 when considering the interest-free financing element of the transaction, and the repurchase was also accretive to earnings per share.
44
• In the U.S., we were named a “2023 Best Places to Work in Money Management” by Pensions & Investments for the fourth consecutive year and seventh year since the award was created. We ranked second within the category for managers with 100-499 employees, the second consecutive year earning a ranking among the top five employers. In the U.K., we were also named Best Workplace for medium-sized companies for a fourth consecutive year and a 2023 Best Workplace for Women for medium-sized companies by Great Place to Work.
• We won “Best Leveraged & Inverse ETF Issuer ($100M+)” and “Best Crypto Issuer Linked ETF Issuer ($100M+)” at the 2023 ETF Express Europe Awards and our European business won “Best ETF Issuer” at the Online Money Awards, marking the second consecutive year of winning the award. The WisdomTree Siegel Strategic Value Index™, an index developed by Professor Jeremy Siegel, Senior Economist to WisdomTree, also won the FIA Index of the Year Award by Structured Retail Products.
Market Environment
The following chart reflects the annual returns of the broad-based equity indexes and gold prices over the last three years.
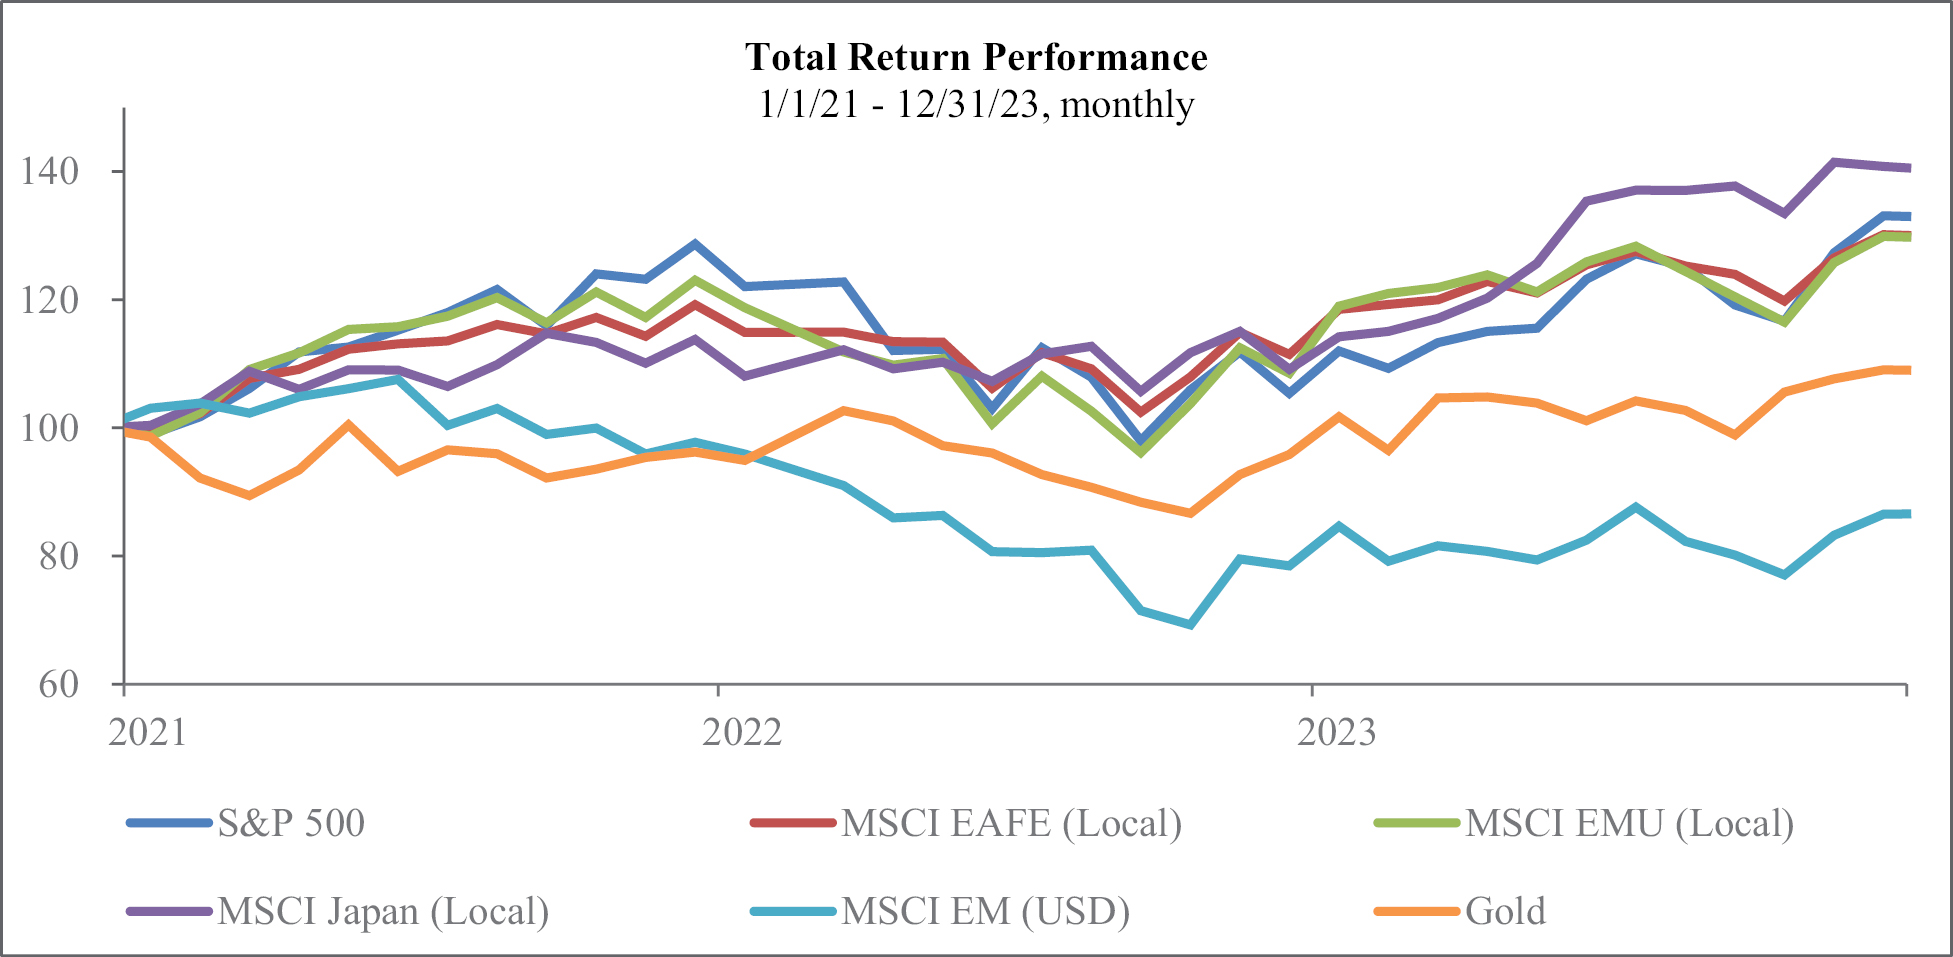
Source: FactSet
45
U.S. Listed ETF Industry Flows
U.S. listed ETF net flows for the year ended December 31, 2023 were $489.1 billion. U.S. equity and fixed income gathered the majority of those flows.
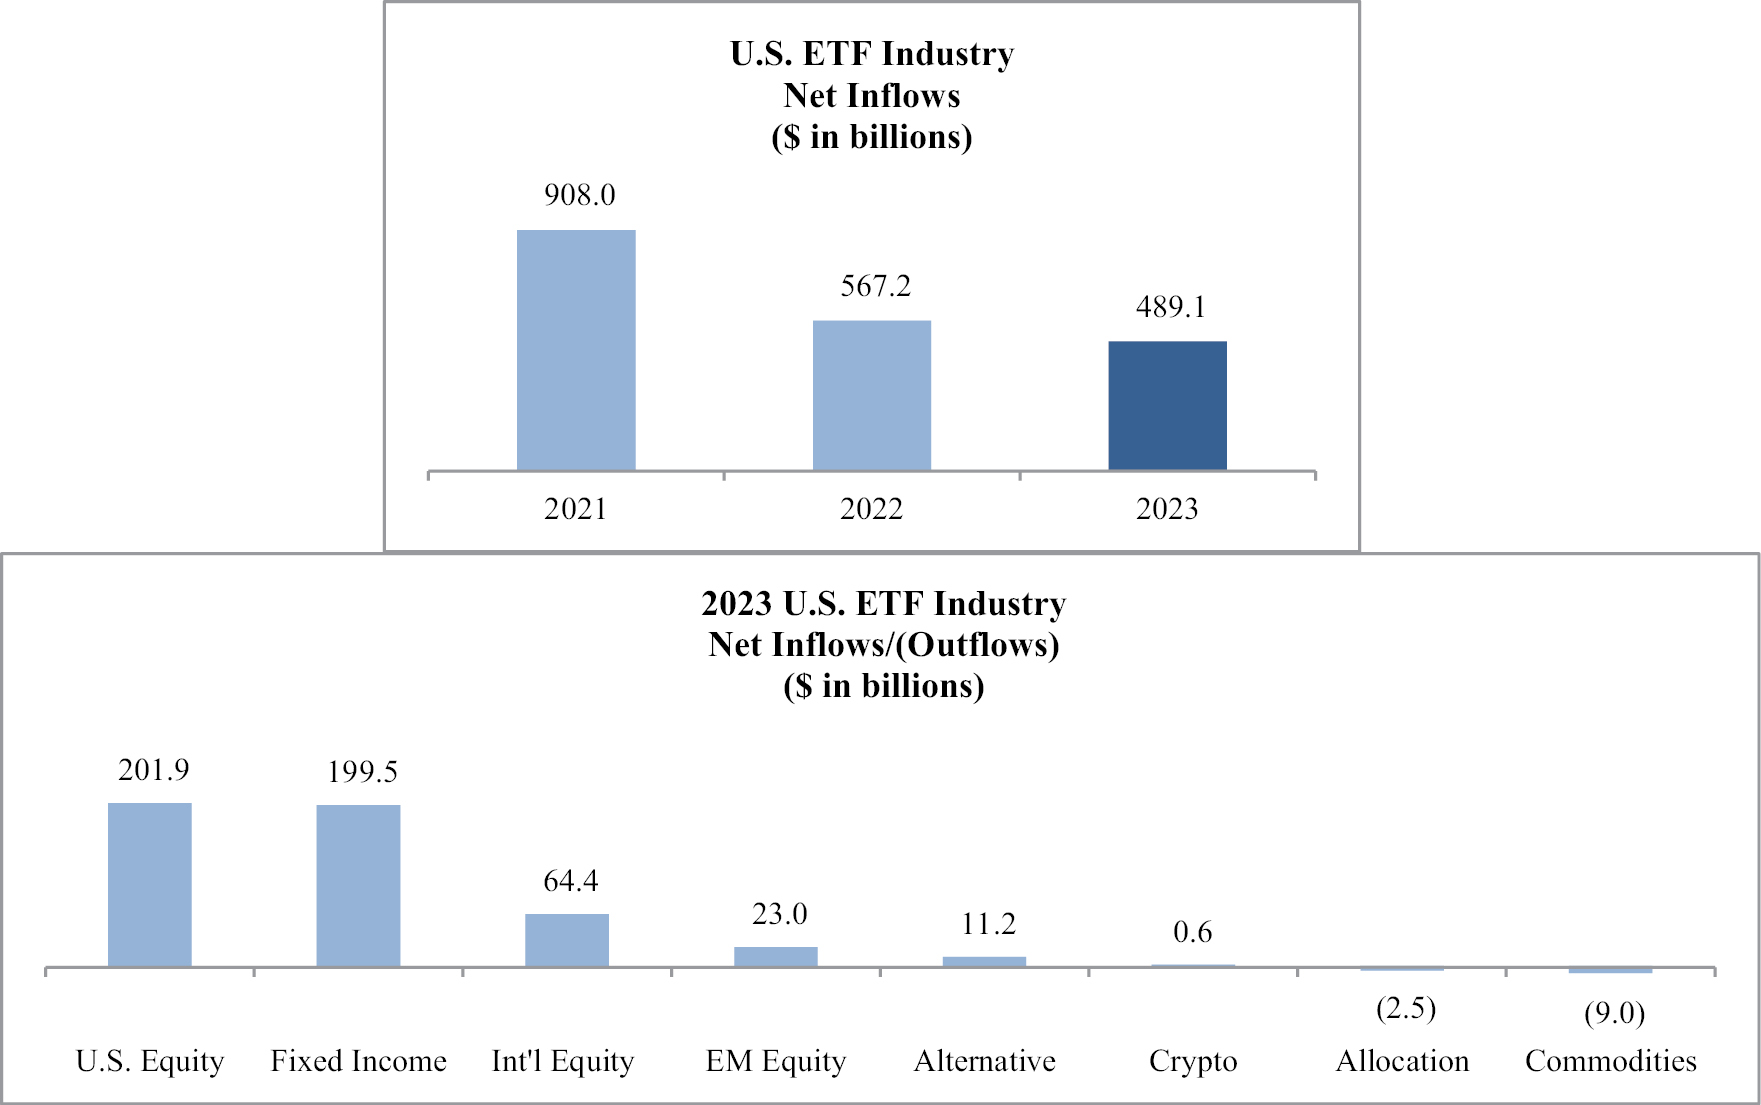
Source: Morningstar
European Listed ETP Industry Flows
European listed ETP net flows were $146.5 billion for the year ended December 31, 2023. Equities and fixed income gathered the majority of those flows.
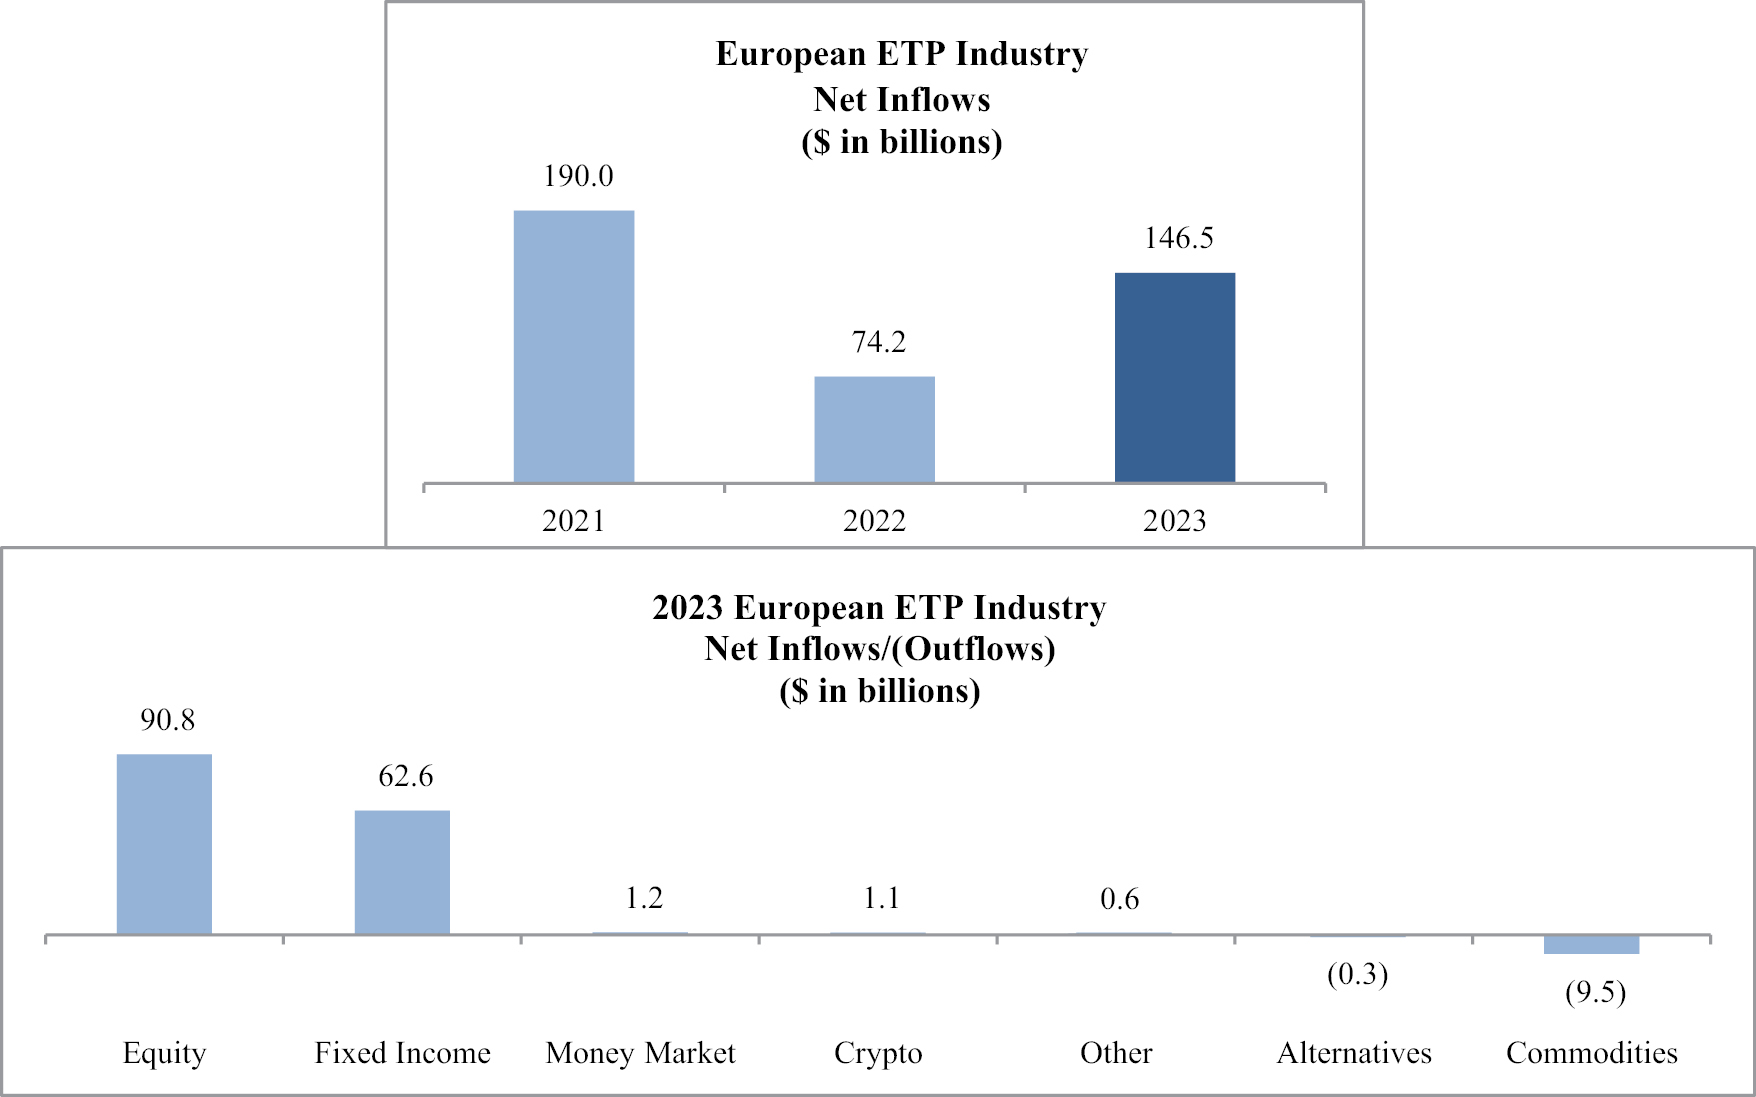
Source: Morningstar
46
Industry Developments
Asset Management – Consolidation
In the recent past, a number of acquisitions in the asset management industry have either been announced or completed. These trends have accelerated, as fee compression, cost pressures and increased regulations have weighed on the industry, highlighting the importance of scale and operating efficiency to compete in today’s market. We have significant opportunities ahead in both ETPs and the Portfolio Solutions business and as an early mover in digital assets and blockchain-enabled financial services, which positions us well for success to grow in this competitive landscape.
Components of Operating Revenue
Advisory fees
Substantially all of our revenues are comprised of advisory fees we earn from our ETPs. These advisory fees are calculated based on a percentage of the ETPs’ average daily net assets. As of the date of this Report, our weighted average fee rates by product category are as follows:
|
Commodity & Currency: |
37bps |
Leveraged & Inverse: |
84bps |
|||
|
International Developed Market Equity: |
49bps |
Fixed Income: |
16bps |
|||
|
U.S. Equity: |
31bps |
Alternatives: |
58bps |
|||
|
Emerging Market Equity: |
59bps |
Cryptocurrency: |
36bps |
We determine the appropriate advisory fee to charge for our ETPs based on the cost of operating each ETP considering the types of securities the ETPs will hold, fees third-party service providers will charge us for operating the ETPs and our competitors’ fees for similar ETPs. From time to time, we implement voluntary waivers of a portion of our advisory fee. In addition, we earn a fee based on daily aggregate AUM of our ETPs in exchange for bearing certain fund expenses.
Our advisory fee revenues may fluctuate based on general stock market trends, which include market value appreciation or depreciation, currency fluctuations against the U.S. dollar, increased competition and level of inflows or outflows from our ETPs.
Other income
Other income includes rebates from swap providers to our European listed ETPs, creation/redemption fees earned on our European non-UCITS products and fees from licensing our indexes to third parties.
Components of Operating Expenses
Our operating expenses consist primarily of costs related to selling, operating and marketing our ETPs as well as the infrastructure needed to run our business.
Compensation and benefits
Employee compensation and benefits expenses are expensed when incurred and include salaries, incentive compensation, and related benefit costs. To attract and retain qualified personnel, we must maintain competitive employee compensation and benefit plans and amounts we pay may be affected by inflation. Virtually all of our employees receive incentive compensation which is variable and will fluctuate taking into consideration our operating and financial results, as well as discretion.
Also included in compensation and benefits are costs related to equity awards granted to our employees. Our executive management and Board of Directors strongly believe that equity awards are an important part of our employees’ overall compensation package and that incentivizing our employees with equity in the Company aligns the interests of our employees with that of our stockholders. We use the fair value method in recording compensation expense for equity-based awards. Under the fair value method, compensation expense is measured at the grant date based on the estimated fair value of the award and is recognized as an expense over the vesting period.
47
Fund management and administration
Fund management and administration expenses are expensed when incurred and are comprised of the following costs we pay third-party service providers to operate our ETPs and Digital Funds:
• portfolio management of our ETPs (sub-advisory);
• fund accounting and administration;
• custodial and storage services;
• market making;
• transfer agency;
• accounting and tax services;
• printing and mailing of shareholder materials;
• index calculation;
• indicative values;
• distribution fees;
• legal and compliance services;
• exchange listing fees;
• trustee fees and expenses;
• preparation of regulatory reports and filings;
• insurance;
• certain local income taxes; and
• other administrative services.
We are not responsible for extraordinary expenses, taxes and certain other expenses related to the funds.
We depend on a number of parties to provide critical portfolio management services to our ETPs. The fees we pay our sub-advisers generally are the higher of the fixed minimums per fund, which range from $25,000 to $180,000 per year, or the percentage fee, which ranges between 0.01% and 0.50% per annum of average daily AUM at various breakpoint levels depending on the nature of the ETP. In addition, we pay certain costs based on transactions in our ETPs or based on inflow levels.
The fees we pay for accounting, tax, transfer agency, index calculation, indicative values and exchange listing are based on the number of ETPs we have. The remaining fees are based on a combination of both AUM and number of funds, or as incurred.
Marketing and advertising
Marketing and advertising expenses are recorded when incurred and include the following:
• advertising and product promotion campaigns that are initiated to promote our existing and new ETPs as well as brand awareness;
• development and maintenance of our website; and
• creation and preparation of marketing materials.
Our discretionary advertising comprises the largest portion of this expense. In addition, we may incur expenditures in certain periods to attract inflows, the benefit of which may or may not be recognized from increases to our AUM in future periods. However, due to the discretionary nature of some of these costs, they can generally be reduced if there were a decline in the markets.
Sales and business development
Sales and business development expenses are recorded when incurred and include the following:
• travel and entertainment or conference related expenses for our sales force;
• market data services for our research team;
• sales related software tools;
• voluntary payment of certain costs associated with the creation or redemption of ETP shares, as we may elect from time to time; and
• legal and other advisory fees associated with the development of new funds or business initiatives.
48
Contractual gold payments
Contractual gold payments expense represented an obligation requiring us to pay 9,500 ounces of gold annually from the advisory fee income we earned for managing physically backed gold ETPs. Our obligation to continue making these payments was terminated on May 10, 2023. See Note 9 to our Consolidated Financial Statements for additional information.
Professional fees
Professional fees are expensed when incurred and consist of fees we pay to corporate advisers including accountants, tax advisers, legal counsel, investment bankers, human resources or other consultants. Professional fees also include expenses we pay third-party service providers related to WisdomTree Prime and expenses incurred in response to an activist campaign. These expenses fluctuate based on our needs or requirements at the time. Certain of these costs are at our discretion and can fluctuate year to year.
Occupancy, communications and equipment
Occupancy, communications and equipment expense includes costs for our corporate headquarters in New York City as well as office related costs in our other locations.
Depreciation and amortization
Depreciation and amortization expense results from amortization of internally-developed software as well as depreciation on fixed assets, which are depreciated/amortized over three to five years.
Third-party distribution fees
Third-party distribution fees, which are expensed as incurred, include payments made to enable our products and models to be included on certain third-party platforms in exchange for commission-free trading or other preferential access. These expenses also include payments to our third-party marketing agents in Latin America and Israel.
Other
Other expenses consist primarily of insurance premiums, general office related expenses, securities license fees for our sales force, public company related expenses, corporate related travel and entertainment and Board of Director fees, including stock-based compensation related to equity awards we granted to our directors.
Components of Other Income/(Expenses) of a Recurring Nature
Interest expense
We recognize interest expense using the effective interest method which includes the amortization of discounts, premiums and issuance costs.
Revaluation/termination of deferred consideration–gold payments
Deferred consideration arose in connection with the ETFS Acquisition and was remeasured each reporting period using forward-looking gold prices observed on the CMX exchange, a selected discount rate and perpetual growth rate. This obligation was terminated on May 10, 2023 for approximately $137.0 million. See Note 9 to our Consolidated Financial Statements for additional information.
Interest income
Interest income, which is recognized on an accrual basis, arises from investing our corporate cash into interest-bearing financial instruments.
49
Other losses, net
Included herein are gains and losses arising from our financial instruments owned and investments, the sale of gold earned from advisory fees paid by physically-backed gold ETPs, foreign exchange and other miscellaneous items. Also included are losses arising from the release of tax-related indemnification assets upon the expiration of the statute of limitations, for which an equal and offsetting benefit is recognized in income tax expense.
Income Taxes
Our income tax expense consists of taxes due to federal, various state and local and certain foreign authorities.
Expense Guidance for the Year Ending December 31, 2024
Compensation Expense
Our compensation expense for the year ending December 31, 2024 is currently estimated to range from $108.0 million to $118.0 million and takes into consideration planned hires as well as year-end compensation adjustments and the annualization of hires made during 2023. The range also considers variability in incentive compensation with drivers including the magnitude of our flows, revenue and operating income growth, margin expansion and our share price performance in relation to our peers. A wide range is provided in consideration of uncertain market conditions.
Discretionary Spending
Discretionary spending includes marketing, sales, professional fees, occupancy and equipment, depreciation and amortization and other expenses. We currently estimate our discretionary spending for the year ending December 31, 2024 to range from $64.0 million to $68.0 million.
Not included in the guidance above are any potential non-recurring expenses we may incur in response to a potential proxy contest. Such expenses could be material to our results of operations for the year ending December 31, 2024.
Gross Margin
We define gross margin as total operating revenues less fund management and administration expenses. Gross margin percentage is calculated as gross margin divided by total operating revenues. For the year ending December 31, 2024, we currently estimate that our gross margin percentage will be 79.0% to 80.0% at current AUM and revenue levels. If AUM drives higher from continued organic flow growth or favorable market conditions, we would anticipate further gross margin expansion.
Third-Party Distribution Expense
We currently estimate third-party distribution expense to be approximately $10.0 million to $11.0 million for the year ending December 31, 2024, which is dependent upon the AUM growth on our respective platforms.
Income Tax Expense
We currently estimate that our consolidated normalized effective tax rate will be approximately 24.0% to 25.0% for the year ending December 31, 2024, a slight increase as compared to the year ended December 31, 2022 to account for the full year impact of the U.K. tax rate change to 25.0% that went into effect on April 1, 2023.
This estimated rate may change and is dependent upon our actual taxable income earned in relation to our forecasts as well as any other items which may arise that are not currently forecasted. Such items may include, but are not limited to, reductions in unrecognized tax benefits, increases or decreases in valuation allowances and any stock-based compensation windfalls or shortfalls. Additional corporate tax legislation could also impact our normalized effective tax rate.
50
Factors that May Impact our Future Financial Results
Our AUM is well diversified across the commodity, U.S. equity, international developed markets and emerging markets sectors. As a result, our operating results are particularly exposed to investor sentiment toward investing in these products’ strategies and our ability to maintain AUM of these products, as well as the performance of these products.
Our revenues are also highly correlated to the level and relative mix of our AUM, as well as the fee rate associated with our ETPs. Changes in product mix have led to a decline in our average advisory fee, which for the years ended December 31, 2021, 2022 and 2023 were 0.41%, 0.38% and 0.36%, respectively.
The chart below sets forth the asset mix of our ETPs at December 31, 2021, 2022 and 2023:
51
Key Operating Statistics
The following table presents key operating statistics that serve as indicators for the performance of our business:
|
Year Ended December 31, |
|||||||||
|
2023 |
2022 |
2021 |
|||||||
|
GLOBAL ETPs (in millions) |
|||||||||
|
Beginning of period assets |
$ |
81,993 |
$ |
77,479 |
$ |
67,392 |
|||
|
Inflows |
|
10,396 |
|
12,182 |
|
4,660 |
|||
|
Market appreciation/(depreciation) |
|
7,735 |
|
(7,668) |
|
5,427 |
|||
|
End of period assets |
$ |
100,124 |
$ |
81,993 |
$ |
77,479 |
|||
|
Average assets during the period |
$ |
92,847 |
$ |
76,969 |
$ |
73,430 |
|||
|
Average advisory fee during the period |
|
0.36% |
|
0.38% |
|
0.41% |
|||
|
Number of ETPs—end of the period |
|
337 |
|
339 |
|
329 |
|||
|
US LISTED ETFs (in millions) |
|
|
|
||||||
|
Beginning of period assets |
$ |
55,973 |
$ |
48,210 |
$ |
38,517 |
|||
|
Inflows |
|
10,795 |
|
14,572 |
|
4,950 |
|||
|
Market appreciation/(depreciation) |
|
5,718 |
|
(6,809) |
|
4,743 |
|||
|
End of period assets |
$ |
72,486 |
$ |
55,973 |
$ |
48,210 |
|||
|
Average assets during the period |
$ |
64,967 |
$ |
49,723 |
$ |
44,325 |
|||
|
Number of ETPs—end of the period |
|
76 |
|
79 |
|
75 |
|||
|
EUROPEAN LISTED ETPs (in millions) |
|
|
|
||||||
|
Beginning of period assets |
$ |
26,020 |
$ |
29,269 |
$ |
28,875 |
|||
|
Outflows |
|
(399) |
|
(2,390) |
|
(290) |
|||
|
Market appreciation/(depreciation) |
|
2,017 |
|
(859) |
|
684 |
|||
|
End of period assets |
$ |
27,638 |
$ |
26,020 |
$ |
29,269 |
|||
|
Average assets during the period |
$ |
27,880 |
$ |
27,246 |
$ |
29,105 |
|||
|
Number of ETPs—end of the period |
|
261 |
|
260 |
|
254 |
|||
|
PRODUCT CATEGORIES (in millions) |
|
|
|
||||||
|
U.S. Equity |
|
|
|
||||||
|
Beginning of period assets |
$ |
24,112 |
$ |
23,860 |
$ |
18,367 |
|||
|
Inflows |
|
1,616 |
|
3,346 |
|
1,544 |
|||
|
Market appreciation/(depreciation) |
|
3,428 |
|
(3,094) |
|
3,949 |
|||
|
End of period assets |
$ |
29,156 |
$ |
24,112 |
$ |
23,860 |
|||
|
Average assets during the period |
$ |
25,701 |
$ |
22,881 |
$ |
21,254 |
|||
|
Commodity & Currency |
|
|
|
||||||
|
Beginning of period assets |
$ |
22,097 |
$ |
24,599 |
$ |
25,879 |
|||
|
Outflows |
|
(1,774) |
|
(2,912) |
|
(1,479) |
|||
|
Market appreciation |
|
1,013 |
|
410 |
|
199 |
|||
|
End of period assets |
$ |
21,336 |
$ |
22,097 |
$ |
24,599 |
|||
|
Average assets during the period |
$ |
22,843 |
$ |
23,406 |
$ |
25,027 |
|||
|
Fixed Income |
|
|
|
||||||
|
Beginning of period assets |
$ |
15,273 |
$ |
4,356 |
$ |
3,324 |
|||
|
Inflows |
|
5,940 |
|
11,300 |
|
1,130 |
|||
|
Market depreciation |
|
(16) |
|
(383) |
|
(98) |
|||
|
End of period assets |
$ |
21,197 |
$ |
15,273 |
$ |
4,356 |
|||
|
Average assets during the period |
$ |
19,804 |
$ |
9,039 |
$ |
3,565 |
|||
52
|
Year Ended December 31, |
|||||||||
|
2023 |
2022 |
2021 |
|||||||
|
International Developed Market Equity |
|||||||||
|
Beginning of period assets |
$ |
10,195 |
$ |
11,894 |
$ |
9,414 |
|||
|
Inflows |
|
2,850 |
|
101 |
|
1,260 |
|||
|
Market appreciation/(depreciation) |
|
2,058 |
|
(1,800) |
|
1,220 |
|||
|
End of period assets |
$ |
15,103 |
$ |
10,195 |
$ |
11,894 |
|||
|
Average assets during the period |
$ |
12,824 |
$ |
10,568 |
$ |
10,750 |
|||
|
Emerging Market Equity |
|
|
|
||||||
|
Beginning of period assets |
$ |
8,116 |
$ |
10,375 |
$ |
8,539 |
|||
|
Inflows |
|
1,678 |
|
27 |
|
2,041 |
|||
|
Market appreciation/(depreciation) |
|
932 |
|
(2,286) |
|
(205) |
|||
|
End of period assets |
$ |
10,726 |
$ |
8,116 |
$ |
10,375 |
|||
|
Average assets during the period |
$ |
9,287 |
$ |
8,843 |
$ |
10,619 |
|||
|
Leveraged & Inverse |
|
|
|
||||||
|
Beginning of period assets |
$ |
1,754 |
$ |
1,777 |
$ |
1,486 |
|||
|
(Outflows)/inflows |
|
(5) |
|
193 |
|
41 |
|||
|
Market appreciation/(depreciation) |
|
66 |
|
(216) |
|
250 |
|||
|
End of period assets |
$ |
1,815 |
$ |
1,754 |
$ |
1,777 |
|||
|
Average assets during the period |
$ |
1,813 |
$ |
1,704 |
$ |
1,679 |
|||
|
Cryptocurrency |
|
|
|
||||||
|
Beginning of period assets |
$ |
136 |
$ |
357 |
$ |
168 |
|||
|
Inflows |
|
50 |
|
36 |
|
84 |
|||
|
Market appreciation/(depreciation) |
|
228 |
|
(257) |
|
105 |
|||
|
End of period assets |
$ |
414 |
$ |
136 |
$ |
357 |
|||
|
Average assets during the period |
$ |
247 |
$ |
230 |
$ |
312 |
|||
|
Alternatives |
|
|
|
||||||
|
Beginning of period assets |
$ |
310 |
$ |
261 |
$ |
215 |
|||
|
Inflows |
|
41 |
|
91 |
|
39 |
|||
|
Market appreciation/(depreciation) |
|
26 |
|
(42) |
|
7 |
|||
|
End of period assets |
$ |
377 |
$ |
310 |
$ |
261 |
|||
|
Average assets during the period |
$ |
328 |
$ |
298 |
$ |
224 |
|||
|
Headcount |
|
303 |
|
273 |
|
241 |
|||
Note: Previously issued statistics may be restated due to fund closures and trade adjustments
Source: WisdomTree
Year Ended December 31, 2023 Compared to Year Ended December 31, 2022
Selected Operating and Financial Information
|
Year Ended |
Change |
Percent |
|||||||||
|
2023 |
2022 |
||||||||||
|
AUM (in millions) |
|||||||||||
|
Average AUM |
$ |
92,847 |
$ |
76,969 |
$ |
15,878 |
20.6% |
||||
|
Operating Revenues (in thousands) |
|
|
|
||||||||
|
Advisory fees |
$ |
333,227 |
$ |
293,632 |
$ |
39,595 |
13.5% |
||||
|
Other income |
|
15,808 |
|
7,713 |
|
8,095 |
105.0% |
||||
|
Total revenues |
$ |
349,035 |
$ |
301,345 |
$ |
47,690 |
15.8% |
||||
53
Operating Revenues
Advisory fees
Advisory fee revenues increased 13.5% from $293.6 million during the year ended December 31, 2022 to $333.2 million during the year ended December 31, 2023 as higher average AUM was partially offset by a decline in our average advisory fee. Our average advisory fee declined from 0.38% during the year ended December 31, 2022 to 0.36% during the year ended December 31, 2023.
Other income
Other income increased 105.0% from $7.7 million during the year ended December 31, 2022 to $15.8 million during the year ended December 31, 2023 primarily due to large flows from some of our European products.
Operating Expenses
|
(in thousands) |
Year Ended |
Change |
Percent |
||||||||
|
2023 |
2022 |
||||||||||
|
Compensation and benefits |
$ |
109,532 |
$ |
97,897 |
$ |
11,635 |
11.9% |
||||
|
Fund management and administration |
|
71,348 |
|
64,761 |
|
6,587 |
10.2% |
||||
|
Marketing and advertising |
|
17,256 |
|
15,302 |
|
1,954 |
12.8% |
||||
|
Sales and business development |
|
13,584 |
|
11,871 |
|
1,713 |
14.4% |
||||
|
Contractual gold payments |
|
6,069 |
|
17,108 |
|
(11,039) |
(64.5%) |
||||
|
Professional fees |
|
18,969 |
|
13,800 |
|
5,169 |
37.5% |
||||
|
Occupancy, communications and equipment |
|
4,684 |
|
3,898 |
|
786 |
20.2% |
||||
|
Depreciation and amortization |
|
872 |
|
262 |
|
610 |
232.8% |
||||
|
Third-party distribution fees |
|
9,377 |
|
7,656 |
|
1,721 |
22.5% |
||||
|
Other |
|
9,852 |
|
8,705 |
|
1,147 |
13.2% |
||||
|
Total operating expenses |
$ |
261,543 |
$ |
241,260 |
$ |
20,283 |
8.4% |
||||
|
As a Percent of Revenues: |
Year Ended |
|||
|
2023 |
2022 |
|||
|
Compensation and benefits |
31.6% |
32.5% |
||
|
Fund management and administration |
20.4% |
21.5% |
||
|
Marketing and advertising |
4.9% |
5.1% |
||
|
Sales and business development |
3.9% |
3.9% |
||
|
Contractual gold payments |
1.7% |
5.7% |
||
|
Professional fees |
5.4% |
4.6% |
||
|
Occupancy, communications and equipment |
1.3% |
1.3% |
||
|
Depreciation and amortization |
0.2% |
0.1% |
||
|
Third-party distribution fees |
2.7% |
2.5% |
||
|
Other |
2.8% |
2.9% |
||
|
Total operating expenses |
74.9% |
80.1% |
||
Compensation and benefits
Compensation and benefits expense increased 11.9% from $97.9 million during the year ended December 31, 2022 to $109.5 million during the year ended December 31, 2023 due to higher stock-based compensation and headcount. Headcount was 273 and 303 at December 31, 2022 and 2023, respectively.
54
Fund management and administration
Fund management and administration expense increased 10.2% from $64.8 million during the year ended December 31, 2022 to $71.3 million during the year ended December 31, 2023 primarily due to higher average AUM and inflows. We had 79 U.S. listed ETFs and 260 European listed ETPs at December 31, 2022 compared to 76 U.S. listed ETFs and 261 European listed ETPs at December 31, 2023.
Marketing and advertising
Marketing and advertising expense increased 12.8% from $15.3 million during the year ended December 31, 2022 to $17.3 million during the year ended December 31, 2023 primarily resulting from higher spending related to our U.S. listed products.
Sales and business development
Sales and business development expense increased 14.4% from $11.9 million during the year ended December 31, 2022 to $13.6 million during the year ended December 31, 2023 primarily resulting from increases in travel and events spending.
Contractual gold payments
Contractual gold payments expense decreased 64.5% from $17.1 million during the year ended December 31, 2022 to $6.1 million during the year ended December 31, 2023 due to the termination of our deferred consideration—gold payments obligation on May 10, 2023. See Note 9 to our Consolidated Financial Statements for additional information.
Professional fees
Professional fees increased 37.5% from $13.8 million during the year ended December 31, 2022 to $19.0 million during the year ended December 31, 2023 due to higher expenses related to our digital assets business, as well as expenses incurred to terminate our deferred consideration—gold payments obligation and higher expenses related to an activist campaign.
Occupancy, communications and equipment
Occupancy, communications and equipment expense increased 20.2% from $3.9 million during the year ended December 31, 2022 to $4.7 million during the year ended December 31, 2023 as our New York office lease became effective in May 2022.
Depreciation and amortization
Depreciation and amortization expense increased 232.8% from $0.3 million during the year ended December 31, 2022 to $0.9 million during the year ended December 31, 2023 due to amortization of software development costs.
Third-party distribution fees
Third-party distribution fees increased 22.5% from $7.7 million during the year ended December 31, 2022 to $9.4 million during the year ended December 31, 2023 primarily due to AUM growth we are experiencing in Latin America.
Other
Other expenses increased 13.2% from $8.7 million during the year ended December 31, 2022 to $9.9 million during the year ended December 31, 2023 primarily due to higher travel, public relations and Board of Directors expenses.
55
Other Income/(Expenses)
|
(in thousands) |
Year Ended |
Change |
Percent |
||||||||
|
2023 |
2022 |
||||||||||
|
Interest expense |
$ |
(15,242) |
$ |
(14,935) |
$ |
(307) |
2.1% |
||||
|
Gain on revaluation/termination of deferred consideration—gold payments |
|
61,953 |
|
27,765 |
|
34,188 |
123.1% |
||||
|
Interest income |
|
4,099 |
|
3,320 |
|
779 |
23.5% |
||||
|
Impairments |
|
(7,942) |
|
— |
|
(7,942) |
n/a |
||||
|
Loss on extinguishment of convertible notes |
|
(9,721) |
|
— |
|
(9,721) |
n/a |
||||
|
Other losses, net |
|
(1,631) |
|
(36,285) |
|
34,654 |
95.5% |
||||
|
Total other income/(expenses), net |
$ |
31,516 |
$ |
(20,135) |
$ |
51,651 |
256.5% |
||||
|
As a Percent of Revenues: |
Year Ended |
|||
|
2023 |
2022 |
|||
|
Interest expense |
(4.4%) |
(5.0%) |
||
|
Gain on revaluation/termination of deferred consideration—gold payments |
17.8% |
9.2% |
||
|
Interest income |
1.2% |
1.1% |
||
|
Impairments |
(2.3%) |
— |
||
|
Loss on extinguishment of convertible notes |
(2.8%) |
— |
||
|
Other losses, net |
(0.5%) |
(12.0%) |
||
|
Total other income/(expenses), net |
9.0% |
(6.7%) |
||
Interest expense
Interest expense was essentially unchanged during the year ended December 31, 2023.
Our effective interest rate on our outstanding convertible notes during the years ended December 31, 2022 and 2023 was 4.6% and 4.9%, respectively.
Gain on revaluation/termination of deferred consideration
We recognized a gain on revaluation/termination of deferred consideration—gold payments of $27.8 million and $62.0 million during the years ended December 31, 2022 and 2023, respectively. This obligation was terminated on May 10, 2023 for approximately $137.0 million. See Note 9 to our Consolidated Financial Statements for additional information.
Interest income
Interest income increased 23.5% from $3.3 million during the year ended December 31, 2022 to $4.1 million during the year ended December 31, 2023 due to rising interest rates, partially offset by a decrease in our interest-bearing assets.
Impairments
During the year ended December 31, 2023, we recognized a non-cash impairment charge of $7.9 million primarily related to our investment in Securrency, Inc. upon the sale of Securrency, Inc. to an unrelated third party. (See Notes 7, 8, 13 and 26 to our Consolidated Financial Statements).
Other losses, net
Other losses, net were $36.3 million and $1.6 million during the years ended December 31, 2022 and 2023, respectively. This includes a charge of $19.9 million and $1.4 million during the years ended December 31, 2022 and 2023, respectively, arising from the release of a tax-related indemnification asset upon the expiration of the statute of limitations. An equal and offsetting benefit has been recognized in income tax expense. During the years ended December 31, 2022 and 2023, we also recognized losses on our financial instruments owned and investments of $16.9 million and $0.7 million, respectively. Gains and losses also generally arise from the sale of gold earned from advisory fees paid by our physically-backed gold ETPs, foreign exchange fluctuations and other miscellaneous items.
56
Income Taxes
Our effective income tax rate for 2023 was 13.8%, resulting in income tax expense of $16.5 million. The effective tax rate differs from the federal statutory rate of 21% primarily due to a non-taxable gain on revaluation/termination of deferred consideration, a reduction in unrecognized tax benefits associated with the release of the tax-related indemnification asset described above and a lower tax rate on foreign earnings. These items were partly offset by a non-deductible loss on extinguishment of our 4.25% Convertible Senior Notes due 2023 during the first quarter of 2023, an increase in the deferred tax asset valuation allowance on losses recognized on our investments and non-deductible executive compensation.
Our effective income tax rate for the year ended December 31, 2022 was negative 26.9%, resulting in an income tax benefit of $10.7 million. Our tax rate differs from the federal statutory rate of 21% primarily due to a $19.9 million reduction in unrecognized tax benefits associated with the release of the tax-related indemnification asset described above, a reduction in the valuation allowance on foreign net operating losses, a non-taxable gain on revaluation of deferred consideration and a lower tax rate on foreign earnings. These items were partly offset by an increase in the deferred tax asset valuation allowance on losses recognized on financial instruments owned.
Year Ended December 31, 2022 Compared to Year Ended December 31, 2021
Selected Operating and Financial Information
|
Year Ended |
Change |
Percent |
|||||||||
|
2022 |
2021 |
||||||||||
|
AUM (in millions) |
|||||||||||
|
Average AUM |
$ |
76,969 |
$ |
73,430 |
$ |
3,539 |
4.8% |
||||
|
Operating Revenues (in thousands) |
|
|
|
||||||||
|
Advisory fees |
$ |
293,632 |
$ |
298,052 |
$ |
(4,420) |
(1.5%) |
||||
|
Other income |
|
7,713 |
|
6,266 |
|
1,447 |
23.1% |
||||
|
Total revenues |
$ |
301,345 |
$ |
304,318 |
$ |
(2,973) |
(1.0%) |
||||
Operating Revenues
Advisory fees
Advisory fee revenues decreased 1.5% from $298.1 million during the year ended December 31, 2021 to $293.6 million in the comparable period in 2022 as higher average AUM was offset by a decline in our average advisory fee. Our average advisory fee decreased from 0.41% during the year ended December 31, 2021 to 0.38% during the year ended December 31, 2022 due to AUM mix shift.
Other income
Other income increased 23.1% from $6.3 million during the year ended December 31, 2021 to $7.7 million in the comparable period in 2022 primarily due to higher fees associated with our European listed products.
57
Operating Expenses
|
(in thousands) |
Year Ended |
Change |
Percent |
||||||||
|
2022 |
2021 |
||||||||||
|
Compensation and benefits |
$ |
97,897 |
$ |
88,163 |
$ |
9,734 |
11.0% |
||||
|
Fund management and administration |
|
64,761 |
|
58,912 |
|
5,849 |
9.9% |
||||
|
Marketing and advertising |
|
15,302 |
|
14,090 |
|
1,212 |
8.6% |
||||
|
Sales and business development |
|
11,871 |
|
9,907 |
|
1,964 |
19.8% |
||||
|
Contractual gold payments |
|
17,108 |
|
17,096 |
|
12 |
0.1% |
||||
|
Professional fees |
|
13,800 |
|
7,616 |
|
6,184 |
81.2% |
||||
|
Occupancy, communications and equipment |
|
3,898 |
|
4,629 |
|
(731) |
(15.8%) |
||||
|
Depreciation and amortization |
|
262 |
|
738 |
|
(476) |
(64.5%) |
||||
|
Third-party distribution fees |
|
7,656 |
|
7,176 |
|
480 |
6.7% |
||||
|
Other |
|
8,705 |
|
6,933 |
|
1,772 |
25.6% |
||||
|
Total operating expenses |
$ |
241,260 |
$ |
215,260 |
$ |
26,000 |
12.1% |
||||
|
As a Percent of Revenues: |
Year Ended |
|||
|
2022 |
2021 |
|||
|
Compensation and benefits |
32.5% |
28.9% |
||
|
Fund management and administration |
21.5% |
19.4% |
||
|
Marketing and advertising |
5.1% |
4.6% |
||
|
Sales and business development |
3.9% |
3.3% |
||
|
Contractual gold payments |
5.7% |
5.6% |
||
|
Professional fees |
4.6% |
2.5% |
||
|
Occupancy, communications and equipment |
1.3% |
1.5% |
||
|
Depreciation and amortization |
0.1% |
0.2% |
||
|
Third-party distribution fees |
2.5% |
2.4% |
||
|
Other |
2.9% |
2.3% |
||
|
Total operating expenses |
80.1% |
70.7% |
||
Compensation and benefits
Compensation and benefits expense increased 11.0% from $88.2 million during the year ended December 31, 2021 to $97.9 million in the comparable period in 2022 due to higher incentive compensation and headcount. Headcount was 241 and 273 at December 31, 2021 and 2022, respectively.
Fund management and administration
Fund management and administration expense increased 9.9% from $58.9 million during the year ended December 31, 2021 to $64.8 million in the comparable period in 2022 primarily due to higher average AUM, product launches and inflows. We had 75 U.S. listed ETFs and 254 European listed ETPs at December 31, 2021 compared to 79 U.S. listed ETFs and 269 European listed ETPs at December 31, 2022.
Marketing and advertising
Marketing and advertising expense increased 8.6% from $14.1 million during the year ended December 31, 2021 to $15.3 million in the comparable period in 2022 primarily resulting from an increase in online and television advertising.
Sales and business development
Sales and business development expense increased 19.8% from $9.9 million during the year ended December 31, 2021 to $11.9 million in the comparable period in 2022 primarily resulting from increases in conference and events spending as well as market data costs.
58
Contractual gold payments
Contractual gold payments expense was essentially unchanged from the year ended December 31, 2021. This expense was associated with the annual payment of 9,500 ounces of gold and was calculated using the average daily spot price of $1,800 per ounce during the years ended December 31, 2021 and 2022, respectively.
Professional fees
Professional fees increased 81.2% from $7.6 million during the year ended December 31, 2021 to $13.8 million in the comparable period in 2022 due to $4.5 million incurred in response to an activist campaign and spending related to our digital assets business.
Occupancy, communications and equipment
Occupancy, communications and equipment expense decreased 15.8% from $4.6 million during the year ended December 31, 2021 to $3.9 million in the comparable period in 2022 as we reduced our office footprint in the U.S. and Europe.
Depreciation and amortization
Depreciation and amortization expense decreased 64.5% from $0.7 million during the year ended December 31, 2021 to $0.3 million in the comparable period in 2022 as we reduced our office footprint in the U.S. and Europe.
Third-party distribution fees
Third-party distribution fees increased 6.7% from $7.2 million during the year ended December 31, 2021 to $7.7 million in the comparable period in 2022 primarily due to new platform relationships in Europe and higher U.S. listed AUM on third-party platforms, partly offset by lower fees paid to our third-party marketing agent in Latin America.
Other
Other expenses increased 25.6% from $6.9 million during the year ended December 31, 2021 to $8.7 million in the comparable period in 2022 primarily due to higher insurance, public company compliance, travel and directors expenses.
Other Income/(Expenses)
|
Year Ended |
Change |
Percent |
|||||||||
|
(in thousands) |
2022 |
2021 |
|||||||||
|
Interest expense |
$ |
(14,935) |
$ |
(12,332) |
$ |
(2,603) |
21.1% |
||||
|
Gain on revaluation/termination of deferred consideration—gold payments |
|
27,765 |
|
2,018 |
|
25,747 |
1,275.9% |
||||
|
Interest income |
|
3,320 |
|
2,009 |
|
1,311 |
65.3% |
||||
|
Impairments |
|
— |
|
(16,156) |
|
16,156 |
n/a |
||||
|
Other losses, net |
|
(36,285) |
|
(7,926) |
|
(28,359) |
357.8% |
||||
|
Total other expenses, net |
$ |
(20,135) |
$ |
(32,387) |
$ |
12,252 |
(37.8%) |
||||
|
As a Percent of Revenues: |
Year Ended |
|||
|
2022 |
2021 |
|||
|
Interest expense |
(5.0%) |
(4.1%) |
||
|
Gain on revaluation/termination of deferred consideration—gold payments |
9.2% |
0.7% |
||
|
Interest income |
1.1% |
0.7% |
||
|
Impairments |
— |
(5.3%) |
||
|
Other losses, net |
(12.0%) |
(2.6%) |
||
|
Total other expenses, net |
(6.7%) |
(10.6%) |
||
59
Interest expense
Interest expense increased 21.1% from $12.3 million during the year ended December 31, 2021 to $14.9 million in the comparable period in 2022 due to a higher level of debt outstanding in the current period. Our effective interest rate was 4.6% during the years ended December 31, 2021 and 2022.
Gain on revaluation/termination of deferred consideration
We recognized a gain on revaluation/termination of deferred consideration—gold payments of $2.0 million and $27.8 million during the years ended December 31, 2021 and 2022, respectively. The gain was primarily due to an increase in the discount rate (from 9.0% to 11.0%) used to compute the present value of the annual payment obligations as well as a steepening of the forward-looking gold curve. The magnitude of any gain or loss is highly correlated to changes in the discount rate and the magnitude of the change in the forward-looking price of gold.
Interest income
Interest income increased 65.3% from $2.0 million during the year ended December 31, 2021 to $3.3 million in the comparable period in 2022 due to an increase in our interest-bearing assets.
Impairments
During the year ended December 31, 2021, we recognized impairment charges totaling $16.2 million, including a loss of $9.3 million upon the termination of the lease of our former principal executive office at 245 Park Avenue, New York, New York, $6.6 million related to the write-off of leasehold improvements and fixed assets associated with our former New York office and $0.3 million upon exiting our London office (See Notes 7, 8, 13 and 26 to our Consolidated Financial Statements).
Other losses, net
Other losses, net were ($7.9) million and ($36.3) million during the years ended December 31, 2021 and 2022, respectively. This includes a charge of $5.2 million and $19.9 million during the years ended December 31, 2021 and 2022, respectively, arising from the release of a tax-related indemnification asset upon the expiration of the statute of limitations. An equal and offsetting benefit has been recognized in income tax expense. During the year ended December 31, 2021 and 2022, we also recognized losses on our financial instruments owned of $3.7 million and $16.5 million, respectively. In addition, during the year ended December 31, 2021, we recognized a gain of $0.8 million related to the remeasurement of contingent consideration payable to us from the sale of our former Canadian ETF business.
Gains and losses also generally arise from the sale of gold earned from advisory fees paid by our physically-backed gold ETPs, foreign exchange fluctuations and other miscellaneous items.
Income Taxes
Our effective income tax rate for the year ended December 31, 2022 was negative 26.9%, resulting in an income tax benefit of $10.7 million. Our tax rate differs from the federal statutory rate of 21% primarily due to a $19.9 million reduction in unrecognized tax benefits associated with the release of the tax-related indemnification asset described above, a reduction in the valuation allowance on foreign net operating losses, a non-taxable gain on revaluation of deferred consideration and a lower tax rate on foreign earnings. These items were partly offset by an increase in the deferred tax asset valuation allowance on losses recognized on financial instruments owned.
Our effective income tax rate for the year ended December 31, 2021 of 12.1% resulted in income tax expense of $6.9 million. Our effective income tax rate differs from the federal statutory rate of 21% primarily due to a $5.2 million reduction in unrecognized tax benefits and a lower tax rate on foreign earnings. These items were partly offset by tax shortfalls associated with the vesting and exercise of stock-based compensation and non-deductible executive compensation.
60
Quarterly Results
The following tables set forth our unaudited consolidated quarterly statement of operations data, both in dollar amounts and as a percentage of total revenues, and our unaudited consolidated quarterly operating data for the quarters in 2023 and 2022. In our opinion, this unaudited information has been prepared on substantially the same basis as the consolidated financial statements appearing elsewhere in this Report and includes all adjustments (consisting of normal recurring adjustments) necessary for a fair statement of the unaudited consolidated quarterly data. The unaudited consolidated quarterly data should be read together with the consolidated financial statements and related notes included elsewhere in this Report. The results for any quarter are not necessarily indicative of results for any future period, and you should not rely on them as such.
|
(in thousands, except per share amounts) |
Q4/23 |
Q3/23 |
Q2/23 |
Q1/23 |
Q4/22 |
Q3/22 |
Q2/22 |
Q1/22 |
||||||||||||||||
|
Operating Revenues: |
||||||||||||||||||||||||
|
Advisory fees |
$ |
86,988 |
$ |
86,598 |
$ |
82,004 |
$ |
77,637 |
$ |
70,913 |
$ |
70,616 |
$ |
75,586 |
$ |
76,517 |
||||||||
|
Other income |
|
3,856 |
|
3,825 |
|
3,720 |
|
4,407 |
|
2,397 |
|
1,798 |
|
1,667 |
|
1,851 |
||||||||
|
Total revenues |
|
90,844 |
|
90,423 |
|
85,724 |
|
82,044 |
|
73,310 |
|
72,414 |
|
77,253 |
|
78,368 |
||||||||
|
Operating Expenses: |
|
|
|
|
|
|
|
|
||||||||||||||||
|
Compensation and benefits |
|
27,860 |
|
27,955 |
|
26,319 |
|
27,398 |
|
24,831 |
|
23,714 |
|
24,565 |
|
24,787 |
||||||||
|
Fund management and administration |
|
18,445 |
|
18,023 |
|
17,727 |
|
17,153 |
|
16,906 |
|
16,285 |
|
16,076 |
|
15,494 |
||||||||
|
Marketing and advertising |
|
4,951 |
|
3,833 |
|
4,465 |
|
4,007 |
|
4,240 |
|
3,145 |
|
3,894 |
|
4,023 |
||||||||
|
Sales and business development |
|
3,881 |
|
3,383 |
|
3,326 |
|
2,994 |
|
3,407 |
|
2,724 |
|
3,131 |
|
2,609 |
||||||||
|
Contractual gold payments |
|
— |
|
— |
|
1,583 |
|
4,486 |
|
4,107 |
|
4,105 |
|
4,446 |
|
4,450 |
||||||||
|
Professional fees |
|
3,201 |
|
3,719 |
|
8,334 |
|
3,715 |
|
2,666 |
|
2,367 |
|
4,308 |
|
4,459 |
||||||||
|
Occupancy, communications and equipment |
|
1,208 |
|
1,203 |
|
1,172 |
|
1,101 |
|
1,110 |
|
986 |
|
1,049 |
|
753 |
||||||||
|
Depreciation and amortization |
|
335 |
|
307 |
|
121 |
|
109 |
|
104 |
|
58 |
|
53 |
|
47 |
||||||||
|
Third-party distribution fees |
|
2,549 |
|
2,694 |
|
1,881 |
|
2,253 |
|
1,793 |
|
1,833 |
|
1,818 |
|
2,212 |
||||||||
|
Other |
|
2,379 |
|
2,601 |
|
2,615 |
|
2,257 |
|
2,427 |
|
2,324 |
|
2,109 |
|
1,845 |
||||||||
|
Total operating expenses |
|
64,809 |
|
63,718 |
|
67,543 |
|
65,473 |
|
61,591 |
|
57,541 |
|
61,449 |
|
60,679 |
||||||||
|
Operating income |
|
26,035 |
|
26,705 |
|
18,181 |
|
16,571 |
|
11,719 |
|
14,873 |
|
15,804 |
|
17,689 |
||||||||
|
Other Income/(Expenses): |
|
|
|
|
|
|
|
|
||||||||||||||||
|
Interest expense |
|
(3,758) |
|
(3,461) |
|
(4,021) |
|
(4,002) |
|
(3,736) |
|
(3,734) |
|
(3,733) |
|
(3,732) |
||||||||
|
Gain/(loss) on revaluation/termination of deferred consideration |
|
— |
|
— |
|
41,361 |
|
20,592 |
|
(35,423) |
|
77,895 |
|
2,311 |
|
(17,018) |
||||||||
|
Interest income |
|
1,225 |
|
791 |
|
1,000 |
|
1,083 |
|
945 |
|
811 |
|
770 |
|
794 |
||||||||
|
Impairments |
|
(339) |
|
(2,703) |
|
— |
|
(4,900) |
|
— |
|
— |
|
— |
|
— |
||||||||
|
Loss on extinguishment of convertible notes |
|
— |
|
— |
|
— |
|
(9,721) |
|
— |
|
— |
|
— |
|
— |
||||||||
|
Other gains and losses, net |
|
1,602 |
|
(2,512) |
|
1,286 |
|
(2,007) |
|
(1,815) |
|
(5,289) |
|
(4,474) |
|
(24,707) |
||||||||
|
Income/(loss) before income taxes |
|
24,765 |
|
18,820 |
|
57,807 |
|
17,616 |
|
(28,310) |
|
84,556 |
|
10,678 |
|
(26,974) |
||||||||
|
Income tax expense/(benefit) |
|
5,688 |
|
5,836 |
|
3,555 |
|
1,383 |
|
(21) |
|
3,327 |
|
2,673 |
|
(16,713) |
||||||||
|
Net income/(loss) |
$ |
19,077 |
$ |
12,984 |
$ |
54,252 |
$ |
16,233 |
$ |
(28,289) |
$ |
81,229 |
$ |
8,005 |
$ |
(10,261) |
||||||||
|
Earnings/(loss) per share—basic |
$ |
0.16 |
$ |
0.07 |
$ |
0.32 |
$ |
0.10 |
$ |
(0.20) |
$ |
0.50 |
$ |
0.05 |
$ |
(0.08) |
||||||||
|
Earnings/(loss) per share—diluted |
$ |
0.16 |
$ |
0.07 |
$ |
0.32 |
$ |
0.10 |
$ |
(0.20) |
$ |
0.50 |
$ |
0.05 |
$ |
(0.08) |
||||||||
|
Dividends per common share |
$ |
0.03 |
$ |
0.03 |
$ |
0.03 |
$ |
0.03 |
$ |
0.03 |
$ |
0.03 |
$ |
0.03 |
$ |
0.03 |
||||||||
61
|
Q4/23 |
Q3/23 |
Q2/23 |
Q1/23 |
Q4/22 |
Q3/22 |
Q2/22 |
Q1/22 |
|||||||||||||||||
|
Percent of Total Revenues |
||||||||||||||||||||||||
|
Operating Revenues |
||||||||||||||||||||||||
|
Advisory fees |
|
95.8% |
|
95.8% |
|
95.7% |
|
94.6% |
|
96.7% |
|
97.5% |
|
97.8% |
|
97.6% |
||||||||
|
Other income |
|
4.2% |
|
4.2% |
|
4.3% |
|
5.4% |
|
3.3% |
|
2.5% |
|
2.2% |
|
2.4% |
||||||||
|
Total revenues |
|
100.0% |
|
100.0% |
|
100.0% |
|
100.0% |
|
100.0% |
|
100.0% |
|
100.0% |
|
100.0% |
||||||||
|
Operating Expenses |
|
|
|
|
|
|
|
|
||||||||||||||||
|
Compensation and benefits |
|
30.6% |
|
31.0% |
|
30.7% |
|
33.5% |
|
34.0% |
|
32.7% |
|
31.7% |
|
31.5% |
||||||||
|
Fund management and administration |
|
20.3% |
|
20.0% |
|
20.7% |
|
20.9% |
|
23.1% |
|
22.5% |
|
20.7% |
|
19.8% |
||||||||
|
Marketing and advertising |
|
5.5% |
|
4.2% |
|
5.2% |
|
4.9% |
|
5.8% |
|
4.3% |
|
5.0% |
|
5.1% |
||||||||
|
Sales and business development |
|
4.3% |
|
3.7% |
|
3.9% |
|
3.6% |
|
4.6% |
|
3.8% |
|
4.1% |
|
3.3% |
||||||||
|
Contractual gold payments |
|
— |
|
n/a |
|
1.8% |
|
5.5% |
|
5.6% |
|
5.7% |
|
5.8% |
|
5.7% |
||||||||
|
Professional fees |
|
3.5% |
|
4.1% |
|
9.7% |
|
4.5% |
|
3.6% |
|
3.3% |
|
5.6% |
|
5.7% |
||||||||
|
Occupancy, communications and equipment |
|
1.3% |
|
1.3% |
|
1.4% |
|
1.3% |
|
1.5% |
|
1.4% |
|
1.4% |
|
1.0% |
||||||||
|
Depreciation and amortization |
|
0.4% |
|
0.3% |
|
0.1% |
|
0.1% |
|
0.1% |
|
0.1% |
|
0.1% |
|
0.1% |
||||||||
|
Third-party distribution fees |
|
2.8% |
|
3.0% |
|
2.2% |
|
2.7% |
|
2.4% |
|
2.5% |
|
2.4% |
|
2.8% |
||||||||
|
Other |
|
2.6% |
|
2.9% |
|
3.1% |
|
2.8% |
|
3.3% |
|
3.2% |
|
2.7% |
|
2.4% |
||||||||
|
Total operating expenses |
|
71.3% |
|
70.5% |
|
78.8% |
|
79.8% |
|
84.0% |
|
79.5% |
|
79.5% |
|
77.4% |
||||||||
|
Operating income |
|
28.7% |
|
29.5% |
|
21.2% |
|
20.2% |
|
16.0% |
|
20.5% |
|
20.5% |
|
22.6% |
||||||||
|
Other Income/(Expenses) |
|
|
|
|
|
|
|
|
||||||||||||||||
|
Interest expense |
|
(4.1%) |
|
(3.8%) |
|
(4.7%) |
|
(4.9%) |
|
(5.1%) |
|
(5.2%) |
|
(4.8%) |
|
(4.8%) |
||||||||
|
Gain/(loss) on revaluation/termination of deferred consideration |
|
— |
|
— |
|
48.2% |
|
25.1% |
|
(48.3%) |
|
107.6% |
|
3.0% |
|
(21.7%) |
||||||||
|
Interest income |
|
1.3% |
|
0.9% |
|
1.2% |
|
1.3% |
|
1.3% |
|
1.1% |
|
1.0% |
|
1.0% |
||||||||
|
Impairments |
|
(0.4%) |
|
(3.0%) |
|
— |
|
(6.0%) |
|
— |
|
— |
|
— |
|
— |
||||||||
|
Loss on extinguishment of convertible notes |
|
— |
|
— |
|
— |
|
(11.8%) |
|
— |
|
— |
|
— |
|
— |
||||||||
|
Other gains and losses, net |
|
1.8% |
|
(2.8%) |
|
1.5% |
|
(2.4%) |
|
(2.5%) |
|
(7.3%) |
|
(5.8%) |
|
(31.5%) |
||||||||
|
Income/(loss) before income taxes |
|
27.3% |
|
20.8% |
|
67.4% |
|
21.5% |
|
(38.6%) |
|
116.8% |
|
13.8% |
|
(34.4%) |
||||||||
|
Income tax expense/(benefit) |
|
6.3% |
|
6.5% |
|
4.1% |
|
1.7% |
|
(0.0%) |
|
4.6% |
|
3.5% |
|
(21.3%) |
||||||||
|
Net income/(loss) |
|
21.0% |
|
14.4% |
|
63.3% |
|
19.8% |
|
(38.6%) |
|
112.2% |
|
10.4% |
|
(13.1%) |
||||||||
62
|
Q4/23 |
Q3/23 |
Q2/23 |
Q1/23 |
Q4/22 |
Q3/22 |
Q2/22 |
Q1/22 |
|||||||||||||||||
|
Operating Statistics |
|
|
|
|
|
|
|
|
||||||||||||||||
|
GLOBAL ETPs (in millions) |
|
|
|
|
|
|
|
|
||||||||||||||||
|
Beginning of period assets |
$ |
93,735 |
$ |
93,666 |
$ |
90,740 |
$ |
81,993 |
$ |
70,878 |
$ |
74,302 |
$ |
79,407 |
$ |
77,479 |
||||||||
|
(Outflows)/inflows |
|
(255) |
|
1,983 |
|
2,327 |
|
6,341 |
|
5,264 |
|
1,747 |
|
3,852 |
|
1,319 |
||||||||
|
Market appreciation/(depreciation) |
|
6,644 |
|
(1,914) |
|
599 |
|
2,406 |
|
5,851 |
|
(5,171) |
|
(8,957) |
|
609 |
||||||||
|
End of period assets |
$ |
100,124 |
$ |
93,735 |
$ |
93,666 |
$ |
90,740 |
$ |
81,993 |
$ |
70,878 |
$ |
74,302 |
$ |
79,407 |
||||||||
|
Average assets during the period |
$ |
96,557 |
$ |
95,743 |
$ |
91,578 |
$ |
87,508 |
$ |
77,649 |
$ |
74,677 |
$ |
77,738 |
$ |
77,809 |
||||||||
|
Average advisory fee during the period |
|
0.36% |
|
0.36% |
|
0.36% |
|
0.36% |
|
0.36% |
|
0.41% |
|
0.40% |
|
0.41% |
||||||||
|
Number of ETPs—end of the period |
|
337 |
|
344 |
|
344 |
|
341 |
|
339 |
|
347 |
|
344 |
|
341 |
||||||||
|
U.S. LISTED ETFs (in millions) |
|
|
|
|
|
|
|
|
||||||||||||||||
|
Beginning of period assets |
$ |
68,018 |
$ |
65,903 |
$ |
61,283 |
$ |
55,973 |
$ |
48,043 |
$ |
47,255 |
$ |
48,622 |
$ |
48,210 |
||||||||
|
(Outflows)/inflows |
|
(67) |
|
3,601 |
|
3,249 |
|
4,012 |
|
4,232 |
|
3,812 |
|
4,278 |
|
2,250 |
||||||||
|
Market appreciation/(depreciation) |
|
4,535 |
|
(1,486) |
|
1,371 |
|
1,298 |
|
3,698 |
|
(3,024) |
|
(5,645) |
|
(1,838) |
||||||||
|
End of period assets |
$ |
72,486 |
$ |
68,018 |
$ |
65,903 |
$ |
61,283 |
$ |
55,973 |
$ |
48,043 |
$ |
47,255 |
$ |
48,622 |
||||||||
|
Average assets during the period |
$ |
69,717 |
$ |
68,008 |
$ |
62,712 |
$ |
59,430 |
$ |
53,655 |
$ |
49,466 |
$ |
48,270 |
$ |
47,499 |
||||||||
|
Number of ETFs—end of the period |
|
76 |
|
80 |
|
80 |
|
80 |
|
79 |
|
78 |
|
77 |
|
77 |
||||||||
|
EUROPEAN LISTED ETPs (in millions) |
||||||||||||||||||||||||
|
Beginning of period assets |
$ |
25,717 |
$ |
27,763 |
$ |
29,457 |
$ |
26,020 |
$ |
22,835 |
$ |
27,047 |
$ |
30,785 |
$ |
29,269 |
||||||||
|
(Outflows)/inflows |
|
(188) |
|
(1,618) |
|
(922) |
|
2,329 |
|
1,032 |
|
(2,065) |
|
(426) |
|
(931) |
||||||||
|
Market appreciation/(depreciation) |
|
2,109 |
|
(428) |
|
(772) |
|
1,108 |
|
2,153 |
|
(2,147) |
|
(3,312) |
|
2,447 |
||||||||
|
End of period assets |
$ |
27,638 |
$ |
25,717 |
$ |
27,763 |
$ |
29,457 |
$ |
26,020 |
$ |
22,835 |
$ |
27,047 |
$ |
30,785 |
||||||||
|
Average assets during the period |
$ |
26,840 |
$ |
27,735 |
$ |
28,866 |
$ |
28,078 |
$ |
23,994 |
$ |
25,211 |
$ |
29,468 |
$ |
30,310 |
||||||||
|
Number of ETPs—end of the period |
|
261 |
|
264 |
|
264 |
|
261 |
|
260 |
|
269 |
|
267 |
|
264 |
||||||||
|
PRODUCT CATEGORIES |
|
|
|
|
|
|
|
|
||||||||||||||||
|
U.S. Equity |
|
|
|
|
|
|
|
|
||||||||||||||||
|
Beginning of period assets |
$ |
25,644 |
$ |
26,001 |
$ |
24,534 |
$ |
24,112 |
$ |
20,952 |
$ |
21,058 |
$ |
23,738 |
$ |
23,860 |
||||||||
|
Inflows/(outflows) |
|
487 |
|
864 |
|
414 |
|
(149) |
|
1,022 |
|
1,239 |
|
306 |
|
779 |
||||||||
|
Market appreciation/(depreciation) |
|
3,025 |
|
(1,221) |
|
1,053 |
|
571 |
|
2,138 |
|
(1,345) |
|
(2,986) |
|
(901) |
||||||||
|
End of period assets |
$ |
29,156 |
$ |
25,644 |
$ |
26,001 |
$ |
24,534 |
$ |
24,112 |
$ |
20,952 |
$ |
21,058 |
$ |
23,738 |
||||||||
|
Average assets during the period |
$ |
26,844 |
$ |
26,501 |
$ |
24,732 |
$ |
24,725 |
$ |
23,492 |
$ |
22,534 |
$ |
22,362 |
$ |
23,134 |
||||||||
63
|
Q4/23 |
Q3/23 |
Q2/23 |
Q1/23 |
Q4/22 |
Q3/22 |
Q2/22 |
Q1/22 |
|||||||||||||||||
|
Commodity & Currency |
|
|
|
|
|
|
|
|
||||||||||||||||
|
Beginning of period assets |
$ |
20,465 |
$ |
22,384 |
$ |
24,924 |
$ |
22,097 |
$ |
19,561 |
$ |
23,624 |
$ |
26,302 |
$ |
24,599 |
||||||||
|
(Outflows)/inflows |
|
(449) |
|
(1,815) |
|
(1,513) |
|
2,003 |
|
796 |
|
(2,180) |
|
(475) |
|
(1,053) |
||||||||
|
Market appreciation/(depreciation) |
|
1,320 |
|
(104) |
|
(1,027) |
|
824 |
|
1,740 |
|
(1,883) |
|
(2,203) |
|
2,756 |
||||||||
|
End of period assets |
$ |
21,336 |
$ |
20,465 |
$ |
22,384 |
$ |
24,924 |
$ |
22,097 |
$ |
19,561 |
$ |
23,624 |
$ |
26,302 |
||||||||
|
Average assets during the period |
$ |
21,254 |
$ |
22,278 |
$ |
24,033 |
$ |
23,807 |
$ |
20,345 |
$ |
21,625 |
$ |
25,766 |
$ |
25,891 |
||||||||
|
Fixed Income |
|
|
|
|
|
|
|
|
||||||||||||||||
|
Beginning of period assets |
$ |
21,797 |
$ |
20,215 |
$ |
18,708 |
$ |
15,273 |
$ |
11,695 |
$ |
9,192 |
$ |
5,418 |
$ |
4,356 |
||||||||
|
(Outflows)/inflows |
|
(715) |
|
1,671 |
|
1,471 |
|
3,513 |
|
3,392 |
|
2,628 |
|
4,038 |
|
1,242 |
||||||||
|
Market appreciation/(depreciation) |
|
115 |
|
(89) |
|
36 |
|
(78) |
|
186 |
|
(125) |
|
(264) |
|
(180) |
||||||||
|
End of period assets |
$ |
21,197 |
$ |
21,797 |
$ |
20,215 |
$ |
18,708 |
$ |
15,273 |
$ |
11,695 |
$ |
9,192 |
$ |
5,418 |
||||||||
|
Average assets during the period |
$ |
21,889 |
$ |
20,965 |
$ |
19,185 |
$ |
17,176 |
$ |
13,962 |
$ |
10,077 |
$ |
7,426 |
$ |
4,691 |
||||||||
|
International Developed Market Equity |
|
|
|
|
|
|
|
|
||||||||||||||||
|
Beginning of period assets |
$ |
13,902 |
$ |
13,423 |
$ |
11,433 |
$ |
10,195 |
$ |
9,183 |
$ |
9,968 |
$ |
11,422 |
$ |
11,894 |
||||||||
|
Inflows/(outflows) |
|
9 |
|
798 |
|
1,593 |
|
450 |
|
40 |
|
(115) |
|
79 |
|
97 |
||||||||
|
Market appreciation/(depreciation) |
|
1,192 |
|
(319) |
|
397 |
|
788 |
|
972 |
|
(670) |
|
(1,533) |
|
(569) |
||||||||
|
End of period assets |
$ |
15,103 |
$ |
13,902 |
$ |
13,423 |
$ |
11,433 |
$ |
10,195 |
$ |
9,183 |
$ |
9,968 |
$ |
11,422 |
||||||||
|
Average assets during the period |
$ |
14,267 |
$ |
13,873 |
$ |
12,276 |
$ |
10,879 |
$ |
10,000 |
$ |
10,032 |
$ |
10,695 |
$ |
11,543 |
||||||||
|
Emerging Market Equity |
|
|
|
|
|
|
|
|
||||||||||||||||
|
Beginning of period assets |
$ |
9,569 |
$ |
9,191 |
$ |
8,811 |
$ |
8,116 |
$ |
7,495 |
$ |
8,386 |
$ |
9,991 |
$ |
10,375 |
||||||||
|
Inflows/(outflows) |
|
412 |
|
451 |
|
329 |
|
486 |
|
(53) |
|
114 |
|
(223) |
|
189 |
||||||||
|
Market appreciation/(depreciation) |
|
745 |
|
(73) |
|
51 |
|
209 |
|
674 |
|
(1,005) |
|
(1,382) |
|
(573) |
||||||||
|
End of period assets |
$ |
10,726 |
$ |
9,569 |
$ |
9,191 |
$ |
8,811 |
$ |
8,116 |
$ |
7,495 |
$ |
8,386 |
$ |
9,991 |
||||||||
|
Average assets during the period |
$ |
9,833 |
$ |
9,652 |
$ |
8,998 |
$ |
8,666 |
$ |
7,770 |
$ |
8,329 |
$ |
9,155 |
$ |
10,116 |
||||||||
64
|
Q4/23 |
Q3/23 |
Q2/23 |
Q1/23 |
Q4/22 |
Q3/22 |
Q2/22 |
Q1/22 |
|||||||||||||||||
|
Leveraged & Inverse |
||||||||||||||||||||||||
|
Beginning of period assets |
$ |
1,781 |
$ |
1,864 |
$ |
1,785 |
$ |
1,754 |
$ |
1,523 |
$ |
1,618 |
$ |
1,860 |
$ |
1,777 |
||||||||
|
(Outflows)/inflows |
|
(59) |
|
(1) |
|
12 |
|
43 |
|
59 |
|
45 |
|
90 |
|
(1) |
||||||||
|
Market appreciation/(depreciation) |
|
93 |
|
(82) |
|
67 |
|
(12) |
|
172 |
|
(140) |
|
(332) |
|
84 |
||||||||
|
End of period assets |
$ |
1,815 |
$ |
1,781 |
$ |
1,864 |
$ |
1,785 |
$ |
1,754 |
$ |
1,523 |
$ |
1,618 |
$ |
1,860 |
||||||||
|
Average assets during the period |
$ |
1,803 |
$ |
1,894 |
$ |
1,798 |
$ |
1,757 |
$ |
1,623 |
$ |
1,589 |
$ |
1,770 |
$ |
1,835 |
||||||||
|
Cryptocurrency |
|
|
|
|
|
|
|
|
||||||||||||||||
|
Beginning of period assets |
$ |
243 |
$ |
248 |
$ |
239 |
$ |
136 |
$ |
163 |
$ |
151 |
$ |
383 |
$ |
357 |
||||||||
|
Inflows/(outflows) |
|
28 |
|
10 |
|
(1) |
|
13 |
|
(4) |
|
— |
|
3 |
|
37 |
||||||||
|
Market appreciation/(depreciation) |
|
143 |
|
(15) |
|
10 |
|
90 |
|
(23) |
|
12 |
|
(235) |
|
(11) |
||||||||
|
End of period assets |
$ |
414 |
$ |
243 |
$ |
248 |
$ |
239 |
$ |
136 |
$ |
163 |
$ |
151 |
$ |
383 |
||||||||
|
Average assets during the period |
$ |
325 |
$ |
238 |
$ |
236 |
$ |
190 |
$ |
152 |
$ |
178 |
$ |
265 |
$ |
324 |
||||||||
|
Alternatives |
|
|
|
|
|
|
|
|
||||||||||||||||
|
Beginning of period assets |
$ |
334 |
$ |
340 |
$ |
306 |
$ |
310 |
$ |
306 |
$ |
305 |
$ |
293 |
$ |
261 |
||||||||
|
Inflows/(outflows) |
|
32 |
|
5 |
|
22 |
|
(18) |
|
12 |
|
16 |
|
34 |
|
29 |
||||||||
|
Market appreciation/(depreciation) |
|
11 |
|
(11) |
|
12 |
|
14 |
|
(8) |
|
(15) |
|
(22) |
|
3 |
||||||||
|
End of period assets |
$ |
377 |
$ |
334 |
$ |
340 |
$ |
306 |
$ |
310 |
$ |
306 |
$ |
305 |
$ |
293 |
||||||||
|
Average assets during the period |
$ |
342 |
$ |
342 |
$ |
320 |
$ |
308 |
$ |
305 |
$ |
313 |
$ |
299 |
$ |
275 |
||||||||
|
Headcount |
|
303 |
|
299 |
|
291 |
|
279 |
|
273 |
|
274 |
|
264 |
|
253 |
||||||||
Note: Previously issued statistics may be restated due to fund closures and trade adjustments
Source: WisdomTree
Non-GAAP Financial Measurements
In an effort to provide additional information regarding our results as determined by GAAP, we also disclose certain non-GAAP information which we believe provides useful and meaningful information. Our management reviews these non-GAAP financial measurements when evaluating our financial performance and results of operations; therefore, we believe it is useful to provide information with respect to these non-GAAP measurements so as to share this perspective of management. Non-GAAP measurements do not have any standardized meaning, do not replace nor are superior to GAAP financial measurements and are unlikely to be comparable to similar measures presented by other companies. These non-GAAP financial measurements should be considered in the context with our GAAP results. The non-GAAP financial measurements contained in this Report include:
Adjusted net income and diluted earnings per share.
We disclose adjusted net income and diluted earnings per share as non-GAAP financial measurements in order to report our results exclusive of items that are non-recurring or not core to our operating business. We believe presenting these non-GAAP financial measurements provides investors with a consistent way to analyze our performance. These non-GAAP financial measurements exclude the following:
• Unrealized gains or losses on revaluation/termination of deferred consideration—gold payments: Deferred consideration—gold payments was an obligation we assumed in connection with the ETFS Acquisition that was carried at fair value. This item represented the present value of an obligation to pay fixed ounces of gold into perpetuity and is measured using forward-looking gold prices. Changes in the forward-looking price of gold and changes in the discount rate used to compute the present value of the annual payment obligations have had a material impact on the carrying value of the deferred consideration and our reported financial results. We exclude this item when calculating our non-GAAP financial measurements as it was not core to our operating business. The item was not adjusted for income taxes as the obligation was assumed by a wholly-owned subsidiary of ours that is based in Jersey, a jurisdiction where we are subject to a zero percent tax rate. During the second quarter of 2023, we terminated this obligation for aggregate consideration totaling approximately $137.0 million.
65
• Gains or losses on financial instruments owned: We account for our financial instruments owned as trading securities, which requires these instruments to be measured at fair value with gains and losses reported in net income. We exclude these items when calculating our non-GAAP financial measurements as the gains and losses introduce volatility in earnings and are not core to our operating business.
• Tax windfalls and shortfalls upon vesting and exercise of stock-based compensation awards: GAAP requires the recognition of tax windfalls and shortfalls within income tax expense. These items arise upon the vesting and exercise of stock-based compensation awards and the magnitude is directly correlated to the number of awards vesting/exercised as well as the difference between the price of our stock on the date the award was granted and the date the award vested or was exercised. We exclude these items when calculating our non-GAAP financial measurements as they introduce volatility in earnings and are not core to our operating business.
• Imputed interest on our payable to GBH: During the fourth quarter of 2023, we repurchased our Series C Preferred Stock, which was convertible into approximately 13.1 million shares of our common stock, from GBH for aggregate cash consideration of approximately $84.4 million. Under the terms of the transaction, we paid GBH $40.0 million on the closing date, with the remainder of the purchase price payable in equal, interest-free installments on the first, second and third anniversaries of the closing date. Under U.S. GAAP, the obligation is recorded at its present value utilizing a market rate of interest on the closing date of 7.0% and the corresponding discount is amortized as interest expense pursuant to the effective interest method of accounting over the life of the obligation. We exclude this item when calculating our non-GAAP financial measurements as recognition of interest expense is non-cash and contrary to the stated terms of our obligation.
• Other items: Unrealized gains and losses recognized on our investments, changes in deferred tax asset valuation allowances, expenses incurred in response to an activist campaign, impairment charges, a loss on extinguishment of debt and a gain recognized upon the sale of our Canadian ETF business (including the remeasurement of contingent consideration) are excluded when calculating our non-GAAP financial measurements.
66
|
Adjusted Net Income and Diluted Earnings per Share: |
Years Ended December 31, |
||||||||
|
2023 |
2022 |
2021 |
|||||||
|
Net income, as reported |
$ |
102,546 |
$ |
50,684 |
$ |
49,797 |
|||
|
Deduct: Gain on revaluation/termination of deferred consideration |
|
(61,953) |
|
(27,765) |
|
(2,018) |
|||
|
Add back: Loss on extinguishment of convertible notes, net of income taxes |
|
9,623 |
|
— |
|
— |
|||
|
Add back: Impairments, net of income taxes |
|
6,013 |
|
— |
|
12,247 |
|||
|
Add back: Expenses incurred in response to an activist campaign, net of income taxes |
|
4,452 |
|
3,376 |
|
— |
|||
|
Add back: Increase in deferred tax valuation allowance on financial instruments owned and investments |
|
2,113 |
|
4,729 |
|
— |
|||
|
Deduct: Gain recognized from the sale of Canadian ETF business, including remeasurement of contingent consideration |
|
(1,477) |
|
— |
|
(787) |
|||
|
Add back/(deduct): Unrealized loss/(gain) recognized on our investments, net of income taxes |
|
607 |
|
290 |
|
(284) |
|||
|
Add back: Losses on financial instruments owned, at fair value, net of income taxes |
|
392 |
|
12,505 |
|
2,507 |
|||
|
Add back: Litigation expenses associated with certain provisions of the Stockholder Rights Agreement, net of income taxes |
|
367 |
|
— |
|
— |
|||
|
Add back: Imputed interest on payable to GBH, net of income taxes |
|
224 |
|
— |
|
— |
|||
|
Deduct: Tax windfalls upon vesting and exercise of stock-based compensation awards |
|
(176) |
|
(541) |
|
(110) |
|||
|
Deduct: Decrease in deferred tax valuation allowance on net operating losses of a European subsidiary |
|
— |
|
(1,609) |
|
— |
|||
|
Adjusted net income |
$ |
62,731 |
$ |
41,669 |
$ |
61,352 |
|||
|
Deduct: Income distributed to participating securities |
|
(2,770) |
|
(2,186) |
|
(2,168) |
|||
|
Deduct: Undistributed income allocable to participating securities |
|
(5,868) |
|
(2,509) |
|
(4,630) |
|||
|
Adjusted net income available to common stockholders |
$ |
54,093 |
$ |
36,974 |
$ |
54,554 |
|||
|
Weighted average diluted shares, excluding participating securities (See Note 21 to our Consolidated Financial Statements) |
|
147,827 |
|
143,295 |
|
145,055 |
|||
|
Adjusted earnings per share—diluted |
$ |
0.37 |
$ |
0.26 |
$ |
0.38 |
|||
Adjusted net income as reported on a non-GAAP basis during the year ended December 31, 2023 also excludes a gain of $8.0 million recognized upon the repurchase of our Series C Preferred Stock, which was convertible into approximately 13.1 million shares of our common stock. Under U.S. GAAP, this amount is excluded from net income, but is required to be added to net income to arrive at income available to common stockholders in the calculation of earnings per share.
67
Liquidity and Capital Resources
The following table summarizes key data regarding our liquidity, capital resources and use of capital to fund our operations:
|
December 31, |
December 31, |
|||||
|
Balance Sheet Data (in thousands): |
||||||
|
Cash and cash equivalents |
$ |
129,305 |
$ |
132,101 |
||
|
Financial instruments owned, at fair value |
|
58,722 |
|
126,239 |
||
|
Accounts receivable |
|
35,473 |
|
30,549 |
||
|
Securities held-to-maturity |
|
230 |
|
259 |
||
|
Total: Liquid assets |
|
223,730 |
|
289,148 |
||
|
Less: Total current liabilities |
|
(103,216) |
|
(148,434) |
||
|
Less: Other assets—seed capital (WisdomTree Digital Funds) |
|
(18,308) |
|
(1,765) |
||
|
Less: Regulatory capital requirements |
|
(29,156) |
|
(25,988) |
||
|
Total: Available liquidity |
$ |
73,050 |
$ |
112,961 |
||
|
Year Ended December 31, |
|||||||||
|
2023 |
2022 |
2021 |
|||||||
|
Cash Flow Data (in thousands): |
|||||||||
|
Operating cash flows |
$ |
85,600 |
$ |
55,087 |
$ |
75,318 |
|||
|
Investing cash flows |
|
82,049 |
|
(37,657) |
|
(99,632) |
|||
|
Financing cash flows |
|
(171,636) |
|
(22,780) |
|
92,553 |
|||
|
Foreign exchange rate effect |
|
1,191 |
|
(3,258) |
|
(955) |
|||
|
(Decrease)/increase in cash and cash equivalents |
$ |
(2,796) |
$ |
(8,608) |
$ |
67,284 |
|||
Liquidity
We consider our available liquidity to be our liquid assets, less our current liabilities and regulatory capital requirements of certain European subsidiaries. Liquid assets consist of cash and cash equivalents, financial instruments owned, at fair value, accounts receivable and securities held-to-maturity. Our financial instruments owned, at fair value are highly liquid investments. Accounts receivable are current assets and primarily represent receivables from advisory fees we earn from our ETPs. Our current liabilities consist primarily of payments owed to vendors and third parties in the normal course of business, deferred consideration and accrued incentive compensation for employees.
Cash and cash equivalents decreased $2.8 million during the year ended December 31, 2023 due to $184.3 million used to repurchase and settle our 4.25% Convertible Senior Notes due 2023, $57.4 million used to purchase financial instruments owned, at fair value, $50.0 million used to terminate our deferred consideration—gold payments obligation, $40.0 million used to repurchase our Series C Preferred Stock, $20.1 million used to pay dividends on our common stock, $11.2 million used to purchase investments, $3.6 million used to repurchase our common stock, $3.5 million used to pay issuance costs in respect of our 5.75% Convertible Senior Notes due 2028, or the 2023 Notes, $2.1 million used for software development and $1.2 million used in other activities. These decreases were partly offset by $130.0 million of proceeds from the issuance of the 2023 Notes, $123.6 million of proceeds from the sale of financial instruments owned, at fair value, $85.6 million of net cash provided by operating activities, $28.8 million of proceeds from the exit from our investment in Securrency, Inc. in connection with the sale of Securrency, Inc. to an unaffiliated third party, $1.5 million from receipt of contingent consideration related to the sale of our Canadian ETF business, and $1.1 million from other activities.
Cash and cash equivalents decreased $8.6 million during the year ended December 31, 2022 due to $55.1 million of net cash provided by operating activities and $52.1 million of proceeds from the sale of financial instruments owned, at fair value. These increases were partly offset by $67.7 million used to purchase financial instruments owned, at fair value, $21.9 million used to purchase investments, $19.4 million used to pay dividends, $3.4 million used to repurchase our common stock and $3.4 million from other activities.
68
Cash and cash equivalents increased $67.3 million during the year ended December 31, 2021 due to $150.0 million of proceeds from the issuance of our 3.25% Convertible Senior Notes due 2026, or the 2021 Notes, $75.3 million of net cash provided by operating activities, $19.4 million of proceeds from the sale of financial instruments owned, at fair value and $2.4 million of proceeds from the receipt of contingent consideration from the sale of our Canadian ETF business. These increases were partly offset by $115.5 million used to purchase financial instruments owned, at fair value, $34.5 million used to repurchase our common stock, $19.5 million used to pay dividends on our common stock, $5.8 million used to purchase investments, $4.3 million used to pay the 2021 Notes issuance costs and $0.2 million from other activities.
Issuance of Convertible Notes
On February 14, 2023, we issued and sold $130.0 million in aggregate principal amount of 5.75% Convertible Senior Notes due 2028 (the “2023 Notes”) pursuant to an indenture dated February 14, 2023, between us and U.S. Bank Trust Company, National Association, as trustee, in a private offering to qualified institutional buyers pursuant to Rule 144A under the Securities Act of 1933, as amended (“Rule 144A”).
On June 14, 2021, we issued and sold $150.0 million in aggregate principal amount of 3.25% Convertible Senior Notes due 2026 (the “2021 Notes”) pursuant to an indenture dated June 14, 2021, between us and the trustee, in a private offering to qualified institutional buyers pursuant to Rule 144A.
On June 16, 2020, we issued and sold $150.0 million in aggregate principal amount of 4.25% Convertible Senior Notes due 2023 (the “June 2020 Notes”) pursuant to an indenture dated June 16, 2020, between us and the trustee, in a private offering to qualified institutional buyers pursuant to Rule 144A. On August 13, 2020, we issued and sold $25.0 million in aggregate principal amount of 4.25% Convertible Senior Notes due 2023 at a price equal to 101% of the principal amount thereof, plus interest deemed to have accrued since June 16, 2020, which constituted a further issuance of, and formed a single series with, our June 2020 Notes (the “August 2020 Notes” and together with the June 2020 Notes, the “2020 Notes”).
In connection with the issuance of the 2023 Notes, we repurchased $115.0 million in aggregate principal amount of the 2020 Notes. As a result of this repurchase, we recognized a loss on extinguishment of approximately $9.7 million during the year ended December 31, 2023. The remainder of the 2020 Notes matured on June 15, 2023 and were settled for approximately $59.9 million of cash and approximately 1.0 million shares of our common stock.
After the repurchase and maturity of the 2020 Notes and the issuance of the 2023 Notes (such 2023 Notes, together with the 2021 Notes, the “Convertible Notes”), we had $280.0 million in aggregate principal amount of Convertible Notes outstanding.
Key terms of the Convertible Notes are as follows:
|
2023 Notes |
2021 Notes |
|||||
|
Principal outstanding |
$ |
130.0 |
$ |
150.0 |
||
|
Maturity date (unless earlier converted, repurchased or redeemed) |
|
August 15, 2028 |
|
June 15, 2026 |
||
|
Interest rate |
|
5.75% |
|
3.25% |
||
|
Conversion price |
$ |
9.54 |
$ |
11.04 |
||
|
Conversion rate |
|
104.8658 |
|
90.5797 |
||
|
Redemption price |
$ |
12.40 |
$ |
14.35 |
||
• Interest rate: Payable semiannually in arrears on February 15 and August 15 of each year for the 2023 Notes (beginning on August 15, 2023) and on June 15 and December 15 of each year for the 2021 Notes.
• Conversion price: Convertible at an initial conversion rate set forth in the table above into shares of our common stock, per $1,000 principal amount of notes (equivalent to an initial conversion price set forth in the table above), subject to adjustment.
69
• Conversion: Holders may convert at their option at any time prior to the close of business on the business day immediately preceding May 15, 2028 and March 15, 2026 for the 2023 Notes and the 2021 Notes, respectively, only under the following circumstances: (i) if the last reported sale price of our common stock for at least 20 trading days during a period of 30 consecutive trading days ending on the last trading day of the immediately preceding calendar quarter is greater than or equal to 130% of the conversion price for the respective Convertible Notes on each applicable trading day; (ii) during the five business day period after any ten consecutive trading day period (the “measurement period”) in which the trading price per $1,000 principal amount of the Convertible Notes for each trading day of the measurement period was less than 98% of the product of the last reported sales price of our common stock and the conversion rate on each such trading day; (iii) upon a notice of redemption delivered by us in accordance with the terms of the indentures but only with respect to the Convertible Notes called (or deemed called) for redemption; or (iv) upon the occurrence of specified corporate events. On or after May 15, 2028 and March 15, 2026 in respect of the 2023 Notes, and the 2021 Notes, respectively, until the close of business on the second scheduled trading day immediately preceding the maturity date, holders may convert their Convertible Notes at any time, regardless of the foregoing circumstances.
• Cash settlement of principal amount: Upon conversion, we will pay cash up to the aggregate principal amount of the Convertible Notes to be converted. At our election, we will also settle our conversion obligation in excess of the aggregate principal amount of the Convertible Notes being converted in either cash, shares of our common stock or a combination of cash and shares of its common stock.
• Redemption price: We may redeem for cash all or any portion of the Convertible Notes, at our option, on or after August 20, 2025 and June 20, 2023 in respect of the 2023 Notes and the 2021 Notes, respectively, and on or prior to the 55th scheduled trading day immediately preceding the maturity date, if the last reported sale price of our common stock has been at least 130% of the conversion price for the respective Convertible Notes then in effect for at least 20 trading days, including the trading day immediately preceding the date on which we provide notice of redemption, during any 30 consecutive trading day period ending on, and including, the trading day immediately preceding the date on which we provide notice of redemption, at a redemption price equal to 100% of the principal amount of the notes to be redeemed, plus accrued and unpaid interest to, but excluding the redemption date. No sinking fund is provided for the Convertible Notes.
• Limited investor put rights: Holders of the Convertible Notes have the right to require us to repurchase for cash all or a portion of their notes at 100% of their principal amount, plus any accrued and unpaid interest, upon the occurrence of certain change of control transactions or liquidation, dissolution or common stock delisting events.
• Conversion rate increase in certain customary circumstances: In certain circumstances, conversions in connection with a “make-whole fundamental change” (as defined in the indentures) or conversions of Convertible Notes called (or deemed called) for redemption may result in an increase to the conversion rate, provided that the conversion rate will not exceed 167.7853 shares and 144.9275 shares of our common stock per $1,000 principal amount of the 2023 Notes and the 2021 Notes, respectively (the equivalent of 43,551,214 shares of our common stock), subject to adjustment.
• Seniority and Security: The 2023 Notes and 2021 Notes rank equal in right of payment, and are our senior unsecured obligations, but are subordinated in right of payment to our obligations to make certain redemption payments (if and when due) in respect of our Series A Preferred Stock (See Note 11 to our Consolidated Financial Statements).
The indentures contain customary terms and covenants, including that upon certain events of default occurring and continuing, either the trustee or the respective holders of not less than 25% in aggregate principal amount of the respective series of Convertible Notes outstanding may declare the entire principal amount of all such respective Convertible Notes to be repurchased, plus any accrued special interest, if any, to be immediately due and payable.
Capital Resources
Our principal source of financing is our operating cash flow. We believe that current cash flows generated by our operating activities and existing cash balances should be sufficient for us to fund our operations for the foreseeable future.
70
Our ability to satisfy our contractual obligations as they arise are discussed in the section titled “Contractual Obligations” below.
Use of Capital
Our business does not require us to maintain a significant cash position. However, certain of our subsidiaries are required to maintain a minimum level of regulatory capital, which at December 31, 2023 was approximately $29.2 million in the aggregate. Notwithstanding these regulatory capital requirements, we expect that our main uses of cash will be to fund the ongoing operations of our business. We also maintain a capital return program which includes a $0.03 per share quarterly cash dividend and authority to purchase our common stock through April 27, 2025, including purchases to offset future equity grants made under our equity plans.
During the year ended December 31, 2023, we repurchased 635,653 shares of our common stock under the repurchase program for an aggregate cost of $3.6 million. Currently, approximately $96.4 million remains under this program for future purchases. We also repurchased our Series C Preferred Stock, which was convertible into approximately 13.1 million shares of common stock, from GBH for aggregate cash consideration of approximately $84.4 million. Under the terms of the transaction, we paid GBH $40.0 million on the closing date, with the remainder of the purchase price payable in equal, interest-free installments on the first, second and third anniversaries of the closing date.
Contractual Obligations
Convertible Notes
We currently have $280.0 million aggregate principal amount of Convertible Notes outstanding, of which $150.0 million and $130.0 million are scheduled to mature on June 15, 2026 and August 15, 2028, respectively, unless earlier converted, repurchased or redeemed. Conditional conversions or a requirement to repurchase the Convertible Notes upon the occurrence of a fundamental change may accelerate payment.
The Convertible Notes require cash settlement of the principal amount, while settlement of the conversion obligation in excess of the aggregate principal amount may be satisfied in either cash, shares of our common stock or a combination of cash and shares of its common stock. We currently anticipate refinancing these obligations when due.
See the section titled “Issuance of Convertible Notes” above for additional information.
Deferred Consideration–Gold Payments
On May 10, 2023, we entered into and closed on a Sale, Purchase and Assignment Deed to terminate our obligations relating to the contractual gold payments. Pursuant to that agreement, we paid consideration totaling $136.9 million, including an aggregate of $50.0 million in cash and the issuance of 13,087 shares of Series C Preferred Stock (valued at $86.9 million, based on the closing price of our common stock on May 9, 2023 of $6.64 per share), which was convertible into 13,087,000 shares of our common stock. The Series C Preferred Stock was subsequently repurchased on November 20, 2023 as described in “Payable to GBH” below. See Note 12 to our Consolidated Financial Statements for additional information.
Payable to GBH
On November 20, 2023, we repurchased our Series C Preferred Stock from GBH for aggregate cash consideration of approximately $84.4 million. Under the terms of the transaction, we paid GBH $40.0 million on the closing date, with the remainder of the purchase price payable in equal, interest-free installments on the first, second and third anniversaries of the closing date. The implied price per share was $6.02 when considering the interest-free financing element of the transaction.
Operating Leases
Total future minimum lease payments with respect to our operating lease liabilities were $0.6 million at December 31, 2023. Cash flows generated by our operating activities and existing cash balances should be sufficient to satisfy the future minimum lease payments. See Note 13 to our Consolidated Financial Statements for additional information.
71
Off-Balance Sheet Arrangements
We do not have any off-balance sheet financing or other arrangements and have neither created nor are party to any special-purpose or off-balance sheet entities for the purpose of raising capital, incurring debt or operating our business.
Critical Accounting Policies and Estimates
Goodwill and Intangible Assets
Goodwill is the excess of the purchase price over the fair values of the identifiable net assets at the acquisition date. We test goodwill for impairment at least annually and at the time of a triggering event requiring re-evaluation, if one were to occur. Goodwill is considered impaired when the estimated fair value of the reporting unit that was allocated the goodwill is less than its carrying value. If the estimated fair value of such reporting unit is less than its carrying value, goodwill impairment is recognized based on that difference, not to exceed the carrying amount of goodwill. A reporting unit is an operating segment or a component of an operating segment provided that the component constitutes a business for which discrete financial information is available and management regularly reviews the operating results of that component.
Goodwill is allocated to our U.S. business and European business components. For impairment testing purposes, these components are aggregated as a single reporting unit as they fall under the same operating segment and have similar economic characteristics.
Goodwill is assessed for impairment annually on November 30th. When performing our goodwill impairment test, we consider a qualitative assessment, when appropriate, and the market approach and its market capitalization when determining the fair value of the reporting unit. The results of our analysis indicated no impairment based upon a quantitative assessment.
Indefinite-lived intangible assets are tested for impairment at least annually and are reviewed for impairment whenever events or changes in circumstances indicate that the carrying amount of an asset may not be recoverable. Indefinite-lived intangible assets are impaired if their estimated fair value is less than their carrying value. We may rely on a qualitative assessment when performing our intangible asset impairment test. Otherwise, the impairment evaluation is performed at the lowest level of reasonably identifiable cash flows independent of other assets. The annual impairment testing date for our intangible assets is November 30th. The results of our analysis identified no indicators of impairment to be recognized based upon a quantitative assessment (discounted cash flow analysis) which relied upon significant unobservable inputs including projected revenue growth rates of 3.0% and a weighted average cost of capital of 10.5%.
Investments
We account for equity investments that do not have a readily determinable fair value under the measurement alternative prescribed within ASU 2016-01, Financial Instruments – Recognition and Measurement of Financial Assets and Financial Liabilities, to the extent such investments are not subject to consolidation or the equity method. Under the measurement alternative, these financial instruments are carried at cost, less any impairment (assessed quarterly), plus or minus changes resulting from observable price changes in orderly transactions for an identical or similar investment of the same issuer. In addition, income is recognized when dividends are received only to the extent they are distributed from net accumulated earnings of the investee. Otherwise, such distributions are considered returns of investment and are recorded as a reduction of the cost of the investment. See Note 7 to our Consolidated Financial Statements for information.
Investments in debt instruments are accounted for at fair value, with changes in fair value reported in other income/(expenses).
Revenue Recognition
We earn substantially all of our revenue in the form of advisory fees from our ETPs and recognize this revenue over time, as the performance obligation is satisfied. Advisory fees are based on a percentage of the ETPs’ average daily net assets. Progress is measured using the practical expedient under the output method resulting in the recognition of revenue in the amount for which we have a right to invoice.
72
ITEM 7A. QUANTITATIVE AND QUALITATIVE DISCLOSURES ABOUT MARKET RISK
The following information, together with information included in other parts of this Management’s Discussion and Analysis of Financial Condition and Results of Operations, describes key aspects of our market risk.
Market Risk
Market risk to us generally represents the risk of changes in the value of our ETPs that results from fluctuations in securities or commodity prices, foreign currency exchange rates against the U.S. dollar, and interest rates. Nearly all our revenues are derived from advisory agreements for the WisdomTree ETPs. Under these agreements, the advisory fee we receive is based on the average market value of the assets in the WisdomTree ETP portfolios we manage.
Fluctuations in the value of the ETPs are common and are generated by numerous factors such as market volatility, the global economy, inflation, changes in investor strategies and sentiment, availability of alternative investment vehicles, domestic and foreign government regulations, emerging markets developments and others. Accordingly, changes in any one or a combination of these factors may reduce the value of investment securities and, in turn, the underlying AUM on which our revenues are earned. These declines may cause investors to withdraw funds from our ETPs in favor of investments that they perceive as offering greater opportunity or lower risk, thereby compounding the impact on our revenues. We believe challenging and volatile market conditions will continue to be present in the foreseeable future.
Interest Rate Risk
We invest our corporate cash in short-term interest earning assets, primarily in federal agency debt instruments, WisdomTree fixed income ETFs, U.S. treasuries, corporate bonds, money market instruments at a commercial bank and other financial instruments which totaled $127.4 million and $109.2 million as of December 31, 2022 and 2023, respectively. During the years ended December 31, 2022 and 2023, we recognized losses on these financial instruments of $16.5 million and $0.5 million, respectively, and any losses recognized in the future may be material to our operating results. We do not anticipate that changes in interest rates will have a material impact on our financial condition or cash flows.
In addition, our Convertible Notes bear interest at fixed rates of 5.75% and 3.25% for the 2023 Notes and the 2021 Notes, respectively. Therefore, we have no direct financial statement risk associated with changes in interest rates. However, the fair value of the Convertible Notes changes primarily when the market price of our common stock fluctuates or interest rates change.
Exchange Rate Risk
We are subject to currency translation exposure on the results of our non-U.S. operations, primarily in the U.K. and Europe. Foreign currency translation risk is the risk that exchange rate gains or losses arise from translating foreign entities’ statements of earnings and balance sheets from functional currency to our reporting currency (the U.S. dollar) for consolidation purposes. The advisory fees earned on our European listed ETPs are predominantly in U.S. dollars (and also paid in gold ounces, as described below); however, expenses for corporate overhead are generally incurred in British pounds. Currently, we do not enter into derivative financial instruments aimed at offsetting certain exposures in the statement of operations or the balance sheet but may seek to do so in the future.
Exchange rate risk associated with the euro is not considered to be significant.
Commodity and Cryptocurrency Price Risk
Fluctuations in the prices of commodities and cryptocurrencies that are linked to certain of our ETPs could have a material adverse effect on our AUM and revenues. In addition, a portion of the advisory fee revenues we receive on our ETPs backed by gold, other precious metals and cryptocurrencies are paid in the underlying metal or cryptocurrency. While we readily sell the gold, precious metals and cryptocurrencies that we earn under these advisory contracts, we still may maintain a position. We currently do not enter into arrangements to hedge against fluctuations in the price of these commodities and cryptocurrencies and any hedging we may undertake in the future may not be cost-effective or sufficient to hedge against this exposure.
73
ITEM 8. FINANCIAL STATEMENTS AND SUPPLEMENTARY DATA
The report of the independent registered public accounting firm and financial statements listed in the accompanying index are included in Item 15 of this Report. See Index to our Consolidated Financial Statements on page F-1 of this Report.
ITEM 9. CHANGES IN AND DISAGREEMENTS WITH ACCOUNTANTS ON ACCOUNTING AND FINANCIAL DISCLOSURE
None.
ITEM 9A. CONTROLS AND PROCEDURES
Evaluation of Disclosure Controls and Procedures
As of December 31, 2023, our management, with the participation of our Chief Executive Officer and Chief Financial Officer, evaluated the effectiveness of our disclosure controls and procedures pursuant to Rule 13a-15(b) promulgated under the Exchange Act. Based upon that evaluation, our Chief Executive Officer and Chief Financial Officer concluded that, as of December 31, 2023, our disclosure controls and procedures were effective at a reasonable assurance level in ensuring that material information required to be disclosed by us in the reports that we file or submit under the Exchange Act is recorded, processed, summarized and reported within the time periods specified in the rules, regulations and forms of the SEC, including ensuring that such material information is accumulated by and communicated to our management, including our Chief Executive Officer and Chief Financial Officer, as appropriate to allow timely decisions regarding required disclosure.
Changes in Internal Control over Financial Reporting
During the quarter ended December 31, 2023, there were no changes in our internal control over financial reporting that have materially affected, or are reasonably likely to materially affect, our internal control over financial reporting.
Report of Management on Internal Control over Financial Reporting
Our management is responsible for establishing and maintaining adequate internal control over financial reporting, as defined in Rules 13a-15(f) and 15d-15(f) under the Exchange Act. In order to evaluate the effectiveness of internal control over financial reporting, management has conducted an assessment, including testing, using the criteria in Internal Control—Integrated Framework issued by the Committee of Sponsoring Organizations of the Treadway Commission (2013 Framework) (the COSO criteria). Our system of internal control over financial reporting is designed to provide reasonable assurance regarding the reliability of financial reporting and the preparation of financial statements for external purposes in accordance with generally accepted accounting principles. Our internal control over financial reporting includes those policies and procedures that (i) pertain to the maintenance of records that, in reasonable detail, accurately and fairly reflect the transactions and dispositions of the Company’s assets; (ii) provide reasonable assurance that transactions are recorded as necessary to permit preparation of financial statements in accordance with generally accepted accounting principles, and that receipts and expenditures of the Company are being made only in accordance with authorizations of management and directors of the Company; and (iii) provide reasonable assurance regarding prevention or timely detection of unauthorized acquisition, use, or disposition of the Company’s assets that could have a material effect on the financial statements.
Because of its inherent limitations, internal control over financial reporting may not prevent or detect misstatements. Also, projections of any evaluation of effectiveness to future periods are subject to the risk that controls may become inadequate because of changes in conditions, or that the degree of compliance with the policies or procedures may deteriorate.
Based on the assessment, management has concluded that the Company maintained effective internal control over financial reporting as of December 31, 2023, based on the COSO criteria.
The effectiveness of the Company’s internal control over financial reporting as of December 31, 2023 has been audited by Ernst & Young LLP, an independent registered public accounting firm, as stated in their report, which is included herein.
74
ITEM 9B. OTHER INFORMATION
10b5-1 Trading Arrangements
During the three months ended December 31, 2023, none of our directors or officers (as defined in Rule 16a-1(f) of the Exchange Act)
ITEM 9C. DISCLOSURE REGARDING FOREIGN JURISDICTIONS THAT PREVENT INSPECTIONS
Not applicable.
PART III
ITEM 10. DIRECTORS, EXECUTIVE OFFICERS AND CORPORATE GOVERNANCE
The information required by Item 401 of Regulation S-K regarding directors and officers will be contained in our definitive proxy statement to be filed pursuant to Regulation 14A for our 2024 Annual Meeting of Stockholders, expected to be filed within 120 days of our fiscal year end, or in an amendment to this Form 10-K, and is incorporated herein by reference.
The information required by Item 405 of Regulation S-K will be contained in our definitive proxy statement or in an amendment to this Form 10-K and is incorporated herein by reference.
We have adopted a Code of Business Conduct and Ethics that applies to all of our directors, officers and employees, including our principal executive officer and principal financial and accounting officer. The Code of Business Conduct and Ethics is posted on our website at https://ir.wisdomtree.com/corporate-governance/governance-documents.
We will post any amendments to, or waivers from, a provision of the Code of Business Conduct and Ethics by posting such information on our website, at the address and location specified above.
The information required by Item 407(c)(3), (d)(4) and (d)(5) of Regulation S-K will be contained in our definitive proxy statement or in an amendment to this Form 10-K and is incorporated herein by reference.
75
ITEM 11. EXECUTIVE COMPENSATION
The information required by Item 402 and Item 407(e)(4) and (e)(5) of Regulation S-K will be contained in our definitive proxy statement or in an amendment to this Form 10-K and is incorporated herein by reference.
ITEM 12. SECURITY OWNERSHIP OF CERTAIN BENEFICIAL OWNERS AND MANAGEMENT AND RELATED STOCKHOLDER MATTERS
The information required by Item 201(d) and Item 403 of Regulation S-K will be contained in our definitive proxy statement or in an amendment to this Form 10-K and is incorporated herein by reference.
ITEM 13. CERTAIN RELATIONSHIPS AND RELATED TRANSACTIONS, AND DIRECTOR INDEPENDENCE
The information required by Item 404 and Item 407(a) of Regulation S-K will be contained in our definitive proxy statement or in an amendment to this Form 10-K and is incorporated herein by reference.
ITEM 14. PRINCIPAL ACCOUNTANT FEES AND SERVICES
Our independent public accounting firm is Ernst & Young LLP, NewYork,
The information required by Item 9(e) of Schedule 14A will be contained in our definitive proxy statement or in an amendment to this Form 10-K and is incorporated herein by reference.
PART IV
ITEM 15. EXHIBITS; FINANCIAL STATEMENT SCHEDULES
(a). The following are filed as part of this Report:
1. Consolidated Financial Statements: The consolidated financial statements and reports of independent registered public accounting firm required by this item are included beginning on page F-1.
2. Financial Statement Schedules: None.
All other schedules are omitted because they are not applicable or not required, or because the required information is shown either in the consolidated financial statements or in the notes thereto.
(b). Exhibits: The list of exhibits in the Exhibit Index immediately preceding the exhibits to this Report is incorporated herein by reference in response to this item.
ITEM 16. FORM 10-K SUMMARY
None.
76
WISDOMTREE, INC.
INDEX TO CONSOLIDATED FINANCIAL STATEMENTS
F-1
Report of Independent Registered Public Accounting Firm
To the Stockholders and the Board of Directors of WisdomTree, Inc.
Opinion on the Financial Statements
We have audited the accompanying consolidated balance sheets of WisdomTree, Inc. and subsidiaries (the Company) as of December 31, 2023 and 2022, the related consolidated statements of operations, comprehensive income, changes in stockholders’ equity and cash flows for each of the three years in the period ended December 31, 2023, and the related notes (collectively referred to as the “consolidated financial statements”). In our opinion, the consolidated financial statements present fairly, in all material respects, the financial position of the Company at December 31, 2023 and 2022, and the results of its operations and its cash flows for each of the three years in the period ended December 31, 2023, in conformity with U.S. generally accepted accounting principles.
We also have audited, in accordance with the standards of the Public Company Accounting Oversight Board (United States) (PCAOB), the Company’s internal control over financial reporting as of December 31, 2023, based on criteria established in Internal Control-Integrated Framework issued by the Committee of Sponsoring Organizations of the Treadway Commission (2013 framework), and our report dated February 23, 2024 expressed an unqualified opinion thereon.
Basis for Opinion
These financial statements are the responsibility of the Company’s management. Our responsibility is to express an opinion on the Company’s financial statements based on our audits. We are a public accounting firm registered with the PCAOB and are required to be independent with respect to the Company in accordance with the U.S. federal securities laws and the applicable rules and regulations of the Securities and Exchange Commission and the PCAOB.
We conducted our audits in accordance with the standards of the PCAOB. Those standards require that we plan and perform the audit to obtain reasonable assurance about whether the financial statements are free of material misstatement, whether due to error or fraud. Our audits included performing procedures to assess the risks of material misstatement of the financial statements, whether due to error or fraud, and performing procedures that respond to those risks. Such procedures included examining, on a test basis, evidence regarding the amounts and disclosures in the financial statements. Our audits also included evaluating the accounting principles used and significant estimates made by management, as well as evaluating the overall presentation of the financial statements. We believe that our audits provide a reasonable basis for our opinion.
Critical Audit Matter
The critical audit matter communicated below is a matter arising from the current period audit of the financial statements that was communicated or required to be communicated to the audit committee and that: (1) relates to accounts or disclosures that are material to the financial statements and (2) involved our especially challenging, subjective or complex judgments. The communication of the critical audit matter does not alter in any way our opinion on the consolidated financial statements, taken as a whole, and we are not, by communicating the critical audit matter below, providing a separate opinion on the critical audit matter or on the accounts or disclosures to which it relates.
|
ETFS Indefinite-Lived Intangible Assets – Assessment of Carrying Value |
||
|
Description of the Matter |
At December 31, 2023, the Company held indefinite-lived intangible assets related to the right to manage assets under management through customary advisory agreements, which have no expiration date, in connection with the ETFS acquisition, with an aggregate carrying value of $601,247,000. As described in Notes 2 and 24 to the consolidated financial statements, these assets were assessed for impairment based upon a quantitative test. Indefinite-lived intangible assets are impaired if their estimated fair values are less than their carrying values. The Company determined the fair value of its ETFS intangible assets using an income approach (discounted cash flow analysis) with significant unobservable inputs that included the weighted average cost of capital and projected revenue growth rates. |
F-2
|
Auditing the Company’s quantitative impairment assessment for its ETFS indefinite-lived intangible assets was complex due to the significant unobservable inputs required in determining fair value. In particular, the fair value estimate of the ETFS indefinite-lived intangible assets was sensitive to the significant unobservable inputs described above which are affected by future economic and market conditions and thus require significant judgment. |
||
|
How we addressed the Matter in Our Audit |
We obtained an understanding, evaluated the design and tested the operating effectiveness of controls over the Company’s indefinite-lived intangible asset impairment assessment process. This included controls around management’s review of the significant unobservable inputs described above and the completeness and accuracy of the inputs to the valuation model. |
|
|
To test the Company’s quantitative impairment assessment of ETFS indefinite-lived intangible assets, our audit procedures included, among others, evaluating the Company’s selection of its fair value methodology, testing the significant unobservable inputs used in the valuation model, evaluating the clerical accuracy of the valuation model and testing the completeness and accuracy of the underlying data used by the Company to determine fair value. For example, we agreed certain inputs used to calculate the weighted average cost of capital to market data. We compared the projected revenue growth rates to the Company’s historical results, to those of other guideline public companies in the same industry, and to historical returns for the underlying asset classes. In addition, we assessed the accuracy of the Company’s historical projections by comparing them to actual operating results. We involved our valuation specialists to assist in our evaluation of the Company’s valuation model, the weighted average cost of capital used by the Company and the comparability of the guideline public companies selected by the Company and to calculate an independent estimate of the indefinite-lived intangible assets which we compared to the Company’s fair value estimate. |
/s/ Ernst & Young LLP
We have served as the Company’s auditor since 2010.
New York, New York
February 23, 2024
F-3
Report of Independent Registered Public Accounting Firm
To the Stockholders and the Board of Directors of WisdomTree, Inc.
Opinion on Internal Control Over Financial Reporting
We have audited WisdomTree, Inc. and subsidiaries’ internal control over financial reporting as of December 31, 2023, based on criteria established in Internal Control—Integrated Framework issued by the Committee of Sponsoring Organizations of the Treadway Commission (2013 framework) (the COSO criteria). In our opinion, WisdomTree, Inc. and subsidiaries (the Company) maintained, in all material respects, effective internal control over financial reporting as of December 31, 2023, based on the COSO criteria.
We also have audited, in accordance with the standards of the Public Company Accounting Oversight Board (United States) (PCAOB), the 2023 consolidated financial statements of the Company and our report dated February 23, 2024, expressed an unqualified opinion thereon.
Basis for Opinion
The Company’s management is responsible for maintaining effective internal control over financial reporting and for its assessment of the effectiveness of internal control over financial reporting included in the accompanying Report of Management on Internal Control over Financial Reporting. Our responsibility is to express an opinion on the Company’s internal control over financial reporting based on our audit. We are a public accounting firm registered with the PCAOB and are required to be independent with respect to the Company in accordance with the U.S. federal securities laws and the applicable rules and regulations of the Securities and Exchange Commission and the PCAOB.
We conducted our audit in accordance with the standards of the PCAOB. Those standards require that we plan and perform the audit to obtain reasonable assurance about whether effective internal control over financial reporting was maintained in all material respects.
Our audit included obtaining an understanding of internal control over financial reporting, assessing the risk that a material weakness exists, testing and evaluating the design and operating effectiveness of internal control based on the assessed risk, and performing such other procedures as we considered necessary in the circumstances. We believe that our audit provides a reasonable basis for our opinion.
Definition and Limitations of Internal Control Over Financial Reporting
A company’s internal control over financial reporting is a process designed to provide reasonable assurance regarding the reliability of financial reporting and the preparation of financial statements for external purposes in accordance with generally accepted accounting principles. A company’s internal control over financial reporting includes those policies and procedures that (1) pertain to the maintenance of records that, in reasonable detail, accurately and fairly reflect the transactions and dispositions of the assets of the company; (2) provide reasonable assurance that transactions are recorded as necessary to permit preparation of financial statements in accordance with generally accepted accounting principles, and that receipts and expenditures of the company are being made only in accordance with authorizations of management and directors of the company; and (3) provide reasonable assurance regarding prevention or timely detection of unauthorized acquisition, use, or disposition of the company’s assets that could have a material effect on the financial statements.
Because of its inherent limitations, internal control over financial reporting may not prevent or detect misstatements. Also, projections of any evaluation of effectiveness to future periods are subject to the risk that controls may become inadequate because of changes in conditions, or that the degree of compliance with the policies or procedures may deteriorate.
/s/
New York, New York
February 23, 2024
F-4
WisdomTree, Inc. and Subsidiaries
Consolidated Balance Sheets
(In Thousands, Except Per Share Amounts)
|
December 31, |
December 31, |
|||||
|
Assets |
||||||
|
Current assets: |
||||||
| Cash and cash equivalents (including $ |
$ |
|
$ |
|
||
| Financial instruments owned, at fair value (including $ |
|
|
|
|
||
| Accounts receivable (including $ |
|
|
|
|
||
|
Prepaid expenses |
|
|
|
|
||
|
Other current assets |
|
|
|
|
||
|
Total current assets |
|
|
|
|
||
|
Fixed assets, net |
|
|
|
|
||
|
Indemnification receivable (Note 22) |
|
|
|
|||
|
Securities held-to-maturity |
|
|
|
|
||
|
Deferred tax assets, net |
|
|
|
|
||
|
Investments (Note 7) |
|
|
|
|
||
|
Right of use assets—operating leases (Note13) |
|
|
|
|
||
|
Goodwill (Note 24) |
|
|
|
|
||
|
Intangible assets, net (Note 24) |
|
|
|
|
||
|
Other noncurrent assets |
|
|
|
|
||
|
Total assets |
$ |
|
$ |
|
||
|
Liabilities and stockholders’ equity |
|
|
||||
|
Liabilities |
|
|
||||
|
Current liabilities: |
|
|
||||
|
Fund management and administration payable |
$ |
|
$ |
|
||
|
Compensation and benefits payable |
|
|
|
|
||
|
Payable to Gold Bullion Holdings (Jersey) Limited (“GBH”) (Note 12) |
|
|
|
— |
||
|
Income taxes payable |
|
|
|
|
||
|
Operating lease liabilities (Note 13) |
|
|
|
|
||
|
Convertible notes—current (Note 10) |
|
|
|
|||
|
Deferred consideration—gold payments (Note 9) |
|
|
|
|||
|
Accounts payable and other liabilities |
|
|
|
|
||
|
Total current liabilities |
|
|
|
|
||
|
Convertible notes (Note 10) |
|
|
|
|
||
|
Payable to GBH (Note 12) |
|
|
|
— |
||
|
Deferred consideration—gold payments (Note 9) |
|
|
|
|||
|
Operating lease liabilities (Note 13) |
|
|
|
|||
|
Other noncurrent liabilities (Note 22) |
|
|
|
|||
|
Total liabilities |
|
|
|
|
||
| Preferred stock—Series A Non-Voting Convertible, par value $ |
|
|
|
|
||
|
Contingencies (Note 14) |
|
|
||||
|
Stockholders’ equity |
|
|
||||
| Preferred stock, par value $ |
|
|
||||
| Common stock, par value $ |
|
|
|
|
||
|
Additional paid-in capital |
|
|
|
|
||
|
Accumulated other comprehensive loss |
|
( |
|
( | ||
|
Retained earnings |
|
|
|
|
||
|
Total stockholders’ equity |
|
|
|
|
||
|
Total liabilities and stockholders’ equity |
$ |
|
$ |
|
||
The accompanying notes are an integral part of these consolidated financial statements
F-5
WisdomTree, Inc. and Subsidiaries
Consolidated Statements of Operations
(In Thousands, Except Per Share Amounts)
|
Year Ended December 31, |
|||||||||
|
2023 |
2022 |
2021 |
|||||||
|
Operating Revenues: |
|||||||||
|
Advisory fees |
$ |
|
$ |
|
$ |
|
|||
|
Other income |
|
|
|
|
|
|
|||
|
Total revenues |
|
|
|
|
|
|
|||
|
Operating Expenses: |
|
|
|
||||||
|
Compensation and benefits |
|
|
|
|
|
|
|||
|
Fund management and administration |
|
|
|
|
|
|
|||
|
Marketing and advertising |
|
|
|
|
|
|
|||
|
Sales and business development |
|
|
|
|
|
|
|||
|
Contractual gold payments (Note 9) |
|
|
|
|
|
|
|||
|
Professional fees |
|
|
|
|
|
|
|||
|
Occupancy, communications and equipment |
|
|
|
|
|
|
|||
|
Depreciation and amortization |
|
|
|
|
|
|
|||
|
Third-party distribution fees |
|
|
|
|
|
|
|||
|
Other |
|
|
|
|
|
|
|||
|
Total operating expenses |
|
|
|
|
|
|
|||
|
Operating income |
|
|
|
|
|
|
|||
|
Other Income/(Expenses): |
|
|
|
||||||
|
Interest expense |
|
( |
|
( |
|
( |
|||
|
Gain on revaluation/termination of deferred consideration—gold payments (Note 9) |
|
|
|
|
|
|
|||
|
Interest income |
|
|
|
|
|
|
|||
|
Impairments (Note 26) |
|
( |
|
|
( |
||||
|
Loss on extinguishment of debt (Note 10) |
|
( |
|
|
|||||
|
Other losses, net |
|
( |
|
( |
|
( |
|||
|
Income before income taxes |
|
|
|
|
|
|
|||
|
Income tax expense/(benefit) |
|
|
|
( |
|
|
|||
|
Net income |
$ |
|
$ |
|
$ |
|
|||
|
Earnings per share—basic |
$ |
|
$ |
|
$ |
|
|||
|
Earnings per share—diluted |
$ |
|
$ |
|
$ |
|
|||
|
Weighted-average common shares—basic |
|
|
|
|
|
|
|||
|
Weighted-average common shares—diluted |
|
|
|
|
|
|
|||
|
Cash dividends declared per common share |
$ |
|
$ |
|
$ |
|
|||
The accompanying notes are an integral part of these consolidated financial statements
F-6
WisdomTree, Inc. and Subsidiaries
Consolidated Statements of Comprehensive Income
(In Thousands)
|
Year Ended December 31, |
|||||||||
|
2023 |
2022 |
2021 |
|||||||
|
Net income |
$ |
|
$ |
|
$ |
|
|||
|
Other comprehensive income/(loss) |
|
|
|
||||||
|
Foreign currency translation adjustment, net of income taxes |
|
|
|
( |
|
( |
|||
|
Other comprehensive income/(loss) |
|
|
|
( |
|
( |
|||
|
Comprehensive income |
$ |
|
$ |
|
$ |
|
|||
The accompanying notes are an integral part of these consolidated financial statements
F-7
WisdomTree, Inc. and Subsidiaries
Consolidated Statements of Changes in Stockholders’ Equity
(In Thousands)
|
Series C Preferred |
Common Stock |
Additional |
Accumulated |
(Accumulated |
Total |
|||||||||||||||||
|
Shares |
Par |
Shares |
Par |
|||||||||||||||||||
|
Balance—December 31, 2020 |
$ |
|
$ |
|
$ |
|
$ |
|
$ |
( |
$ |
|
||||||||||
| Reclassification of equity component related to convertible notes, net of deferred taxes of $ |
— |
|
— |
|
|
( |
|
|
|
|
( |
|||||||||||
|
Balance—January 1, 2021 (as adjusted) |
|
|
$ |
|
|
|
$ |
|
$ |
( |
$ |
|
||||||||||
|
Restricted stock issued and vesting of restricted stock units, net |
|
|
|
|
|
( |
|
|
|
|||||||||||||
|
Shares repurchased |
|
( |
|
( |
|
( |
|
|
|
( |
||||||||||||
|
Exercise of stock options, net |
|
|
|
|
|
|
|
|
|
|
||||||||||||
|
Stock-based compensation |
— |
|
— |
|
|
|
|
|
|
|
||||||||||||
|
Other comprehensive loss |
— |
|
— |
|
|
|
( |
|
|
( |
||||||||||||
|
Dividends |
— |
|
— |
|
|
|
|
( |
|
( |
||||||||||||
|
Net income |
— |
|
— |
|
|
|
|
|
|
|
||||||||||||
|
Balance—December 31, 2021 |
|
|
$ |
|
$ |
|
$ |
|
$ |
( |
$ |
|
||||||||||
|
Restricted stock issued and vesting of restricted stock units, net |
|
|
|
|
|
( |
|
|
|
|||||||||||||
|
Shares repurchased |
|
( |
|
( |
|
( |
|
|
|
( |
||||||||||||
|
Stock-based compensation |
— |
|
— |
|
|
|
|
|
|
|
||||||||||||
|
Other comprehensive loss |
— |
|
— |
|
|
|
( |
|
|
( |
||||||||||||
|
Dividends |
— |
|
— |
|
|
( |
|
|
( |
|
( |
|||||||||||
|
Net income |
— |
|
— |
|
|
|
|
|
|
|
||||||||||||
|
Balance—December 31, 2022 |
|
|
$ |
|
$ |
|
$ |
( |
$ |
|
$ |
|
||||||||||
|
Restricted stock issued and vesting of restricted stock units, net |
|
|
|
|
|
( |
|
|
|
|||||||||||||
|
Shares issued in connection with convertible notes that matured on June 15, 2023 (Note 10) |
|
|
|
|
|
|
|
|
|
|
||||||||||||
|
Shares issued in connection with termination of the deferred consideration—gold payments obligation, net of issuance costs (Note 9) |
|
|
|
|
|
|
|
|
|
|||||||||||||
|
Shares repurchased that were issued in connection with termination of the deferred consideration—gold payments obligation, net of issuance costs (Notes 12 and 23) |
( |
|
|
|
( |
|
|
|
( |
|||||||||||||
|
Shares repurchased |
|
( |
|
( |
|
( |
|
|
|
( |
||||||||||||
|
Stock-based compensation |
— |
|
— |
|
|
|
|
|
|
|
||||||||||||
|
Other comprehensive income |
— |
|
— |
|
|
|
|
|
|
|
||||||||||||
|
Dividends |
— |
|
— |
|
|
|
|
( |
|
( |
||||||||||||
|
Net income |
— |
|
— |
|
|
|
|
|
|
|
||||||||||||
|
Balance—December 31, 2023 |
|
|
|
|
|
|
|
( |
|
|
|
|
||||||||||
The accompanying notes are an integral part of these consolidated financial statements
F-8
WisdomTree, Inc. and Subsidiaries
Consolidated Statements of Cash Flows
(In Thousands)
|
Year Ended December 31, |
|||||||||
|
2023 |
2022 |
2021 |
|||||||
|
Cash flows from operating activities: |
|||||||||
|
Net income |
$ |
|
$ |
|
$ |
|
|||
|
Adjustments to reconcile net income to net cash provided by operating activities: |
|
|
|
||||||
|
Gain on revaluation of deferred consideration—gold payments |
|
( |
|
( |
|
( |
|||
|
Advisory fees received in gold and other precious metals |
|
( |
|
( |
|
( |
|||
|
Stock-based compensation |
|
|
|
|
|
|
|||
|
Loss on extinguishment of debt |
|
|
|
|
|||||
|
Impairments |
|
|
|
|
|
||||
|
Contractual gold payments |
|
|
|
|
|
|
|||
|
Amortization of issuance costs—convertible notes |
|
|
|
|
|
|
|||
|
Amortization of right of use asset |
|
|
|
|
|
|
|||
|
Depreciation and amortization |
|
|
|
|
|
|
|||
|
Losses on financial instruments owned, at fair value |
|
|
|
|
|
|
|||
|
Deferred income taxes |
|
( |
|
( |
|
|
|||
|
Imputed interest on payable to GBH |
|
|
|
|
|||||
|
Losses on investments |
|
|
|
|
|||||
|
Gain on sale—Canadian ETF business, including remeasurement of contingent consideration |
|
|
|
( |
|||||
|
Other |
|
|
( |
|
( |
||||
|
Changes in operating assets and liabilities: |
|
|
|
||||||
|
Accounts receivable |
|
( |
|
( |
|
( |
|||
|
Prepaid expenses |
|
( |
|
( |
|
( |
|||
|
Gold and other precious metals |
|
|
|
|
|
|
|||
|
Other assets |
|
|
|
( |
|
( |
|||
|
Fund management and administration payable |
|
|
|
|
|
|
|||
|
Compensation and benefits payable |
|
|
|
|
|
|
|||
|
Income taxes payable |
|
|
|
( |
|
|
|||
|
Operating lease liabilities |
|
( |
|
( |
|
( |
|||
|
Accounts payable and other liabilities |
|
|
|
( |
|
( |
|||
|
Net cash provided by operating activities |
|
|
|
|
|
|
|||
|
Cash flows from investing activities: |
|
|
|
||||||
|
Purchase of financial instruments owned, at fair value |
|
( |
|
( |
|
( |
|||
|
Purchase of investments |
|
( |
|
( |
|
( |
|||
|
Cash paid—software development |
|
( |
|
— |
|
— |
|||
|
Cash paid—acquisition of Securrency Transfers, Inc. (net of cash acquired) |
|
( |
|
|
— |
||||
|
Purchase of fixed assets |
|
( |
|
( |
|
( |
|||
|
Proceeds from the sale of financial instruments owned, at fair value |
|
|
|
|
|
|
|||
|
Proceeds from the exit from investment in Securrency, Inc. |
|
|
|
|
|||||
|
Proceeds from receipt of contingent consideration related to the sale of Canadian ETF business |
|
|
|
|
|
||||
|
Proceeds from held-to-maturity securities maturing or called prior to maturity |
|
|
|
|
|
|
|||
|
Net cash provided by/(used in) investing activities |
|
|
|
( |
|
( |
|||
F-9
WisdomTree, Inc. and Subsidiaries
Consolidated Statements of Cash Flows—(Continued)
(In Thousands)
|
Year Ended December 31, |
|||||||||
|
2023 |
2022 |
2021 |
|||||||
|
Cash flows from financing activities: |
|||||||||
|
Repurchase and maturity of convertible notes |
|
( |
|
|
|||||
|
Termination of deferred consideration—gold payments |
|
( |
|
|
|||||
|
Repurchase of Series C Preferred Stock |
|
( |
|
|
|||||
|
Dividends paid |
|
( |
|
( |
|
( |
|||
|
Shares repurchased |
|
( |
|
( |
|
( |
|||
|
Issuance costs—convertible notes |
|
( |
|
|
( |
||||
|
Issuance costs—Series C Preferred Stock |
|
( |
|
— |
|
— |
|||
|
Proceeds from the issuance of convertible notes (Note 10) |
|
|
|
|
|
||||
|
Proceeds from exercise of stock options |
|
|
|
|
|||||
|
Net cash (used in)/provided by financing activities |
|
( |
|
( |
|
|
|||
|
Increase/(decrease) in cash flow due to changes in foreign exchange rate |
|
|
|
( |
|
( |
|||
|
Net (decrease)/increase in cash and cash equivalents |
|
( |
|
( |
|
|
|||
|
Cash and cash equivalents—beginning of year |
|
|
|
|
|
|
|||
|
Cash and cash equivalents—end of year |
$ |
|
$ |
|
$ |
|
|||
|
Supplemental disclosure of cash flow information: |
|
|
|
||||||
|
Cash paid for income taxes |
$ |
|
$ |
|
$ |
|
|||
|
Cash paid for interest |
$ |
|
$ |
|
$ |
|
|||
NON-CASH ACTIVITIES
On January 1, 2021, the Company reclassified the equity component related to the convertible notes, net of deferred taxes, reducing accumulated deficit by $616, increasing the carrying value of the convertible notes by $4,088, reducing additional paid in capital by $3,682 and reducing deferred tax liabilities by $1,022, upon the implementation of Accounting Standards Update (“ASU”) 2020-06, Debt – Debt with Conversion and Other Options (Note 10).
On May 10, 2023, the Company issued 13.087 shares of Series C Non-Voting Convertible Preferred Stock (the “Series C Preferred Stock”) (valued at $86,898) in connection with the termination of its deferred consideration—gold payments obligation. Those shares were subsequently repurchased on November 20, 2023 for aggregate consideration of approximately $84,411, with $40,000 paid on the closing date and the remainder of the purchase price payable in equal annual installments on the first, second and third anniversaries of the closing date, with no requirement to pay interest. See Notes 11 and 12 for additional information.
On June 15, 2023, the Company issued 1,037 shares of common stock (as the conversion option was in the money) in connection with the maturity of $60,000 aggregate principal amount of 4.25% Convertible Senior Notes due 2023.
The accompanying notes are an integral part of these consolidated financial statements
F-10
WisdomTree, Inc. and Subsidiaries
Notes to Consolidated Financial Statements
(In Thousands, Except Share and Per Share Amounts)
1. Organization and Description of Business
WisdomTree, Inc., through its global subsidiaries (collectively, “WisdomTree” or the “Company”), is a global financial innovator, offering a well-diversified suite of exchange-traded products (“ETPs”), models, solutions and products leveraging blockchain technology. Building on its heritage of innovation, the Company is also developing and has launched next-generation digital products, services and structures, including digital or blockchain-enabled mutual funds (“Digital Funds”) and tokenized assets, as well as its blockchain-native digital wallet, WisdomTree Prime. The Company has the following wholly-owned operating subsidiaries:
• WisdomTree Asset Management, Inc. is a New York based investment adviser registered with the SEC, providing investment advisory and other management services to the WisdomTree Trust (“WTT”) and WisdomTree exchange-traded funds (“ETFs”). The WisdomTree ETFs are issued in the U.S. by WTT. WTT is a non-consolidated Delaware statutory trust registered with the SEC as an open-end management investment company. The Company has licensed to WTT the use of certain of its own indexes on an exclusive basis for the WisdomTree ETFs in the U.S.
• WisdomTree Management Jersey Limited (“ManJer”) is a Jersey based management company providing management services to seven issuers (the “ManJer Issuers”) in respect of the ETPs issued and listed by the ManJer Issuers covering commodity, currency, cryptocurrency and leveraged-and-inverse strategies.
• WisdomTree Multi Asset Management Limited (“WTMAML”) is a Jersey based management company providing management services to WisdomTree Multi Asset Issuer PLC (“WMAI”) in respect of the ETPs issued by WMAI. WMAI is a non-consolidated public limited company domiciled in Ireland.
• WisdomTree Management Limited (“WML”) is an Ireland based management company providing management services to WisdomTree Issuer ICAV (“WTICAV”) in respect of the WisdomTree UCITS ETFs issued by WTICAV. WTICAV is a non-consolidated public limited company domiciled in Ireland.
• WisdomTree UK Limited (“WTUK”) is a U.K. based company registered with the Financial Conduct Authority currently providing distribution and support services to ManJer, WTMAML and WML.
• WisdomTree Europe Limited is a U.K. based company which is the legacy distributor of the WMAI ETPs and WisdomTree UCITS ETFs. These services are now provided directly by WTUK. WisdomTree Europe Limited is no longer regulated and does not provide any regulated services.
• WisdomTree Ireland Limited is an Ireland based company authorized by the Central Bank of Ireland providing distribution services to ManJer, WTMAML and WML.
• WisdomTree Digital Commodity Services, LLC is a New York based company that serves as the sponsor of the WisdomTree Bitcoin Fund, which is currently effective with the SEC. The WisdomTree Bitcoin Fund is an exchange-traded fund that issues common shares of beneficial interest and is listed on the Cboe BZX Exchange, Inc. The WisdomTree Bitcoin Fund provides exposure to the spot price of bitcoin.
• WisdomTree Digital Management, Inc. (“WT Digital Management”) is a New York based investment adviser registered with the SEC, providing investment advisory and other management services to the WisdomTree Digital Trust (“WTDT”) and WisdomTree Digital Funds. The WisdomTree Digital Funds are issued in the U.S. by WTDT. WTDT is a non-consolidated Delaware statutory trust registered with the SEC as an open-end management investment company. Each Digital Fund uses blockchain technology to maintain a secondary record of its shares on one or more blockchains (e.g., Stellar or Ethereum), but does not directly or indirectly invest in any assets that rely on blockchain technology, such as cryptocurrencies.
• WisdomTree Digital Movement, Inc. (“WT Digital Movement”) is a New York based company operating as a money services business registered with the Financial Crimes Enforcement Network. WT Digital Movement has obtained and is seeking additional state money transmitter licenses to operate a platform for the purchase, sale and exchange of tokenized assets, while also providing blockchain-native digital wallet services through WisdomTree Prime to facilitate such activity.
F-11
• WisdomTree Securities, Inc. is a New York based limited purpose broker-dealer (i.e., mutual fund retailer), facilitating transactions in WisdomTree Digital Funds.
• WisdomTree Transfers, Inc. is a New York based transfer agent registered with the SEC, providing transfer agency and registrar services for the Digital Funds. The transfer agent maintains the official record of share ownership in book entry form and reconciles the official record with the secondary record of ownership of shares on one or more blockchains.
• WisdomTree Digital Trust Company, LLC is a New York based limited liability trust company that has been formed to operate as a limited purpose trust company under New York Banking Law upon receiving a charter from the New York State Department of Financial Services.
2. Significant Accounting Policies
Basis of Presentation
These consolidated financial statements have been prepared in conformity with U.S. generally accepted accounting principles (“GAAP”) and in the opinion of management reflect all adjustments, consisting of only normal recurring adjustments, necessary for a fair presentation of the financial statements. The consolidated financial statements include the accounts of the Company’s wholly-owned subsidiaries. All intercompany accounts and transactions have been eliminated in consolidation.
Consolidation
The Company consolidates entities in which it has a controlling financial interest. The Company determines whether it has a controlling financial interest in an entity by first evaluating whether the entity is a voting interest entity (“VOE”) or a variable interest entity (“VIE”). The usual condition for a controlling financial interest in a VOE is ownership of a majority voting interest. If the Company has a majority voting interest in a VOE, the entity is consolidated. The Company has a controlling financial interest in a VIE when the Company has a variable interest that provides it with (i) the power to direct the activities of the VIE that most significantly impact the VIE’s economic performance and (ii) the obligation to absorb losses of the VIE or the right to receive benefits from the VIE that could potentially be significant to the VIE.
The Company reassesses its evaluation of whether an entity is a VOE or VIE when certain reconsideration events occur.
Segment and Geographic Information
The Company, through its subsidiaries in the U.S. and Europe, conducts business as a single operating segment as an ETP sponsor and asset manager which is based upon the Company’s current organizational and management structure, as well as information used by the chief operating decision maker to allocate resources and other factors.
Foreign Currency Translation
Assets and liabilities of subsidiaries whose functional currency is not the U.S. dollar are translated based on the end of period exchange rates from local currency to U.S. dollars. Results of operations are translated at the average exchange rates in effect during the period. The impact of the foreign currency translation adjustment is included in the Consolidated Statements of Comprehensive Income as a component of other comprehensive income/(loss).
Use of Estimates
The preparation of the Company’s consolidated financial statements in conformity with U.S. GAAP requires management to make estimates and assumptions that affect the reported amounts of assets and liabilities as of the balance sheet dates and the reported amounts of revenues and expenses for the periods presented. Actual results could differ materially from those estimates.
Revenue Recognition
The Company earns substantially all of its revenue in the form of advisory fees from its ETPs and recognizes this revenue over time, as the performance obligation is satisfied. Advisory fees are based on a percentage of the ETPs’ average daily net assets. Progress is measured using the practical expedient under the output method resulting in the recognition of revenue in the amount for which the Company has a right to invoice.
F-12
Contractual Gold Payments
Contractual gold payments are measured and paid monthly based upon the average daily spot price of gold (Note 9). The Company’s obligation to continue making these payments terminated on May 10, 2023.
Marketing and Advertising
Marketing and advertising costs, including media advertising and production costs, are expensed when incurred.
Depreciation and Amortization
|
Equipment |
|
|
|
Internally-developed software |
|
The assets listed above are recorded at cost less accumulated depreciation and amortization.
Stock-Based Awards
Accounting for stock-based compensation requires the measurement and recognition of compensation expense for all equity awards based on estimated fair values. Stock-based compensation is measured based on the grant-date fair value of the award and is amortized over the relevant service period. Forfeitures are recognized when they occur.
Third-Party Distribution Fees
The Company pays a percentage of its advisory fee revenues based on incremental growth in assets under management (“AUM”), subject to caps or minimums, to marketing agents to sell WisdomTree ETPs and for including WisdomTree ETPs on third-party customer platforms and recognizes these expenses as incurred.
Cash and Cash Equivalents
The Company considers all highly liquid investments with an original maturity of 90 days or less at the time of purchase to be classified as cash equivalents. The Company maintains deposits with financial institutions in an amount that is in excess of federally insured limits.
Accounts Receivable
Accounts receivable are customer and other obligations due under normal trade terms. The Company measures credit losses, if any, by applying historical loss rates, adjusted for current conditions and reasonable and supportable forecasts to amounts outstanding using the aging method.
Impairment of Long-Lived Assets
The Company performs a review for the impairment of long-lived assets when events or changes in circumstances indicate that the estimated undiscounted future cash flows expected to be generated by the assets are less than their carrying amounts or when other events occur which may indicate that the carrying amount of an asset may not be recoverable.
Financial Instruments Owned and Financial Instruments Sold, but Not yet Purchased (at Fair Value)
Financial instruments owned and financial instruments sold, but not yet purchased are financial instruments classified as either trading or available-for-sale (“AFS”). These financial instruments are recorded on their trade date and are measured at fair value. All equity instruments that have readily determinable fair values are classified by the Company as trading. Debt instruments are classified based primarily on the Company’s intent to hold or sell the instrument. Changes in the fair value of debt instruments classified as trading and AFS are reported in other income/(expenses) and other comprehensive income, respectively, in the period the change occurs. Debt instruments classified as AFS are assessed for impairment on a quarterly basis and an estimate for credit loss is provided when the fair value of the AFS debt instrument is below its amortized cost basis. Credit-related impairments are recognized in earnings with a corresponding adjustment to the instrument’s amortized cost basis if the Company intends to sell the impaired AFS debt instrument or it is more likely than not the Company will be required to sell the instrument before recovering its amortized cost basis. Other credit-related impairments are recognized as an allowance with a corresponding adjustment to earnings. Impairments resulting from noncredit-related factors are recognized in other comprehensive income. Amounts recorded in other comprehensive income are reclassified into earnings upon sale of the AFS debt instrument using the specific identification method.
F-13
Securities Held-to-Maturity
The Company accounts for certain of its securities as held-to-maturity on a trade date basis, which are recorded at amortized cost. For held-to-maturity securities, the Company has the intent and ability to hold these securities to maturity and it is not more-likely-than-not that the Company will be required to sell these securities before recovery of their amortized cost bases, which may be maturity. Held-to-maturity securities are placed on non-accrual status when the Company is in receipt of information indicating collection of interest is doubtful. Cash received on held-to-maturity securities placed on non-accrual status is recognized on a cash basis as interest income if and when received.
The Company reviews its portfolio of held-to-maturity securities for impairment on a quarterly basis, recognizing an allowance, if any, by applying an estimated loss rate after consideration for the nature of collateral securing the financial asset as well as potential future changes in collateral values and historical loss information for financial assets secured with similar collateral.
Investments in pass-through government-sponsored enterprises (“GSEs”) are determined to have an estimated loss rate of zero due to an implicit U.S. government guarantee.
Investments
The Company accounts for equity investments that do not have a readily determinable fair value under the measurement alternative prescribed in Accounting Standards Codification (“ASC”) Topic 321, Investments – Equity Securities (“ASC 321”), to the extent such investments are not subject to consolidation or the equity method. Under the measurement alternative, these financial instruments are carried at cost, less any impairment (assessed quarterly), plus or minus changes resulting from observable price changes in orderly transactions for an identical or similar investment of the same issuer. In addition, income is recognized when dividends are received only to the extent they are distributed from net accumulated earnings of the investee. Otherwise, such distributions are considered returns of investment and are recorded as a reduction of the cost of the investment.
Investments in debt instruments are accounted for at fair value, with changes in fair value reported in other income/(expenses).
Goodwill
Goodwill is the excess of the purchase price over the fair values of the identifiable net assets at the acquisition date. The Company tests goodwill for impairment at least annually and at the time of a triggering event requiring re-evaluation, if one were to occur. Goodwill is considered impaired when the estimated fair value of the reporting unit that was allocated the goodwill is less than its carrying value. If the estimated fair value of such reporting unit is less than its carrying value, goodwill impairment is recognized based on that difference, not to exceed the carrying amount of goodwill. A reporting unit is an operating segment or a component of an operating segment provided that the component constitutes a business for which discrete financial information is available and management regularly reviews the operating results of that component.
Goodwill is allocated to the Company’s U.S. business and European business components. For impairment testing purposes, these components are aggregated as a single reporting unit as they fall under the same operating segment and have similar economic characteristics.
Goodwill is assessed for impairment annually on November 30th. When performing its goodwill impairment test, the Company considers a qualitative assessment, when appropriate, and a quantitative assessment using the market approach and its market capitalization when determining the fair value of the reporting unit.
Intangible Assets
Indefinite-lived intangible assets are tested for impairment at least annually and are also reviewed for impairment whenever events or changes in circumstances indicate that the carrying amount of an asset may not be recoverable. Indefinite-lived intangible assets are impaired if their estimated fair values are less than their carrying values.
Finite-lived intangible assets, if any, are amortized over their estimated useful life, which is the period over which the assets are expected to contribute directly or indirectly to the future cash flows of the Company. These intangible assets are tested for impairment at the time of a triggering event, if one were to occur. Finite-lived intangible assets may be impaired when the estimated undiscounted future cash flows generated from the assets are less than their carrying amounts.
F-14
The Company may rely on a qualitative assessment when performing its intangible asset impairment test. Otherwise, the impairment evaluation is performed at the lowest level of reasonably identifiable cash flows independent of other assets. The annual impairment testing date for all of the Company’s intangible assets is November 30th.
Software Development Costs
Software development costs incurred after the preliminary project stage is complete are capitalized if it is probable that the project will be completed and the software will be used as intended. Capitalized costs consist of employee compensation costs and fees paid to third parties who are directly involved in the application development efforts and are included in intangible assets, net in the Consolidated Balance Sheets. Such costs are amortized over the estimated useful life of the software on a straight-line basis and are included in depreciation and amortization in the Consolidated Statements of Operations. Once the application development stage is complete, additional costs are expensed as incurred.
Leases
The Company accounts for its lease obligations in accordance with ASC Topic 842, Leases (“ASC 842”), which requires the recognition of both (i) a lease liability equal to the present value of the remaining lease payments and (ii) an offsetting right-of-use asset. The remaining lease payments are discounted using the rate implicit in the lease, if known, or otherwise the Company’s incremental borrowing rate. After lease commencement, right-of-use assets are assessed for impairment and otherwise are amortized over the remaining lease term on a straight-line basis. These recognition requirements are not applied to short-term leases which are those with a lease term of 12 months or less. Instead, lease payments associated with short-term leases are recognized as an expense on a straight-line basis over the lease term.
ASC 842 also provides a practical expedient which allows for consideration in a contract to be accounted for as a single lease component rather than allocated between lease and non-lease components. The Company has elected to apply this practical expedient to all lease contracts, where applicable.
Deferred Consideration—Gold Payments
Deferred consideration—gold payments represented the present value of an obligation to pay gold to a third party into perpetuity and was measured using forward-looking gold prices observed on the CMX exchange, a selected discount rate and perpetual growth rate (Note 9). Changes in the fair value of this obligation were reported as gain on revaluation/termination of deferred consideration—gold payments in the Consolidated Statements of Operations.
Convertible Notes
Convertible notes are carried at amortized cost, net of issuance costs. The Company accounts for convertible instruments as a single liability (applicable to the convertible notes) or equity with no separate accounting for embedded conversion features unless the conversion feature meets the criteria for accounting under the substantial premium model or does not qualify for a derivative scope exception. Interest expense is recognized using the effective interest method and includes amortization of issuance costs over the life of the debt.
Contingencies
The Company may be subject to reviews, inspections and investigations by regulatory authorities as well as legal proceedings arising in the ordinary course of business. The Company evaluates the likelihood of an unfavorable outcome of all legal or regulatory proceedings to which it is a party and accrues a loss contingency when the loss is probable and reasonably estimable.
Contingent Payments
The Company recognizes a gain on contingent payments when the contingency is resolved and the gain is realized.
F-15
Earnings per Share
Basic earnings per share (“EPS”) is computed by dividing net income available to common stockholders by the weighted-average number of common shares outstanding for the period. Net income available to common stockholders represents net income of the Company reduced by an allocation of earnings to participating securities. The Series A non-voting convertible preferred stock (Note 11) and unvested share-based payment awards that contain non-forfeitable rights to dividends or dividend equivalents (whether paid or unpaid) are participating securities and are included in the computation of EPS pursuant to the two-class method. Stock-based equity awards that do not contain such rights are not deemed participating securities and are included in diluted shares outstanding (if dilutive).
Diluted EPS is calculated under the treasury stock method and the two-class method. The calculation that results in the lowest diluted EPS amount for the common stock is reported in the Company’s consolidated financial statements. The treasury stock method includes the dilutive effect of potential common shares including unvested stock-based awards, the Series A non-voting convertible preferred stock and the convertible notes, if any. Potential common shares associated with the Series A non-voting convertible preferred stock and the convertible notes are computed under the if-converted method. Potential common shares associated with the conversion option embedded in the convertible notes are dilutive when the Company’s average stock price exceeds the conversion price.
Income Taxes
The Company accounts for income taxes using the liability method, which requires the determination of deferred tax assets and liabilities based on the differences between the financial and tax bases of assets and liabilities using the enacted tax rates in effect for the year in which differences are expected to reverse. Deferred tax assets are reduced by a valuation allowance if, based on the weight of available evidence, it is more-likely-than-not that some portion or all the deferred tax assets will not be realized.
Tax positions are evaluated utilizing a two-step process. The Company first determines whether any of its tax positions are more-likely-than-not to be sustained upon examination, based solely on the technical merits of the position. Once it is determined that a position meets this recognition threshold, the position is measured as the largest amount of benefit that is greater than
The Global Intangible Low-Taxed Income (“GILTI”) provisions of the Tax Reform Act requires the Company to include in its U.S. income tax return foreign subsidiary earnings in excess of an allowable return on the foreign subsidiary’s tangible assets. An accounting policy election is available to either account for the tax effects of GILTI in the period that is subject to such taxes or to provide deferred taxes for book and tax basis differences that upon reversal may be subject to such taxes. The Company accounts for the tax effects of these provisions in the period that is subject to such tax.
Non-income based taxes are recorded as part of other liabilities and other expenses.
Recently Issued Accounting Pronouncements
On November 27, 2023, the Financial Accounting Standards Board (“FASB”) issued ASU 2023-07, Segment Reporting—Improvements to Reportable Segment Disclosures, which requires public entities to provide disclosures of significant segment expenses and other segment items. The guidance requires public entities to provide in interim periods all disclosures about a reportable segment’s profit or loss and assets that are currently required annually and also applies to public entities with a single reportable segment. Entities are permitted to disclose more than one measure of a segment’s profit or loss if such measures are used by the chief operating decision-maker to allocate resources and assess performance, as long as at least one of those measures is determined in a way that is most consistent with the measurement principles used to measure the corresponding amounts in the consolidated financial statements. The guidance is applied retrospectively to all periods presented in financial statements, unless it is impracticable, and is effective for fiscal years beginning after December 15, 2023, and for interim periods beginning after December 15, 2024. Early adoption is permitted. This standard will only impact disclosures and will be adopted by the Company on January 1, 2024.
F-16
On December 13, 2023, the FASB issued ASU 2023-08, Accounting for and Disclosure of Crypto Assets, which contains final guidance requiring all entities to measure certain crypto assets at fair value each reporting period and to reflect changes from remeasurement in net income. Entities are required to present crypto assets measured at fair value separately from other intangible assets on the balance sheet and present changes from the remeasurement of crypto assets separately from changes in the carrying amounts of other intangible assets in the income statement. Entities are required to provide interim and annual disclosures about the types of crypto assets they hold and any changes in their holdings of crypto assets. The guidance is effective for fiscal years beginning after December 15, 2024, including interim periods within those fiscal years. Early adoption is permitted. The Company has determined that this standard will not have a material impact on its financial statements and will early adopt the standard on January 1, 2024.
On December 14, 2023, the FASB issued ASU 2023-09, Improvements to Income Tax Disclosures, which establishes new income tax disclosure requirements in addition to modifying and eliminating certain existing requirements. Under the new guidance, entities must consistently categorize and provide greater disaggregation of information in the rate reconciliation. They must also further disaggregate income taxes paid. The standard is intended to benefit investors by providing more detailed income tax disclosures that would be useful in making capital allocation decisions. The guidance applies to all entities subject to income taxes and is effective for annual periods beginning after December 15, 2024. The guidance will be applied on a prospective basis with the option to apply the standard retrospectively. Early adoption is permitted. The Company plans to adopt this standard on January 1, 2025.
Recently Adopted Accounting Pronouncements
On January 1, 2021, the Company early adopted ASU 2020-06, Debt – Debt with Conversion and Other Options (ASU 2020-06) under the modified retrospective approach. Under the ASU, the accounting for convertible instruments was simplified by removing major separation models required under current GAAP. Accordingly, more convertible instruments are reported as a single liability or equity with no separate accounting for embedded conversion features. Certain settlement conditions that are required for equity contracts to qualify for the derivative scope exception are removed and, as a result, more equity contracts will qualify for the scope exception. The ASU also simplifies the diluted earnings-per-share calculation in certain areas. Upon the adoption of this ASU, the Company reclassified the equity component related to the convertible notes, net of deferred taxes, reducing accumulated deficit by $
3. Cash and Cash Equivalents
Of the total cash and cash equivalents of $
Certain of the Company’s subsidiaries are required to maintain a minimum level of regulatory capital, which was $
F-17
4. Fair Value Measurements
The fair value of financial instruments is defined as the price that would be received to sell an asset or paid to transfer a liability (i.e., “the exit price”) in an orderly transaction between market participants at the measurement date. ASC 820, Fair Value Measurement, establishes a hierarchy for inputs used in measuring fair value that maximizes the use of observable inputs and minimizes the use of unobservable inputs by requiring that the most observable inputs be used when available. Observable inputs are inputs that market participants would use in pricing the asset or liability developed based on market data obtained from independent sources. Unobservable inputs reflect assumptions that market participants would use in pricing the asset or liability developed based on the best information available in the circumstances. The hierarchy is broken down into three levels based on the transparency of inputs as follows:
|
Level 1 |
— |
Quoted prices for identical instruments in active markets. |
||||
|
Level 2 |
— |
Quoted prices for similar instruments in active markets; quoted prices for identical or similar instruments in markets that are not active; and model-derived valuations whose inputs are observable or whose significant value drivers are observable. |
||||
|
Level 3 |
— |
Instruments whose significant drivers are unobservable. |
The availability of observable inputs can vary from product to product and is affected by a wide variety of factors, including, for example, the type of product, whether the product is new and not yet established in the marketplace, and other characteristics particular to the transaction. To the extent that valuation is based on models or inputs that are less observable or unobservable in the market, the determination of fair value requires more judgment. Accordingly, the degree of judgment exercised by management in determining fair value is greatest for instruments categorized in Level 3. In certain cases, the inputs used to measure fair value may fall into different levels of the fair value hierarchy. In such cases, for disclosure purposes, the level in the fair value hierarchy within which the fair value measurement in its entirety falls is determined based on the lowest level input that is significant to the fair value measurement in its entirety.
|
December 31, 2023 |
||||||||||||
|
Total |
Level 1 |
Level 2 |
Level 3 |
|||||||||
|
Assets: |
||||||||||||
|
Recurring fair value measurements: |
||||||||||||
|
Cash equivalents |
$ |
|
$ |
|
$ |
$ |
||||||
|
Financial instruments owned, at fair value: |
|
|
|
|
||||||||
|
ETFs |
|
|
|
|
|
|
||||||
|
Pass-through GSEs |
|
|
|
|
|
|
||||||
|
Other assets—seed capital (WisdomTree Digital Funds): |
|
|
|
|
||||||||
|
U.S. treasuries |
|
|
|
— |
|
|
|
|||||
|
Equities |
|
|
|
|
|
|
||||||
|
Fixed income |
|
|
|
|
|
|
|
|||||
|
Total |
$ |
|
$ |
|
$ |
|
$ |
|||||
|
Non-recurring fair value measurements: |
|
|
|
|
||||||||
|
Fnality International Limited—Series B-1 Preference Shares(1) |
|
|
|
|
|
|
||||||
|
Other investments(2) |
|
|
|
|
||||||||
|
Total |
$ |
|
$ |
$ |
$ |
|
||||||
____________
(1)
(2)
F-18
|
December 31, 2022 |
||||||||||||
|
Total |
Level 1 |
Level 2 |
Level 3 |
|||||||||
|
Assets: |
||||||||||||
|
Recurring fair value measurements: |
||||||||||||
|
Cash equivalents |
$ |
|
$ |
|
$ |
$ |
||||||
|
Financial instruments owned, at fair value: |
|
|
|
|
||||||||
|
ETFs |
|
|
|
|
|
|
||||||
|
U.S. treasuries |
|
|
|
|
|
|
||||||
|
Pass-through GSEs |
|
|
|
|
|
|
|
|||||
|
Fixed income |
|
|
|
|
|
|
||||||
|
Other assets—seed capital (WisdomTree Digital Funds): |
|
|
|
|
|
|
||||||
|
Investments in Convertible Notes |
|
|
|
|
||||||||
|
Securrency, Inc.—convertible note (Note 7) |
|
|
|
|
|
|
||||||
|
Fnality International Limited—convertible note (Note 7) |
|
|
|
|
|
|
||||||
|
Total |
$ |
|
$ |
|
$ |
|
$ |
|
||||
|
Non-recurring fair value measurements: |
|
|
|
|
||||||||
|
Other investments(1) |
$ |
|
$ |
$ |
$ |
|
||||||
|
|
|
|
|
|||||||||
|
Liabilities: |
|
|
|
|
||||||||
|
Recurring fair value measurements: |
|
|
|
|
||||||||
|
Deferred consideration (Note 9) |
$ |
|
$ |
$ |
$ |
|
||||||
____________
(1)
Recurring Fair Value Measurements - Methodology
Cash Equivalents (Note 3) – These financial assets represent cash invested in highly liquid investments with original maturities of less than days. These investments are valued at par, which approximates fair value, and are classified as Level 1 in the fair value hierarchy.
Financial instruments owned (Note 5) – Financial instruments owned are investments in ETFs, pass-through GSEs, U.S. treasuries, equities and fixed income. ETFs, U.S. treasuries and equities are generally traded in active, quoted and highly liquid markets and are therefore classified as Level 1 in the fair value hierarchy. Pricing of pass-through GSEs and fixed income includes consideration given to collateral characteristics and market assumptions related to yields, credit risk and timing of prepayments and are therefore generally classified as Level 2. Pass-through GSE positions invested in through a fund structure with a quoted market price on an exchange are generally classified as Level 1.
F-19
Fair Value Measurements classified as Level 3 – The following table presents a reconciliation of beginning and ending balances of recurring fair value measurements classified as Level 3:
|
Years Ended |
||||||
|
December 31, |
December 31, |
|||||
|
Investments in Convertible Notes (Note 7): |
||||||
|
Beginning balance |
$ |
|
$ |
|||
|
Purchases |
|
|
|
|
||
|
Settlements |
|
( |
|
|||
|
Conversions(1) |
|
( |
|
|||
|
Net realized gains/(losses)(2) |
|
|
|
( |
||
|
Ending balance |
$ |
$ |
|
|||
|
Deferred Consideration (Note 7): |
|
|
||||
|
Beginning balance |
$ |
|
$ |
|
||
|
Net realized losses(3) |
|
|
|
|
||
|
Net unrealized gains(4) |
|
( |
|
( |
||
|
Settlements |
|
( |
|
( |
||
|
Ending balance |
$ |
$ |
|
|||
____________
(1)
(2)
(3)
(4)
5. Financial instruments owned
|
December 31, |
December 31, |
|||||
|
Financial instruments owned: |
||||||
|
Trading securities |
$ |
|
$ |
|
||
|
Other assets—seed capital (WisdomTree Digital Funds) |
|
|
|
|
||
|
Total |
$ |
|
$ |
|
||
The Company recognized net trading losses on financial instruments owned that were still held at the reporting dates of $
6. Securities Held-to-Maturity
|
December 31, |
December 31, |
|||||
|
Debt instruments: Pass-through GSEs (amortized cost) |
$ |
|
$ |
|
||
During the years ended December 31, 2023 and 2022, the Company received proceeds of $
F-20
|
December 31, |
||||||
|
2023 |
2022 |
|||||
|
Cost/amortized cost |
$ |
|
$ |
|
||
|
Gross unrealized losses |
|
( |
|
( |
||
|
Gross unrealized gains |
|
|
||||
|
Fair value |
$ |
|
$ |
|
||
An allowance for credit losses was not provided on the Company’s held-to-maturity securities as all securities are investments in pass-through GSEs which are determined to have an estimated loss rate of zero due to an implicit U.S. government guarantee.
|
December 31, |
||||||
|
2023 |
2022 |
|||||
|
Due within one year |
$ |
$ |
||||
|
Due one year through five years |
|
|
||||
|
Due five years through ten years |
|
|
|
|
||
|
Due over ten years |
|
|
|
|
||
|
Total |
$ |
|
$ |
|
||
7. Investments
|
December 31, 2023 |
December 31, 2022 |
|||||||||||
|
Carrying |
Cost |
Carrying |
Cost |
|||||||||
|
Securrency, Inc.: |
||||||||||||
|
Series A Shares |
$ |
$ |
$ |
|
$ |
|
||||||
|
Series B Shares |
|
|
|
|
|
|
||||||
|
Convertible note |
|
|
|
|
|
|
||||||
|
Subtotal—Securrency, Inc. |
|
|
|
|
|
|
||||||
|
Fnality International Limited: |
|
|
|
|
||||||||
|
Convertible note |
|
|
|
|
|
|
||||||
|
Series B-1 Preference Shares |
|
|
|
|
|
|
||||||
|
Subtotal—Fnality International Limited |
|
|
|
|
|
|
|
|
||||
|
Other investments |
|
|
|
|
|
|
|
|||||
|
Total |
$ |
|
$ |
|
$ |
|
$ |
|
||||
Securrency, Inc.
Exit from Investment – Year Ended December 31, 2023
On December 7, 2023, the Company received proceeds of $
F-21
Disclosures Pertaining to December 31, 2022
Preferred Stock
The Company owned approximately
These investments were accounted for under the measurement alternative prescribed in ASC 321, as they did not have a readily determinable fair value and were not considered to be in-substance common stock. The investments were assessed for impairment and similar observable transactions on a quarterly basis. There was no impairment recognized during the years ended December 31, 2022 and 2021 based upon a qualitative assessment.
During the year ended December 31, 2021, the Company recognized a gain of $
|
Inputs |
||||
|
June 9, |
March 8, |
|||
|
Expected volatility |
|
|
||
|
Time to exit (in years) |
|
|
||
Convertible Note
In April and November 2022, the Company participated in a convertible note financing, making an aggregate investment of $
The note was convertible into either Securrency’s common stock or the class of securities convertible into, exchangeable for, or conferring the right to purchase Securrency’s common stock that was issued in the event of a future equity financing at a conversion price equal to a discount of
The note was redeemable upon the occurrence of a corporate transaction for an amount which was the greater of (i) the principal amount and all accrued interest and (ii) the amount that would be received had the note been converted to common stock immediately prior to the occurrence of the corporate transaction. At maturity, redemption or conversion could occur upon the election by the holders of a majority-in-interest of the aggregate principal amount of outstanding notes. If no such election was made, Securrency could elect to pay or convert the notes in its sole discretion.
F-22
The note was accounted for at fair value. Fair value was determined by the Company using the probability-weighted expected return method (“PWERM”), a valuation approach that estimated the value of the note assuming various outcomes. During the year ended December 31, 2022, the Company recognized an unrealized loss of $
|
December 31, |
||
|
Conversion of note upon a future equity financing |
|
|
|
Redemption of note upon a corporate transaction |
|
|
|
Default |
|
|
|
Time to potential outcome (in years) |
|
Fnality International Limited
Series B-1 Preference Shares (December 31, 2023)
The Company owns approximately
This investment is accounted for under the measurement alternative prescribed in ASC 321, as it does not have a readily determinable fair value and is otherwise not subject to the equity method of accounting. The investment is assessed for impairment and similar observable transactions on a quarterly basis. During the year ended December 31, 2023, the Company recognized a gain of $
Fair value of the Company’s investments in Fnality were determined using the backsolve method, a valuation approach that determines the value of shares for companies with complex capital structures based upon the price paid for shares recently issued. Fair value is allocated across the capital structure using the Black-Scholes option pricing model.
The table below presents the inputs used in the backsolve valuation approach (classified as Level 3 in the fair value hierarchy):
|
December 31, |
||
|
Expected volatility |
|
|
|
Time to exit (in years) |
|
|
|
Probability that Series B-2 Preference Shares convert into Series B-1 Preference Shares |
|
There was no impairment recognized during the year ended December 31, 2023 based upon a qualitative assessment.
Convertible Note (December 31, 2022)
In February 2022, the Company participated in a convertible note financing, making a £
F-23
The note was convertible into equity shares in the event of a future financing round at a conversion price equal to the lower of (i) a discount of
The note was redeemable upon the occurrence of a change of control for an amount which was the greater of (i) the principal amount and all accrued interest and (ii) the amount that would have been received had the note been converted to equity shares immediately prior to the occurrence of the change of control. Redemption could also occur on or after maturity or prior to maturity upon approval by holders of at least
The note was accounted for at fair value. Fair value was determined by the Company using the PWERM and was also remeasured for changes in the British pound and U.S. dollar exchange rate. During the year ended December 31, 2022, the Company recognized a gain of $
The table below presents the probability ascribed to potential outcomes used in the PWERM (classified as Level 3 in the fair value hierarchy) and the time to exit:
|
December 31, |
||
|
Conversion of note upon a future financing round |
|
|
|
Redemption of note upon a change of control |
|
|
|
Default |
|
|
|
Time to potential outcome (in years) |
|
Other Investments
During the year ended December 31, 2023, the Company recognized an impairment of $
8. Fixed Assets, net
|
December 31, |
||||||
|
2023 |
2022 |
|||||
|
Equipment |
$ |
|
$ |
|
||
|
Less: accumulated depreciation |
|
( |
|
( |
||
|
Total |
$ |
|
$ |
|
||
9. Deferred Consideration—gold payments
Deferred consideration—gold payments represented an obligation the Company assumed in connection with its acquisition of the European exchange-traded commodity, currency and leveraged-and-inverse business of ETFS Capital Limited (“ETFS Capital”) which occurred on April 11, 2018 (“ETFS Acquisition”). The obligation was for fixed payments to ETFS Capital of physical gold bullion equating to
On May 10, 2023, the Company terminated its Contractual Gold Payments obligation for aggregate consideration totaling $
F-24
On November 20, 2023, the Company repurchased the
|
December 31, 2022 |
|||
|
Forward-looking gold price (low)—per ounce |
$ |
|
|
|
Forward-looking gold price (high)—per ounce |
$ |
|
|
|
Forward-looking gold price (weighted average)—per ounce |
$ |
|
|
|
Discount rate |
|
|
|
|
Perpetual growth rate |
|
|
|
The forward-looking gold prices at December 31, 2022 were extrapolated from the last observable CMX exchange price (beyond 2028) and the weighted-average price per ounce was derived from the relative present values of the annual payment obligations. The perpetual growth rate at December 31, 2022 was determined based upon the increase in observable forward-looking gold prices through 2028. This obligation is classified as Level 3 as the discount rate, the extrapolated forward-looking gold prices and perpetual growth rate are significant unobservable inputs. An increase in spot gold prices, forward-looking gold prices and the perpetual growth rate would result in an increase in deferred consideration, whereas an increase in the discount rate would reduce the fair value.
Current and long-term amounts payable were $
|
Years Ended December 31, |
|||||||||
|
2023 |
2022 |
2021 |
|||||||
|
Contractual gold payments |
$ |
|
$ |
|
$ |
|
|||
|
Contractual gold payments—gold ounces paid |
|
|
|
|
|
|
|||
|
Gain on revaluation/termination of deferred consideration—gold payments(1) |
$ |
|
$ |
|
$ |
|
|||
____________
(1)
10. Convertible Notes
On February 14, 2023, the Company issued and sold $
On June 14, 2021, the Company issued and sold $
On June 16, 2020, the Company issued and sold $
F-25
In connection with the issuance of the 2023 Notes, the Company repurchased $
After the repurchase and maturity of the 2020 Notes and the issuance of the 2023 Notes (and together with the 2021 Notes, the “Convertible Notes”), the Company had $
|
2023 Notes |
2021 Notes |
|||||
|
Principal outstanding |
$ |
|
$ |
|
||
|
Maturity date (unless earlier converted, repurchased or redeemed) |
|
|
|
|
||
|
Interest rate |
|
|
|
|
||
|
Conversion price |
$ |
|
$ |
|
||
|
Conversion rate |
|
|
|
|
||
|
Redemption price |
$ |
|
$ |
|
||
• Interest rate: Payable semiannually in arrears on February 15 and August 15 of each year for the 2023 Notes and on June 15 and December 15 of each year for the 2021 Notes.
• Conversion price: Convertible at an initial conversion rate into shares of the Company’s common stock, per $
• Conversion: Holders may convert at their option at any time prior to the close of business on the business day immediately preceding May 15, 2028 and March 15, 2026 for the 2023 Notes and 2021 Notes, respectively, only under the following circumstances: (i) if the last reported sale price of the Company’s common stock for at least
• Cash settlement of principal amount: Upon conversion, the Company will pay cash up to the aggregate principal amount of the Convertible Notes to be converted. At its election, the Company will also settle its conversion obligation in excess of the aggregate principal amount of the Convertible Notes being converted in either cash, shares of its common stock or a combination of cash and shares of its common stock.
• Redemption price: The Company may redeem for cash all or any portion of the Convertible Notes, at its option, on or after August 20, 2025 and June 20, 2023 in respect of the 2023 Notes and the 2021 Notes, respectively, and on or prior to the 55th scheduled trading day immediately preceding the maturity date, if the last reported sale price of the Company’s common stock has been at least
F-26
• Limited investor put rights: Holders of the Convertible Notes have the right to require the Company to repurchase for cash all or a portion of their notes at
• Conversion rate increase in certain customary circumstances: In certain circumstances, conversions in connection with a “make-whole fundamental change” (as defined in the indentures) or conversions of Convertible Notes called (or deemed called) for redemption may result in an increase to the conversion rate, provided that the conversion rate will not exceed
• Seniority and Security: The 2023 Notes and 2021 Notes rank equal in right of payment, and are the Company’s senior unsecured obligations, but are subordinated in right of payment to the Company’s obligations to make certain redemption payments (if and when due) in respect of its Series A Non-Voting Convertible Preferred Stock (Note 11).
The indentures contain customary terms and covenants, including that upon certain events of default occurring and continuing, either the Trustee or the respective holders of not less than
|
December 31, 2023 |
December 31, 2022 |
|||||||||||||||||
|
2023 Notes |
2021 Notes |
Total |
2021 Notes |
2020 Notes |
Total |
|||||||||||||
|
Principal amount |
$ |
|
$ |
|
$ |
|
$ |
|
$ |
|
$ |
|
||||||
|
Plus: Premium |
|
|
|
|
|
|
|
|
||||||||||
|
Gross proceeds |
|
|
|
|
|
|
|
|
|
|
|
|
||||||
|
Less: Unamortized issuance costs |
|
( |
|
( |
|
( |
|
( |
|
( |
|
( |
||||||
|
Carrying amount |
|
|
$ |
|
$ |
|
$ |
|
$ |
|
$ |
|
||||||
|
Effective interest rate(1) |
|
|
|
|
|
|
|
|
|
|
|
|
||||||
____________
(1)
Interest expense on the Convertible Notes during the years ended December 31, 2023, 2022 and 2021 was $
The fair value of the Convertible Notes (classified as Level 2 in the fair value hierarchy) was $
11. Series A Preferred Stock
On April 10, 2018, the Company filed a Certificate of Designations of Series A Non-Voting Convertible Preferred Stock with the Secretary of State of the State of Delaware establishing the rights, preferences, privileges, qualifications, restrictions, and limitations relating to the Series A Preferred Stock (defined below). The Series A Preferred Stock is intended to provide ETFS Capital with economic rights equivalent to the Company’s common stock on an as-converted basis. The Series A Preferred Stock has no voting rights, are not transferable and have the same priority with regard to dividends, distributions and payments as the common stock.
As described in the Certificate of Designations, the Company will not issue, and ETFS Capital does not have the right to require the Company to issue, any shares of common stock upon conversion of the Series A Preferred Stock, if, as a result of such conversion, ETFS Capital (together with certain attribution parties) would beneficially own more than
F-27
In connection with the completion of the ETFS Acquisition, the Company issued
|
December 31, |
December 31, |
|||||
|
Issuance of Series A Preferred Stock |
$ |
|
$ |
|
||
|
Less: Issuance costs |
|
( |
|
( |
||
|
Series A Preferred Stock—carrying value |
$ |
|
$ |
|
||
|
Cash dividends declared per share (quarterly) |
$ |
|
$ |
|
||
Temporary equity classification is required for redeemable instruments for which redemption triggers are outside of the issuer’s control. ETFS Capital has the right to redeem all the Series A Preferred Stock specified to be converted during the period of time specified in the Certificate of Designations in the event that: (a) the number of shares of the Company’s common stock authorized by its certificate of incorporation is insufficient to permit the Company to convert all of the Series A Preferred Stock requested by ETFS Capital to be converted; or (b) ETFS Capital does not, upon completion of a change of control of the Company, receive the same amount per share of Series A Preferred Stock as it would have received had each outstanding share of Series A Preferred Stock been converted into common stock immediately prior to the change of control. However, the Company will not be obligated to make any such redemption payments to the extent such payments would be a breach of any covenant or obligation the Company owes to any of its secured creditors or is otherwise prohibited by applicable law.
Any such redemption will be at a price per Preferred Share equal to the dollar volume-weighted average price for a share of common stock for the 30-trading day period ending on the date of such attempted conversion or change of control, as applicable, multiplied by 1,000. Such redemption payment will be made in one payment no later than 10 business days following the last day of the Company’s first fiscal quarter that begins on a date following the date ETFS Capital exercises such redemption right. The redemption value of the Series A Preferred Stock was $
The carrying amount of the Series A Preferred Stock was not adjusted as it was not probable that such shares would become redeemable.
12. Payable to Gold Bullion Holdings (Jersey) Limited (“GBH”)
On November 20, 2023, the Company repurchased its Series C Preferred Stock which was convertible into
Under U.S. GAAP, the obligation was recorded at its present value utilizing a market rate of interest on the closing date of
|
December 31, |
|||
|
Current: |
$ |
|
|
|
Long-term |
|
|
|
|
Total |
$ |
|
|
Interest expense recognized during the year ended December 31, 2023 was $
F-28
13. Leases
The Company has entered into operating leases for its corporate headquarters office facilities, financial data terminals and equipment. The Company has no finance leases.
|
Years Ended |
||||||
|
2023 |
2022 |
|||||
|
Lease cost: |
||||||
|
Operating lease cost |
$ |
|
$ |
|
||
|
Short-term lease cost |
|
|
|
|
||
|
Total lease cost |
$ |
|
$ |
|
||
|
Other information: |
|
|
||||
|
Cash paid for amounts included in the measurement of operating liabilities (operating leases) |
$ |
|
$ |
|
||
|
Right-of-use assets obtained in exchange for new operating lease liabilities |
|
|
||||
|
Weighted-average remaining lease term (in years)—operating leases |
|
|
|
|
||
|
Weighted-average discount rate—operating leases |
|
|
|
|
||
None of the Company’s leases include variable payments, residual value guarantees or any restrictions or covenants relating to the Company’s ability to pay dividends or incur additional financing obligations.
On September 9, 2021, the Company entered into a Surrender Agreement to terminate the lease for its principal executive office at 245 Park Avenue, New York, New York effective immediately. In consideration for the landlord’s agreement to enter into the Surrender Agreement and accelerate the expiration date of the term of the lease from August 31, 2029, the Company paid a termination fee of $
Additionally, the Company recognized an impairment loss of $
The Company’s leases also included extension, automatic renewal and termination provisions. These provisions were also not reasonably certain of being exercised and were therefore not recognized as part of the right-of-use asset and lease liability.
|
2024 |
$ |
|
|
|
2025 |
|
||
|
2026 |
|
||
|
2027 |
|
||
|
2028 |
|
||
|
2029 and thereafter |
|
||
|
Total future minimum lease payments (undiscounted) |
$ |
|
F-29
Amounts recognized in the Company’s Consolidated Balance Sheets |
|||
|
Lease liability—short term |
$ |
|
|
|
Lease liability—long term |
|
||
|
Subtotal |
|
|
|
|
Difference between undiscounted and discounted cash flows |
|
|
|
|
Total future minimum lease payments (undiscounted) |
$ |
|
|
14. Contingencies
The Company may be subject to reviews, inspections and investigations by regulatory authorities as well as legal proceedings arising in the ordinary course of business.
Closure of the WisdomTree WTI Crude Oil 3x Daily Leveraged ETP
In December 2020, WMAI, WTMAML, WTUK and WisdomTree Ireland Limited (“WT Ireland”) were served with a writ of summons to appear before the Court of Milan, Italy. In January 2021, WTUK was served with a writ of summons to appear before the Court of Udine, Italy. Investors had filed actions seeking damages resulting from the closure of the WisdomTree WTI Crude Oil 3x Daily Leveraged ETP (“3OIL”) in March 2020. The product was dependent on the receipt of payments from a swap provider to satisfy payment obligations to the investors. Due to an extreme adverse move in oil futures relative to the oil futures’ closing price, the swap contract underlying 3OIL was terminated by the swap provider, which resulted in the compulsory redemption of 3OIL, all in accordance with the prospectus.
In February 2022, the Court of Udine ruled in the Company’s favor. Also in February 2022, WMAI, WTMAML, WTUK and WT Ireland were served with another writ of summons to appear before the Court of Milan by additional investors seeking damages resulting from the closure of 3OIL.
In March 2022, WMAI and WTUK were served with a writ of summons to appear before the Court of Turin and two writs of summons to appear before the Court of Milan by additional investors seeking damages. These writs also were served on the intermediary brokers for the respective claimants, with the claimants alleging joint and several liability of WMAI, WTUK and such intermediary brokers. In July 2023, the Court of Milan ruled in favor of WMAI and WTUK in respect of one of these claims.
Total damages sought by all investors related to these claims are approximately €
Additionally, in July 2023, WT Ireland received a letter from counsel on behalf of additional investors seeking damages of up to approximately €
The Company is currently assessing these claims with its external counsel. The Company expects that losses, if any, arising from these claims will be covered under its insurance policies, less a $
15. Variable Interest Entities
VIEs are entities with any of the following characteristics: (i) the entity does not have enough equity to finance its activities without additional financial support; (ii) the equity holders, as a group, lack the characteristics of a controlling financial interest; or (iii) the entity is structured with non-substantive voting rights.
Consolidation of a VIE is required for the party deemed to be the primary beneficiary, if any. The primary beneficiary is the party who has both (a) the power to direct the activities of a VIE that most significantly impact the entity’s economic performance and (b) an obligation to absorb losses of the entity or a right to receive benefits from the entity that could potentially be significant to the entity. The Company is not the primary beneficiary of any entities in which it has a variable interest as it does not have the power to direct the activities that most significantly impact the entities’ economic performance. Such power is conveyed through the entities’ boards of directors and the Company does not have control over the boards.
F-30
|
December 31, |
December 31, |
|||||
|
Carrying Amount—Assets (Securrency): |
||||||
|
Preferred stock—Series A Shares |
$ |
$ |
|
|||
|
Preferred stock—Series B Shares |
|
|
|
|||
|
Convertible note |
|
|
|
|||
|
Subtotal—Securrency |
$ |
$ |
|
|||
|
Carrying Amount—Assets (Fnality): |
|
|
||||
|
Convertible note |
|
|
|
|||
|
Series B-1 Preference Shares |
|
|
|
|||
|
Subtotal—Fnality |
$ |
|
$ |
|
||
|
Carrying Amount—Assets (Other investments): |
$ |
$ |
|
|||
|
Total (Note 7) |
$ |
|
$ |
|
||
|
Maximum exposure to loss |
$ |
|
$ |
|
||
16. Revenues from Contracts with Customers
|
Years Ended December 31, |
|||||||||
|
2023 |
2022 |
2021 |
|||||||
|
Revenues from contracts with customers: |
|||||||||
|
Advisory fees |
$ |
|
$ |
|
$ |
|
|||
|
Other |
|
|
|
|
|
|
|||
|
Total operating revenues |
$ |
|
$ |
|
$ |
|
|||
The Company recognizes revenues from contracts with customers when the performance obligation is satisfied, which is when the promised services are transferred to the customer. A service is considered to be transferred when the customer obtains control, which is represented by the transfer of rights with regard to the service. Transfer of control happens either over time or at a point in time. When a performance obligation is satisfied over time, an entity is required to select a single method of measuring progress for each performance obligation that depicts the entity’s performance in transferring control of services to the customer.
Substantially all the Company’s revenues from contracts with customers are derived primarily from investment advisory agreements with related parties (Note 17). These advisory fees are recognized over time, are earned from the Company’s ETPs and are calculated based on a percentage of the ETPs’ average daily net assets. There is no significant judgment in calculating amounts due which are invoiced monthly in arrears and are not subject to any potential reversal. Progress is measured using the practical expedient under the output method resulting in the recognition of revenue in the amount for which the Company has a right to invoice.
There are no contract assets or liabilities that arise in connection with the recognition of advisory fee revenue. In addition, there are no costs incurred to obtain or fulfill the contracts with customers, all of which are investment advisory agreements with related parties.
Other income includes revenues the Company earns from swap providers associated with certain of the Company’s European listed ETPs, the nature of which are either based on a percentage of the ETPs’ average daily net assets or flows associated with certain products. There is no significant judgment in calculating amounts due, which are invoiced monthly or quarterly in arrears and are not subject to any potential reversal. Progress is measured using the practical expedient under the output method resulting in the recognition of revenue in the amount for which the Company has a right to invoice.
F-31
Geographic Distribution of Revenues
|
Years Ended December 31, |
|||||||||
|
2023 |
2022 |
2021 |
|||||||
|
Revenues from contracts with customers: |
|||||||||
|
United States |
$ |
|
$ |
|
$ |
|
|||
|
Jersey |
|
|
|
|
|
|
|||
|
Ireland |
|
|
|
|
|
|
|||
|
Total operating revenues |
$ |
|
$ |
|
$ |
|
|||
17. Related Party Transactions
Investment Advisory Agreements
The Company’s revenues are derived primarily from investment advisory agreements with related parties. Under these agreements, the Company has licensed to related parties the use of certain of its own indexes for the U.S. WisdomTree ETFs, WisdomTree Digital Funds and WisdomTree UCITS ETFs. The relevant board of trustees or board of directors (including certain officers of the Company) of each of the related parties is primarily responsible for overseeing the management and affairs of the entities for the benefit of their respective stakeholders and have contracted with the Company to provide for general management and administration services. The Company is also responsible for certain expenses of the related parties, including the cost of transfer agency, custody, fund administration and accounting, legal, audit, and other non-distribution services, excluding extraordinary expenses, taxes and certain other expenses, which are included in fund management and administration in the Consolidated Statements of Operations. In exchange, the Company receives fees based on a percentage of the ETPs’ and the Digital Funds’ average daily net assets. A majority of the independent members of the respective board of trustees or board of directors are required to initially and annually (after the first two years) approve the advisory agreements of the U.S. WisdomTree ETFs and the Digital Funds and these agreements may be terminated by such board of trustees or board of directors upon notice.
|
December 31, |
||||||
|
2023 |
2022 |
|||||
|
Receivable from WTT |
$ |
|
$ |
|
||
|
Receivable from ManJer Issuers |
|
|
|
|
||
|
Receivable from WMAI and WTICAV |
|
|
|
|
||
|
Total |
$ |
|
$ |
|
||
The allowance for credit losses on accounts receivable from related parties is insignificant when applying historical loss rates, adjusted for current conditions and supportable forecasts, to the amounts outstanding in the table above. Amounts outstanding are all invoiced in arrears, are less than 30 days aged and are collected shortly after the applicable reporting period.
|
Years Ended December 31, |
|||||||||
|
2023 |
2022 |
2021 |
|||||||
|
Advisory services provided to WTT |
$ |
|
$ |
|
$ |
|
|||
|
Advisory services provided to ManJer Issuers |
|
|
|
|
|
|
|||
|
Advisory services provided to WMAI and WTICAV |
|
|
|
|
|
|
|||
|
Total |
$ |
|
$ |
|
$ |
|
|||
F-32
Pursuant to a license agreement between WisdomTree, Inc. (“WTI”) and WML to provide indices for a number of the sub-funds of WTICAV, WTI earned revenue amounting to €
Investments in WisdomTree Products
The Company also has investments in certain WisdomTree products of approximately $
Deferred Consideration—Gold Payments – Termination
On May 10, 2023, the Company terminated its contractual gold payments obligation to ETFS Capital, which included the payment of $
18. Stock-Based Awards
On July 15, 2022, the Company’s stockholders approved the 2022 Equity Plan under which the Company may issue up to
The Company grants equity awards to employees and directors which include restricted stock awards (“RSAs”), restricted stock units (“RSUs”), performance-based restricted stock units (“PRSUs”) and stock options. Certain awards described below are subject to acceleration under certain conditions.
| Stock options: | Generally issued for terms of | |
| RSAs/RSUs: | Awards are valued based on the Company’s stock price on grant date and generally vest ratably, on an annual basis, over three years. | |
| PRSUs: | These awards cliff vest three years from the grant date and contain a market condition whereby the number of PRSUs ultimately vesting is tied to how the Company’s total shareholder return (“TSR”) compares to a peer group of other publicly traded asset managers over the three-year period. A Monte Carlo simulation is used to value these awards. The number of PRSUs vesting ranges from 0% to 200% of the target number of PRSUs granted, as follows: • If the relative TSR is below the 25th percentile, then 0% of the target number of PRSUs granted will vest; • If the relative TSR is at the 25th percentile, then 50% of the target number of PRSUs granted will vest; • If the relative TSR is above the 25th percentile, then linear scaling is applied such that the percent of the target number of PRSUs vesting is 100% at the 50th percentile and capped at 200% of the target number of PRSUs granted for performance at the 85th percentile; and • If the Company’s TSR is negative, the target number of PRSUs vesting is capped at 100% regardless of the relative TSR percentile. |
F-33
During the years ended December 31, 2023, 2022 and 2021, total stock-based compensation expense was $
The actual tax benefit realized for the tax deductions for share-based compensation was $
|
December 31, 2023 |
|||||
|
Unrecognized |
Weighted-Average |
||||
|
Employees and directors |
$ |
|
|
||
Stock Options
There was option activity during the years ended December 31, 2023 and 2022 and there were no options outstanding as of December 31, 2023 and 2022. The total intrinsic value of options exercised during the year ended December 31, 2021 was $
RSAs, RSUs and PRSUs
The aggregate fair value of RSAs, RSUs and PRSUs that vested during the years ended December 31, 2023, 2022 and 2021 was $
|
RSA |
RSU |
PRSU(1) |
|||||||||||||
|
Shares |
Weighted |
Shares |
Weighted |
Shares |
Weighted |
||||||||||
|
Unvested Balance at January 1, 2021 |
|
$ |
|
|
$ |
|
|
$ |
|
||||||
|
Granted |
|
|
|
|
|
|
|
|
|||||||
|
Vested |
( |
|
|
( |
|
|
|
||||||||
|
Forfeited |
( |
|
|
( |
|
|
( |
|
|
||||||
|
Unvested Balance at December 31, 2021 |
|
$ |
|
|
$ |
|
|
$ |
|
||||||
|
Granted |
|
|
|
|
|
|
|
|
|||||||
|
Vested |
( |
|
|
( |
|
|
( |
|
|
||||||
|
Forfeited |
( |
|
|
( |
|
|
|
||||||||
|
Unvested Balance at December 31, 2022 |
|
$ |
|
|
$ |
|
|
$ |
|
||||||
|
Granted |
|
|
|
|
|
|
|
|
|||||||
|
Vested |
( |
|
|
( |
|
|
( |
|
|
||||||
|
Forfeited |
( |
|
|
( |
|
|
|
— |
|||||||
|
Stock dividends accrued |
— |
|
— |
|
|
|
|
|
|
||||||
|
Unvested Balance at December 31, 2023 |
|
$ |
|
$ |
|
|
$ |
|
|||||||
____________
(1)
F-34
(2)
|
Granted in |
Granted in |
Granted in |
||||
|
Historical stock price volatility (low) |
|
|
|
|||
|
Historical stock price volatility (high) |
|
|
|
|||
|
Historical stock price volatility (average) |
|
|
|
|||
|
Risk free interest rate |
|
|
|
|||
|
Expected dividend yield |
|
|
|
(3)
19. Stockholder Rights Plan
On March 17, 2023, the Board of Directors of the Company adopted a stockholder rights plan, as set forth in the Stockholder Rights Agreement, dated March 17, 2023, between the Company and Continental Stock Transfer & Trust Company, as Rights Agent, as amended by Amendment No. 1 thereto, dated May 4, 2023 (“Amendment No. 1”), and by Amendment No. 2 thereto, dated May 10, 2023 (“Amendment No. 2”) (as amended, the “Stockholder Rights Agreement”). At the Company’s 2023 Annual Meeting of Stockholders held on June 16, 2023, the Company’s stockholders ratified the adoption by the Board of Directors of the Stockholder Rights Agreement.
Pursuant to the terms of the Stockholder Rights Agreement, the Board of Directors declared a dividend distribution of (i)
Initially, the Rights are not exercisable and are attached to and trade with all shares of common stock and Series A Preferred Stock outstanding as of, and issued subsequent to, the Record Date. The Rights will separate from the common stock and Series A Preferred Stock and will become exercisable upon the earlier of (i) the close of business on the tenth calendar day following the first public announcement that a person or group of affiliated or associated persons (an “Acquiring Person”) has acquired beneficial ownership of
F-35
For purposes of the Stockholder Rights Agreement, beneficial ownership is defined to include ownership of securities that are subject to a derivative transaction and acquired derivative securities. Swaps dealers unassociated with any control intent or intent to evade the purposes of the Stockholder Rights Agreement are excepted from such imputed beneficial ownership. Pursuant to Amendment No. 1, beneficial ownership did not include the right to vote pursuant to any agreement, arrangement or understanding with respect to voting on the proposal to approve and ratify the Stockholder Rights Agreement presented to the Company’s stockholders at the Company’s 2023 annual meeting of stockholders. Pursuant to Amendment No. 2, the parties to the SPA Agreement are not deemed to be “Acquiring Persons” solely by virtue of, or as a result of, the parties’ entry into the SPA Agreement, the issuance of the Series C Preferred Stock to GBH, and the performance or consummation of any of the other transactions contemplated by the SPA Agreement, among other conditions, under the terms and conditions set forth in Amendment No. 2.
In the event that a Stock Acquisition Date occurs, proper provision will be made so that each holder of a Right (other than an Acquiring Person or its associates or affiliates, whose Rights shall become null and void) will thereafter have the right to receive upon exercise, in lieu of a number of shares of Series B Preferred Stock, that number of shares of common stock of the Company (or, in certain circumstances, including if there are insufficient shares of common stock to permit the exercise in full of the Rights, Units of Series B Preferred Stock, other securities, cash or property, or any combination of the foregoing) having a market value of two times the Exercise Price of the Right (such right being referred to as the “Subscription Right”). In the event that, at any time following the Stock Acquisition Date, (i) the Company consolidates with, or merges with and into, any other person, and the Company is not the continuing or surviving corporation, (ii) any person consolidates with the Company, or merges with and into the Company and the Company is the continuing or surviving corporation of such merger and, in connection with such merger, all or part of the shares of common stock are changed into or exchanged for stock or other securities of any other person or cash or any other property, or (iii)
The Rights may be redeemed in whole, but not in part, at a price of $
The Stockholder Rights Agreement may be amended by the Board of Directors in its sole discretion at any time prior to the time at which any person becomes an Acquiring Person. After such time the Board of Directors may, subject to certain limitations set forth in the Stockholder Rights Agreement, amend the Stockholder Rights Agreement only to cure any ambiguity, defect or inconsistency, to shorten or lengthen any time period, or to make changes that do not adversely affect the interests of Rights holders (excluding the interests of an Acquiring Person or its associates or affiliates).
Until a Right is exercised, the holder will have no rights as a stockholder of the Company (beyond those as an existing stockholder), including the right to vote or to receive dividends. While the distribution of the Rights will not be taxable to stockholders or to the Company, stockholders may, depending upon the circumstances, recognize taxable income in the event that the Rights become exercisable for shares of common stock, other securities of the Company, other consideration or for common stock of an acquiring company.
F-36
The Rights are not exercisable until the Distribution Date and will expire at the close of business on March 16, 2024, unless previously redeemed or exchanged by the Company.
The Stockholder Rights Agreement provides the holders of the common stock with the ability to exempt an offer to acquire, or engage in another business combination transaction involving, the Company that is deemed a “Qualifying Offer” (as defined in the Stockholder Rights Agreement) from the terms of the Stockholder Rights Agreement. A Qualifying Offer is, in summary, an offer determined by a majority of the independent members of the Board to have specific characteristics that are generally intended to preclude offers that are coercive, abusive or highly contingent. Among those characteristics are that it be: (i) a fully financed all-cash tender offer or an exchange offer offering shares of common stock of the offeror, or a combination thereof, for any and all of the common stock; and (ii) an offer that is otherwise in the best interests of the Company’s stockholders. The Stockholder Rights Agreement provides additional characteristics necessary for an acquisition offer to be deemed a “Qualifying Offer,” including if the consideration offered in a proposed transaction is stock of the acquiror.
Pursuant to the Stockholder Rights Agreement, if the Company receives a Qualifying Offer and the Board of Directors has not redeemed the outstanding Rights or exempted such Qualifying Offer from the terms of the Stockholder Rights Agreement or called a special meeting of stockholders (the “Special Meeting”) for the purpose of voting on whether to exempt such Qualifying Offer from the terms of the Stockholder Rights Agreement, in each case by the end of the 90 business day period following the commencement of such Qualifying Offer, provided such offer remains a Qualifying Offer during such period, the holders of
20. Employee Benefit Plans
The Company has a 401(k) savings plan covering all eligible employees in which the Company can make discretionary contributions from its profits. The amounts included in the table below are recorded in compensation expense in the Consolidated Statements of Operations.
|
Years Ended December 31, |
|||||||
|
2023 |
2022 |
2021 |
|||||
|
$ |
|
$ |
|
$ |
|
||
F-37
21. Earnings Per Share
|
Years Ended December 31, |
|||||||||
|
2023 |
2022 |
2021 |
|||||||
|
Basic Earnings per Share |
|||||||||
|
Net income |
$ |
|
$ |
|
$ |
|
|||
|
Add: Gain on repurchase of Series C Preferred Stock |
|
|
|
|
|||||
|
Less: Income distributed to participating securities |
|
( |
|
( |
|
( |
|||
|
Less: Undistributed income allocable to participating securities |
|
( |
|
( |
|
( |
|||
|
Net income available to common stockholders—Basic EPS |
$ |
|
$ |
|
$ |
|
|||
|
Weighted average common shares (in thousands) |
|
|
|
|
|
|
|||
|
Basic earnings per share |
$ |
|
$ |
|
$ |
|
|||
|
Years Ended December 31, |
|||||||||
|
2023 |
2022 |
2021 |
|||||||
|
Diluted Earnings per Share |
|||||||||
|
Net income available to common stockholders |
$ |
|
$ |
|
$ |
|
|||
|
Add back: Undistributed income allocable to participating securities |
|
|
|
|
|
|
|||
|
Less: Reallocation of undistributed income allocable to participating securities considered potentially dilutive |
|
( |
|
( |
|
( |
|||
|
Net income available to common stockholders—Diluted EPS |
$ |
|
$ |
|
$ |
|
|||
|
Weighted Average Diluted Shares (in thousands): |
|
|
|
||||||
|
Weighted average common shares |
|
|
|
|
|
|
|||
|
Dilutive effect of common stock equivalents, excluding participating securities |
|
|
|
|
|
|
|||
|
Weighted average diluted shares, excluding participating securities (in thousands) |
|
|
|
|
|
|
|||
|
Diluted earnings per share |
$ |
|
$ |
|
$ |
|
|||
Diluted earnings per share presented above is calculated using the two-class method as this method results in the lowest diluted earnings per share amount for common stock. The year ended December 31, 2023 includes a gain of $
Total antidilutive non-participating common stock equivalents were
There were no potential common shares associated with the conversion option embedded in the Convertible Notes included in weighted average diluted shares for the years ended December 31, 2023 and 2022 as the Company’s average stock price was lower than the conversion price. Potential common shares associated with the conversion option embedded in the Convertible Notes for the year ended December 31, 2021 were
F-38
|
Years Ended December 31, |
||||||
|
2023 |
2022 |
2021 |
||||
|
Reconciliation of Weighted Average Diluted Shares (in thousands) |
||||||
|
Weighted average diluted shares as disclosed on the Consolidated Statements of Operations |
|
|
|
|||
|
Less: Participating securities: |
||||||
|
Weighted average shares of common stock issuable upon conversion of the Series A Preferred Stock (Note 11) |
( |
( |
( |
|||
|
Weighted average shares of common stock issuable upon conversion of the Series C Preferred Stock (Note 11) |
( |
|||||
|
Potentially dilutive restricted stock awards |
( |
( |
( |
|||
|
Weighted average diluted shares used to calculate diluted earnings/(loss) per share as disclosed in the table above |
|
|
|
|||
22. Income Taxes
Income before Income Tax Expense – Domestic and Foreign
|
Year Ended December 31, |
|||||||||
|
2023 |
2022 |
2021 |
|||||||
|
U.S. |
$ |
|
$ |
( |
$ |
|
|||
|
Foreign |
|
|
|
|
|
|
|||
|
Total |
$ |
|
$ |
|
$ |
|
|||
Income Tax Expense/(Benefit) – By Jurisdiction
|
Years Ended December 31, |
|||||||||
|
2023 |
2022 |
2021 |
|||||||
|
Current: |
|||||||||
|
Federal |
$ |
|
$ |
|
$ |
|
|||
|
State and local |
|
|
|
|
|
|
|||
|
Foreign |
|
|
|
( |
|
( |
|||
|
$ |
|
$ |
( |
$ |
|
||||
|
Deferred: |
|
|
|
||||||
|
Federal |
$ |
( |
$ |
( |
$ |
( |
|||
|
State and local |
|
( |
|
( |
|
( |
|||
|
Foreign |
|
|
|
( |
|
|
|||
|
$ |
( |
$ |
( |
$ |
|
||||
|
Income tax expense/(benefit) |
$ |
|
$ |
( |
$ |
|
|||
F-39
Reconciliation of Statutory Federal Income Tax Rate to the Effective Income Tax Rate
|
Years Ended December 31, |
|||||||||
|
2023 |
2022 |
2021 |
|||||||
|
U.S. federal statutory income tax |
$ |
|
$ |
|
$ |
|
|||
|
Gain on revaluation/termination of deferred consideration(1) |
|
( |
|
( |
|
( |
|||
|
Non-deductible loss on extinguishment of convertible notes |
|
|
|
— |
|
— |
|||
|
Foreign operations |
|
( |
|
( |
|
( |
|||
|
Non-deductible executive compensation |
|
|
|
|
|
|
|||
|
Decrease in unrecognized tax benefits, net |
|
( |
|
( |
|
( |
|||
|
Change in valuation allowance – Capital losses |
|
|
|
|
|
|
|||
|
Expiration of capital losses |
|
|
|
— |
|
— |
|||
|
Stock-based compensation tax shortfalls |
|
|
|
|
|
|
|||
|
Change in tax-related indemnification assets, net |
|
|
|
|
|
|
|||
|
Change in foreign net operating losses (“NOLs”) |
|
|
|
— |
|
— |
|||
|
Blended state income tax rate, net of federal benefit |
|
|
|
( |
|
|
|||
|
Change in valuation allowance—Foreign NOLs and interest carryforwards |
|
— |
|
( |
|
— |
|||
|
GILTI |
|
— |
|
|
|
— |
|||
|
Other differences, net |
|
|
|
|
|
|
|||
|
Income tax expense/(benefit) |
$ |
|
$ |
( |
$ |
|
|||
____________
(1)
Income Tax Payments
|
Years Ended December 31, |
|||||||||
|
2023 |
2022 |
2021 |
|||||||
|
Federal |
$ |
|
$ |
|
$ |
|
|||
|
State and local |
|
|
|
|
|
|
|||
|
Foreign |
|
|
|
|
|
|
|||
|
$ |
|
$ |
|
$ |
|
||||
F-40
Deferred Tax Assets
|
2023 |
2022 |
|||||
|
Deferred tax assets: |
||||||
|
Capital losses |
$ |
|
$ |
|
||
|
Accrued expenses |
|
|
|
|
||
|
Stock-based compensation |
|
|
|
|
||
|
NOLs—Foreign |
|
|
|
|
||
|
Goodwill and intangible assets |
|
|
|
|
||
|
Unrealized losses |
|
|
|
|
||
|
Foreign currency translation adjustment |
|
|
|
|
||
|
NOLs—U.S. |
|
|
|
|
||
|
Operating lease liabilities |
|
|
|
|
||
|
Outside basis differences |
|
|
|
|||
|
Other |
|
|
|
|
||
|
Deferred tax assets |
|
|
|
|
||
|
|
|
|||||
|
Deferred tax liabilities: |
|
|
||||
|
Fixed assets and prepaid assets |
|
|
|
|
||
|
Unremitted earnings—European subsidiaries |
|
|
|
|
||
|
Right of use assets—operating leases |
|
|
|
|
||
|
Deferred tax liabilities |
|
|
|
|
||
|
Total deferred tax assets less deferred tax liabilities |
|
|
|
|
||
|
Less: Valuation allowance |
|
( |
|
( |
||
|
Deferred tax assets, net |
$ |
|
$ |
|
||
Net Operating and Capital Losses – U.S.
The Company’s tax effected NOLs at December 31, 2023 were $
The Company’s tax effected capital losses at December 31, 2023 were $
Net Operating Losses – Europe
One of the Company’s European subsidiaries generated NOLs outside the U.S. These tax effected NOLs, all of which are carried forward indefinitely, were $
Valuation Allowance
The Company’s valuation allowance has been established on its net capital losses, unrealized losses and outside basis differences, as it is more-likely-than-not that these deferred tax assets will not be realized.
During the year ended December 31, 2022, the Company released the valuation allowance on its European net operating losses of $
Uncertain Tax Positions
Tax positions are evaluated utilizing a two-step process. The Company first determines whether any of its tax positions are more-likely-than-not to be sustained upon examination, based solely on the technical merits of the position. Once it is determined that a position meets this recognition threshold, the position is measured as the largest amount of benefit that is greater than
F-41
In connection with the ETFS Acquisition, the Company accrued a liability for uncertain tax positions and interest and penalties at the acquisition date. The Company also recorded an offsetting indemnification asset provided by ETFS Capital as part of its agreement to indemnify the Company for any potential claims.
|
Total |
Unrecognized |
Interest and |
|||||||
|
Balance at January 1, 2022 |
$ |
|
$ |
|
$ |
|
|||
|
Decrease—Settlements(1) |
|
( |
|
( |
|
( |
|||
|
Decrease—Lapse of statute of limitations(1) |
|
( |
|
( |
|
( |
|||
|
Increases |
|
|
|
|
|
||||
|
Foreign currency translation(2) |
|
( |
|
( |
|
( |
|||
|
Balance at December 31, 2022 |
$ |
|
$ |
|
$ |
|
|||
|
Decrease—Lapse of statute of limitations |
|
( |
|
( |
|
( |
|||
|
Balance at December 31, 2023 |
$ |
$ |
$ |
||||||
____________
(1)
(2)
The gross unrecognized tax benefits and interest and penalties totaling $
Income Tax Examinations
The Company is subject to U.S. federal income tax as well as income tax of multiple state, local and certain foreign jurisdictions.
ManJer’s tax returns (a Jersey-based subsidiary) were previously under review for the years ended December 31, 2014, 2016, 2017 and 2018. In January 2022, the audit was resolved in favor of ManJer. In addition, the Company’s tax returns were previously under review by the State of Michigan for the years ended 2017 through 2020. In August 2022, the audit was resolved in favor of the Company.
As of December 31, 2023, with few exceptions, the Company was no longer subject to income tax examinations by any taxing authority for the years before 2019.
Undistributed Earnings of Foreign Subsidiaries
ASC 740-30 Income Taxes provides guidance that U.S. companies do not need to recognize tax effects on foreign earnings that are indefinitely reinvested. The Company repatriates earnings of its foreign subsidiaries and therefore has recognized a deferred tax liability of $
23. Shares Repurchased
On February 22, 2022, the Company’s Board of Directors approved an increase of $
F-42
During the years ended December 31, 2023, 2022 and 2021, the Company repurchased
As of December 31, 2023, $
In addition, as further described in Note 11, the Company also repurchased its Series C Preferred Stock, which was convertible into
24. Goodwill and Intangible Assets
Goodwill
|
Total |
|||
|
Balance at January 1, 2023 |
$ |
|
|
|
Changes |
|
||
|
Balance at December 31, 2023 |
$ |
|
|
____________
(1)
Goodwill was tested for impairment on November 30, 2023. The quantitative impairment test was performed using a market approach, whereby the market capitalization of the Company (a single reporting unit) was compared to its carrying value. The market capitalization was derived from the Company’s publicly traded stock price plus a reasonable control premium. The fair value of the reporting unit exceeded its carrying value and therefore no impairment was recognized.
Of the total goodwill of $
Intangible Assets
|
Balance at December 31, 2023 |
|||||||||
|
Item |
Gross Asset |
Accumulated |
Net Asset |
||||||
|
ETFS acquisition |
$ |
|
$ |
$ |
|
||||
|
Software development |
|
|
|
( |
|
|
|||
|
Balance at December 31, 2023 |
$ |
|
$ |
( |
$ |
|
|||
|
Balance at December 31, 2022 |
|||||||||
|
Item |
Gross Asset |
Accumulated |
Net Asset |
||||||
|
ETFS acquisition |
$ |
|
$ |
$ |
|
||||
|
Software development |
|
|
|
( |
|
|
|||
|
Balance at December 31, 2022 |
$ |
|
$ |
( |
$ |
|
|||
F-43
ETFS Acquisition (Indefinite-Lived)
In connection with the ETFS Acquisition, which was completed on
The Company performed its indefinite-lived intangible asset impairment test related to these customary advisory agreements on November 30, 2023. The results of this analysis identified no indicators of impairment to be recognized based upon a quantitative assessment (discounted cash flow analysis) which relied upon significant unobservable inputs including a projected revenue growth rate of
Software Development (Finite-Lived)
Internally-developed software is amortized over a useful life of years. During the years ended December 31, 2023 and 2022, the Company recognized amortization expense on internally-developed software of $
|
2024 |
$ |
|
|
|
2025 |
|
|
|
|
2026 |
|
|
|
|
2027 |
|
|
|
|
2028 |
|
|
|
|
2029 and thereafter |
|
||
|
Total expected amortization expense |
$ |
|
The weighted-average remaining useful life of the finite-lived intangible assets is years.
25. Contingent Payments
The Company recognized a gain of $
26. Impairments
|
Years Ended December 31, |
|||||||||
|
2023 |
2022 |
2021 |
|||||||
|
Lease termination–New York office (Note 13) |
$ |
$ |
$ |
|
|||||
|
Fixed assets–New York office (Note 8) |
|
|
|
|
|||||
|
Lease termination–London office (Note 13) |
|
|
|
|
|||||
|
Securrency (Note 7) |
|
|
|
|
|||||
|
Other investments (Note 7) |
|
|
|
|
|||||
|
Total |
$ |
|
$ |
$ |
|
||||
27. Subsequent Events
The Company evaluated subsequent events through the date of issuance of the consolidated financial statements. There were no events requiring disclosure.
F-44
EXHIBIT INDEX
|
Exhibit Number |
Description |
|
|
3.1 |
||
|
3.2 |
||
|
3.3 |
||
|
3.4 |
||
|
3.5 |
||
|
3.6 |
||
|
3.7 |
||
|
3.8 |
||
|
3.9 |
||
|
4.1 |
||
|
4.2 |
||
|
4.3 |
||
|
4.4 |
||
|
4.5 |
||
|
4.6 |
||
|
4.7 |
||
|
4.8 |
|
Exhibit Number |
Description |
|
|
4.9 |
||
|
4.10 |
||
|
4.11 |
||
|
4.12 |
||
|
4.13 |
||
|
4.14 |
||
|
4.15 |
||
|
4.16 |
||
|
4.17 |
||
|
10.1 |
||
|
10.2 |
||
|
10.3 |
||
|
10.4 |
||
|
10.5 |
||
|
10.6 |
||
|
10.7(a) |
||
|
10.7(b) |
|
Exhibit Number |
Description |
|
|
10.8 |
||
|
10.9 |
||
|
10.10 |
||
|
10.11 |
||
|
10.12 |
||
|
10.13 |
||
|
10.14 |
||
|
10.15 |
||
|
10.16 |
||
|
10.17 |
||
|
10.18 |
||
|
10.19 |
||
|
10.20 |
||
|
10.21 |
||
|
10.22 |
||
|
10.23 |
||
|
10.24 |
|
Exhibit Number |
Description |
|
|
10.25 |
||
|
10.26 |
||
|
10.27 |
||
|
10.28 |
||
|
10.29* |
||
|
10.30 |
||
|
10.31(1) |
||
|
21.1(1) |
||
|
23.1(1) |
Consent of Ernst & Young LLP, independent registered public accounting firm |
|
|
31.1(1) |
||
|
31.2(1) |
||
|
32.1(2) |
||
|
97(1) |
||
|
101 |
Financial Statements from the Annual Report on Form 10-K of the Company are attached to this report, formatted in XBRL pursuant to Rule 405 of Regulation S-T: (i) Consolidated Balance Sheets at December 31, 2023 and December 31, 2022; (ii) Consolidated Statements of Operations for the years ended December 31, 2023, December 31, 2022 and December 31, 2021; (iii) Consolidated Statements of Comprehensive Income/(Loss) for the years ended December 31, 2023, December 31, 2022 and December 31, 2021; (iv) Consolidated Statements of Changes in Stockholders’ Equity for the years ended December 31, 2023, December 31, 2022 and December 31, 2021; (v) Consolidated Statements of Cash Flows for the years ended December 31, 2023, December 31, 2022 and December 31, 2021 and (vi) Notes to the Consolidated Financial Statements. |
|
|
101.SCH |
Inline XBRL Taxonomy Extension Schema Document |
|
|
101.CAL |
Inline XBRL Taxonomy Extension Calculation Linkbase Document |
|
|
101.DEF |
Inline XBRL Taxonomy Extension Definition Linkbase Document |
|
|
101.LAB |
Inline XBRL Taxonomy Extension Labels Linkbase Document |
|
|
101.PRE |
Inline XBRL Taxonomy Extension Presentation Linkbase Document |
|
|
104(1) |
Cover Page Interactive Data File (formatted as inline XBRL with applicable taxonomy extension information contained in Exhibits 101.*) |
____________
* Schedules and exhibits to these Exhibits have been omitted in accordance with Item 601 of Regulation S-K. The Company agrees to furnish supplementally a copy of all omitted schedules and exhibits to the Securities and Exchange Commission or its staff upon request.
(1) Filed herewith.
(2) Furnished herewith.
SIGNATURES
Pursuant to the requirements of Section 13 or 15(d) of the Securities Exchange Act of 1934, the Registrant has duly caused this report to be signed on its behalf by the undersigned hereunto duly authorized.
|
WISDOMTREE, INC. |
||||
|
By: |
/s/ Jonathan Steinberg |
|||
|
February 23, 2024 |
Jonathan Steinberg |
|||
Pursuant to the requirements of the Securities Exchange Act of 1934, this report has been signed below by the following persons on behalf of the registrant and in the capacities indicated below on the 23rd day of February, 2024.
|
Signature |
Title |
|
|
/s/ Jonathan Steinberg |
Chief Executive Officer and Director |
|
|
Jonathan Steinberg |
(Principal Executive Officer) |
|
|
/s/ Bryan Edmiston |
Chief Financial Officer |
|
|
Bryan Edmiston |
(Principal Financial Officer and Principal Accounting Officer) |
|
|
/s/ Win Neuger |
Non-Executive Chair of the Board |
|
|
Win Neuger |
||
|
/s/ Lynn S. Blake |
Director |
|
|
Lynn S. Blake |
||
|
/s/ Anthony Bossone |
Director |
|
|
Anthony Bossone |
||
|
/s/ Smita Conjeevaram |
Director |
|
|
Smita Conjeevaram |
||
|
/s/ Rilla Delorier |
Director |
|
|
Rilla Delorier |
||
|
/s/ Daniela Mielke |
Director |
|
|
Daniela Mielke |
||
|
/s/ Shamla Naidoo |
Director |
|
|
Shamla Naidoo |
||
|
/s/ Tonia Pankopf |
Director |
|
|
Tonia Pankopf |